This section contains information on the available get
methods. The methods are listed in alphabetical order.
x
This method returns true (autofit enabled) or false
(autofit disabled) indicating whether or not a text object is automatically
fitted and sized.
Syntax:
boolean getAutofit(IdentObj id);
where:
- id
Is an object ID returned by a getObject() method (for example, getTitle()).
Note: You may also use one of the object-specific properties
to get the autofitting attribute of an object (for example, FootnoteAutofit,
LegendTextAutofit, O1LabelAutofit).
See setAutofit(), FootnoteAutofit, LegendTextAutofit, O1LabelAutofit, O1TitleAutofit, O2LabelAutofit, O2TitleAutofit, X1LabelAutofit, X1TitleAutofit, Y1LabelAutofit, Y1TitleAutofit, Y2LabelAutofit, Y2TitleAutofit
x
This method returns the label skipping mode that may
be assigned to primary ordinal (O1) axis labels.
Syntax:
int getAutoSkip();
int getAutoSkip(IdentObj id);
where:
- id
Is an object ID returned by a getObject() method (for example, getO1Label()).
This method returns the following values for label skipping:
- 0 (no label
skipping).
- 1 (automatic
label skip).
- 2 (manual label
skip).
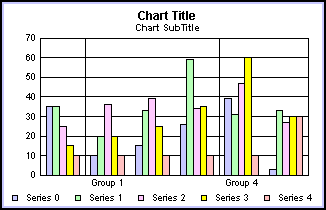
Example:
setDepthRadius(0);
setO1LabelAutoSkip(2);
setO1LabelSkipBegin(1);
setO1LabelSkipCount(getAutoSkip(getO1Label()));
Note:
- If a specific
object is not identified with the input parameter id, this method returns
the associated value (if any) for the first item in the selection
list.
- You may also
use the object-specific property to determine label skip mode (for example,
O1LabelAutoSkip).
See setAutoSkip(), O1LabelAutoSkip.
x
In multi-Y axis graphs, this method returns the axis
assignment (Y1, Y2, Y3, Y4, or Y5) for a series or an object.
Syntax:
int getAxisAssignment(IdentObj id);
int getAxisAssignment(int seriesID);
where:
- id
Is an object ID returned by a getObject() method (for example, getY1Axis()).
- seriesID
Is a series number.
This method returns the following values for axis assignments:
- 0 (Y1 axis)
- 1 (Y2 axis)
- 2 (Y3 axis)
- 3 (Y4 axis)
- 4 (Y5 axis)
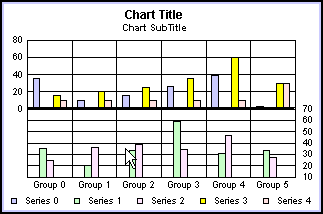
Example:
setGraphType(21);
setDepthRadius(0);
setAxisAssignment(2, getAxisAssignment(1));
See setAxisAssignment(), getAxisDescending(), setAxisDescending(), getAxisSide(), setAxisSide(), Y1AxisSide, Y2AxisSide.
x
This method returns a boolean that identifies whether
a numeric axis is drawn in ascending (false) or descending order
(true).
Syntax:
boolean getAxisDescending(IdentObj id);
where:
- id
Is an object ID returned by a getObject() method (for example, getY1Axis()).
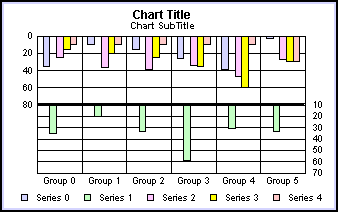
Example:
setGraphType(21);
setDepthRadius(0);
setAxisDescending(getY1Axis(),true);
setAxisDescending(getY2Axis(), getAxisDescending(getY1Axis()));
Note: You may also use one of the axis-specific properties
(for example, X1AxisDescending, Y1AxisDescending, and so on) to
get the descending attribute of an axis.
See setAxisDescending(), getAxisAssignment(), setAxisAssignment(), getAxisSide(), setAxisSide(), X1AxisDescending, Y1AxisDescending, Y2AxisDescending.
x
In multi-Y graphs (3 or more Y-axes), axes can overlap.
The setAxisOffset() and setAxisSize() methods can be used to create
a more desirable graph layout for multi-Y axes graphs. setAxisSize()
sets the size of the frame, setAxisOffset() sets the axis offset from
the base of the frame.
Syntax:
int getAxisOffset()
int getAxisOffset(IdentObj id)
where:
- id
Is an object ID returned by a getObject() method (for example, getY2Axis()).
This method returns the value (0...100) set by setAxisOffset()
for a specified Y-axis. The default value is 0 (automatic).
Example:
setAxisAssignment(getSeries(0), 0);
setAxisAssignment(getSeries(1), 1);
setAxisAssignment(getSeries(2), 2);
setAxisAssignment(getSeries(3), 2);
setAxisOffset(getY1Axis(), 0);
setAxisOffset(getY2Axis(), 20));
setAxisOffset(getY3Axis(), 75);
setAxisSize(getY1Axis(), getAxisOffset(getY2Axis()));
setAxisSize(getY2Axis(), 55);
setAxisSize(getY3Axis(), 25);
setGraphType(103);
setY1TitleString("Y1 Axis");
setY2TitleString("Y2 Axis");
setTextString(getY3Title(), "Y3 Axis");
setDepthRadius(0);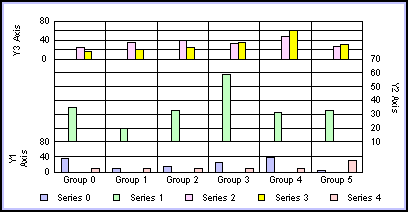
Note: If a specific object is not identified with the
input parameter id, this method returns the associated value (if
any) for the first item in the selection list.
See setAxisOffset().
x
This method returns an integer value that identifies
where an axis is imaged in the graph.
Syntax:
int getAxisSide(IdentObj id);
where:
- id
Is an object ID returned by a getObject() method (for example, getY1Axis()).
The returned integer values can be:
- 0 (left in vertical
graphs/bottom in horizontal graphs).
- 1 (right in
vertical graphs/top in horizontal graphs).
- 2 (both sides
of the graph).
Example:
setGraphType(21);
setDepthRadius(0);
setAxisSide(getY1Axis(),2);
setAxisSide(getY2Axis(), getAxisSide(getY1Axis()));
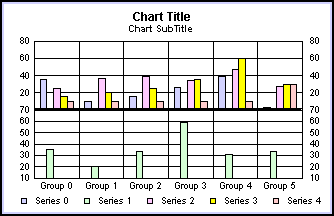
Note: You may also use one of the axis-specific properties
(for example, X1AxisSide, Y1AxisSide, and so on) to determine where
an axis is imaged.
See setAxisSide(), getAxisAssignment(), setAxisAssignment(), getAxisDescending(), setAxisDescending(), O1AxisSide, X1AxisSide, Y1AxisSide, Y2AxisSide.
x
In multi-Y graphs (3 or more Y-axes), axes can overlap.
The setAxisOffset() and setAxisSize() methods can be used to create
a more desirable graph layout for multi-Y axes graphs. setAxisSize()
sets the size of the frame, setAxisOffset() sets the axis offset from
the base of the frame.
Syntax:
int getAxisSize(IdentObj id)
where:
- id
Is an object ID returned by a getObject() method (for example, getY2Axis()).
This method returns the value (0...100) set by setAxisSize()
for a specified Y-axis. The default size is 0.
Example:
setAxisAssignment(getSeries(0), 0);
setAxisAssignment(getSeries(1), 1);
setAxisAssignment(getSeries(2), 2);
setAxisAssignment(getSeries(3), 2);
setAxisSize(getY1Axis(), 20);
setAxisSize(getY2Axis(), 55);
setAxisSize(getY3Axis(), 25);
setAxisOffset(getY1Axis(), 0);
setAxisOffset(getY2Axis(), getAxisSize(getY1Axis()));
setAxisOffset(getY3Axis(), 75);
setGraphType(103);
setY1TitleString("Y1 Axis");
setY2TitleString("Y2 Axis");
setTextString(getY3Title(), "Y3 Axis");
setDepthRadius(0);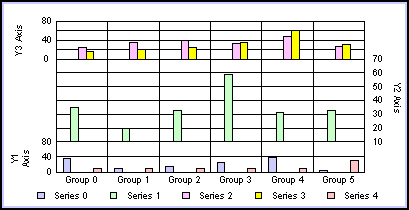
See setAxisSize().
x
This function returns a string that describes the border
of a specified object. The string can be one of the following: EmptyBorder,
CompoundBorder, BevelBorder, ShadowBorder, EtchedBorder, LineBorder,
or DoubleLineBorder.
Syntax:
cString getBorder(IdentObj anObject)
where:
- anObject
Is an Object ID returned by a getObject() method.
Note: Currently supported objects include: an annotation
object (for example, getAnnotationBox(0)), the title box object
(that is, getTitleBox()), the subtitle box object (that is, getSubtitleBox()),
or the footnote box object (that is, getFootnoteBox()).
See setBorder().
x
This method returns the border color of a specified object.
Syntax:
color getBorderColor (IdentObj id);
where:
- id
Is an object ID returned by a getObject() method (for example, getSeries()).
Example:
setDepthRadius(0);
setDepthAngle(0);
setBorderColor(getSeries(4),new Color(255,0,0));
setFillColor(getSeries(4),new Color(0,255,255));
setBorderColor(getSeries(0),getBorderColor(getSeries(4)));
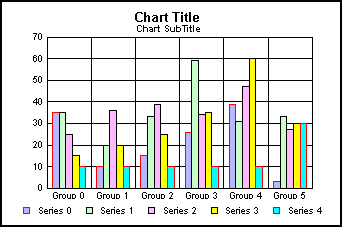
See setBorderColor(), getTransparentBorderColor(), setTransparentBorderColor(), setSeriesBorderColor().
x
This method gets the border type for a specified object.
The default value is NONE.
Syntax:
int getBorderType (IdentObj idObj);
where:
- idObj
Is the object ID returned by getAnnotationBox(), getBeveledLegend(), getBeveledLegendMarker(),
getFootnoteBox(), getSubtitleBox(), or getTitleBox().
This method returns an integer between 0 and 5 which identifies
the border type applied to a specified object.
See Beveled Borders and setBorderType().
x
This function returns the uniform insets set by setBorderWidth()
for all sides of an object.
Syntax:
Insets getBorder(IdentObj anObject)
where:
- anObject
Is an Object ID returned by a getObject() method.
Note: Currently supported objects include: an annotation
object (for example, getAnnotationBox(0)), the title box object
(that is, getTitleBox()), the subtitle box object (that is, getSubtitleBox()),
or the footnote box object (that is, getFootnoteBox()).
See setBorderWidth().
x
This method gets a graph from an FTP server. If the
returned value is true, than the file was successfully retrieved,
if the value is false, than the transmission failed.
Syntax:
boolean getChartFromFTP(
    java.lang.String strHost,
    java.lang.String strUser,
    java.lang.String strPass,
    java.lang.String strDir,
    java.lang.String strOrgFile);
where:
- strHost
Is the host name.
- strUser
Is the user name.
- strPass
Is the password.
- strDir
Is the directory location.
- strOrgFile
Is the file name.
See sendChartToFTP(), sendGIFToFTP().
xgetCornerArcWidth/Height()
These methods get the width and height of the corner arc of a
border applied to an object. The default value is 5.
Syntax:
getCornerArcHeight(IdentObj id);
getCornerArcWidth(IdentObj id);
where:
- id
Is the object ID returned by getAnnotationBox(), getBeveledLegend(), getBeveledLegendMarker(),
getFootnoteBox(), getSubtitleBox(), or getTitleBox().
These methods return the integer value of the height or width
of corner arc applied to an object.
xgetCurveFitPolynomialOrder()
If the setCurveFit() method selects a polynomial fit
line across a series of risers (that is, setCurveFit(FIT_POLYNOMIAL)),
this method returns the value that is assigned by setCurveFitPolynomialOrder().
The setCurveFitPolynomialOrder() method sets the order (the largest
power to which x is raised) for the polynomial fit. The default
value is 3. It may be set to a value in the range 0...10.
Syntax:
int getCurveFitPolynomialOrder(IdentObj id)
int getCurveFitPolynomialOrder(int seriesID)
where:
- id
Is an object ID returned by a getObjectID() method (for example, getSeries()).
- seriesID
Is a series number.
See setCurveFitPolynomialOrder(), getCurveFitType(), setCurveFitType().
x
This method returns the value assigned by the setCurveFitType()
method. The setCurveFitType() method selects a curve fit line and
draws the selected curve type across one or more series of risers
in a graph.
Syntax:
int getCurveFitType(IdentObj id)
int getCurveFitType(int seriesID)
where:
- id
Is an object ID returned by a getObjectID() method (for example, getSeries()).
- seriesID
Is a series number.
The curve fit type selected by setCurveFitType() returns the
following values:
CurveFitType Constant | Value | Description |
|---|
FIT_NONE | 0 | None |
FIT_LINEAR | 1 | Linear regression curve fit line |
FIT_QUADRATIC | 2 | Quadratic curve fit line |
FIT_POLYNOMIAL | 3 | Polynomial fit line |
FIT_HYPERBOLIC | 4 | Hyperbolic curve fit line |
FIT_LOGARITHMIC | 5 | Logarithmic curve fit line |
FIT_MODHYPERBOLIC | 6 | Modified hyperbolic |
FIT_RATIONAL | 7 | Rational curve fit line |
FIT_EXPONENTIAL | 8 | Exponential curve fit line |
FIT_MODEXPONENTIAL | 9 | Modified exponential |
FIT_LOGQUADRATIC | 10 | Logarithmic/Quadratic curve fit line |
FIT_GEOMETRIC | 11 | Geometric curve fit line |
See setCurveFitType(), CurveFitEquationDisplay, CurveFitHighOrderFirst.
x
This method returns a boolean set by setCustomDataText()
for a specified series object. If the returned value is true, custom
data text is enabled for the specified series; false indicates that
custom data text is not enabled.
Syntax:
boolean getCustomDataText(IdentObj idSeries)
where:
- idSeries
Is an object ID returned by a getObjectID() method (for example, getSeries()).
See setCustomDataText().
xgetCustomDataTextFormat()
This method returns an integer that indentifies the
custom data text format set by setCustomDataTextFormat() for a specified
series object.
Syntax:
int getCustomDataTextFormat(IdentObj idSeries)
where:
- idSeries
Is an object ID returned by a getObjectID() method
(for example, getSeries()).
Returned integer values represent the following custom data text
formats:
- -1
setCustomDataTextFormatPattern defines the pattern.
0...21 identifies a preset number format:
0/1 = # (for example, 123
= 123) | 12 = $#B (Show B for billions)
(for example, 1,234,567,891 = $1B) |
2 = #% (for example, 123
= 12,300%) | 13 = #T (Show T for trillions)
(for example, 1,234,567,891,234 = 1T) |
3 = #.#% (for example,
123 = 12,300.0%) | 14 = $#T (Show T for trillions)
(for example, 1,234,567,891,234 = $1T) |
4 = #.##% (for example,
123 = 12,300.00%) | 15 = Number with thousands
separators, no decimal places (for example, 1,234 = 1K) |
5 = $#.## (for example,
123 = $123.00) | 16 = Number with thousands
separators, two decimal places (for example, 1,234 = 1.23K) |
6 = $# (for example, 123
= $123) | 17 = General currency format
for current Locale |
7 = #K (Show K for values
over 999) (for example, 1,234 = 1K) | 18 = Short Date Format:
MM/DD/YY (for example, 10/01/03) |
8 = $#K (Show K for values
over 999) (for example, 1,234 = $1K) | 19 = Medium Date Format:
Mon. DD, YYYY (for example, Oct. 01, 2003) |
9 = #M (Show M for millions)
(for example, 1,234,567 = 1M) | 20 = Long Date Format:
Month DD, YYYY (for example, October 01, 2003) |
10 = $#M (Show M for millions)
(for example, 1,234,567 = $1M) | 21 = Full Date Format:
Day, Month DD, YYYY (for example, Wednesday, October 01, 2003) |
11 = #B (Show B for billions)
(for example, 1,234,567,891 = 1B) | |
See setCustomDataTextFormat().
xgetCustomDataTextFormatPattern()
This method returns the data text format pattern set
by setCustomDataTextFormatPattern() for a specified series.
Syntax:
String getCustomDataTextFormatPattern(IdentObj idSeries)
where:
- idSeries
Is an object ID returned by a getObjectID() method (for example, getSeries()).
Returned pattern strings identify the following formats:
- pattern:= subpattern{;subpattern}
- subpattern:=
{prefix}integer{.fraction}{suffix}
- prefix:= '\\u0000'..'\\uFFFD'
- specialCharacters
- suffix:= '\\u0000'..'\\uFFFD'
- specialCharacters
- integer:= '#'*
'0'* '0'
- fraction:= '0'*
'#'*
Notation:
- X*
0 or more instances of X
- (X|Y)
either X or Y.
- X..Y
any character from X up to Y, inclusive.
- S - T
characters in S, except those in T
The first subpattern is for positive numbers. The second (optional)
subpattern is for negative numbers. In both cases, a comma (,) can
occur inside the integer portion. The special characters used in
the parts of the subpattern are:
- 0
a digit
- #
a digit, zero shows as absent
- .
a period (.) is a placeholder for decimal separator
- ,
a comma (,) is a placeholder for grouping separator
- ;
a semicolon (;) separates formats
- -
a minus sign/dash (-) is the default negative prefix
- %
divide by 100 and show as percentage
- x
any other characters can be used in the prefix or suffix
- '
a single quote (') is used to quote special characters in
a prefix or suffix
If there is no explicit negative subpattern, a minus sign (-)
is prefixed to the positive form (i.e, "0.00" alone is equivalent
to "0.00;-0.00"). Illegal formats, such as "#.#.#" or mixing '_'
and '*' in the same format, will cause a ParseException. The ParseException string
will show where the error occurred. The grouping separator is commonly
used for thousands, but in some countries for ten-thousands. The
interval is a constant number of digits between the grouping characters,
such as 100,000,000 or 1,0000,0000. If you supply a pattern with
multiple grouping characters, the interval between the last one
and the end of the integer is the one that is used. So "#,##,###,####"
== "######,####" == "##,####,####".This class only handles localized
digits where the 10 digits are contiguous in Unicode, from 0 to
9.
See setCustomDataTextFormatPattern().
x
This method returns the numeric value for any row/column
intersection.
Syntax:
double getDataAsDouble(int row, int col);
where:
- row
Is the row from which to retrieve data.
- col
Is the column from which to retrieve data.
x
This method returns a value for any series/group intersection
and converts it to a string.
Syntax:
string getDataAsString (int row, int col);
where:
- row
Is the row from which to get the value.
- col
Is the column from which to get the value.
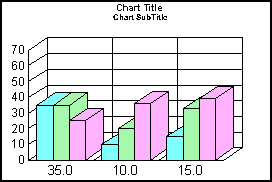
Example:
setScrollOffsetGroup(0);
setScrollOffsetSeries(0);
setViewableGroups(3);
setViewableSeries(3);
setDataScrollerPresenceGroups(0);
setDataScrollerPresenceSeries(0);
setGroupLabel(0,getDataAsString(0,0));
setGroupLabel(1,getDataAsString(0,1));
setGroupLabel(2,getDataAsString(0,2));
setLegendDisplay(false);
x
This method can be used to determine the location of
an object in a graph.
Syntax:
int getDataCoord (IdentObj id);
int getDataCoord(IdentObj id, DataItem item, boolean bCumulative
where:
- id
Is an object ID returned by a getObject() method (for example, getFrame()).
- item
Is a data item.
- bCumulative
Is either true or false.
This method returns the x,y coordinates of an object in a graph.
x
This method returns an integer value that identifies
the angle from center point where data text is drawn.
Syntax:
int getDataTextAngle(IdentObj id);
int getDataTextAngle(int seriesID);
int getDataTextAngle(int seriesID, int groupID);
where:
- id
Is an object ID returned by a getObject() method (for example, getDataText()).
- seriesID
Is a series number.
- groupID
Is a group number.
The returned integer value is the data text angle (0...360).
Example:
setDepthRadius(0);
setDataRange(0,0,2,2);
setDataTextDisplay(true);
setDataTextPosition(0);
setDataTextAngle(2,0,30);
setDataTextAngle(2,1,getDataTextAngle(2,0));
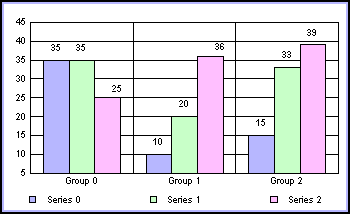
Note: The DataTextDisplay property must be set to true
in order for data text to be drawn in the graph. The DataTextPosition
property must be set to zero.
See setDataTextAngle(), getDataTextRadius(),setDataTextRadius(), DataTextAngleDefault, DataTextDisplay, DataTextPosition.
x
This method returns an integer value that identifies
the radius from center point where data text is drawn.
Syntax:
int getDataTextRadius(IdentObj id);
int getDataTextRadius(int seriesID);
int getDataTextRadius(int seriesID, int groupID);
where:
- id
Is an object ID returned by a getObject() method (for example, getDataText()).
- seriesID
Is a series number.
- groupID
Is a group number.
The returned integer is the data text radius (0...100).
Example:
setDepthRadius(0);
setDataRange(0,0,2,2);
setDataTextDisplay(true);
setDataTextPosition(0);
setDataTextRadius(2,0,0);
setDataTextRadius(2,1,getDataTextRadius(2,0));
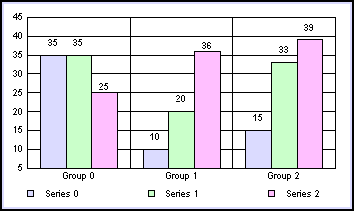
Note: DataTextDisplay must be set to true in order for
data text to be drawn in the graph.
See setDataTextRadius(), getDataTextAngle(), setDataTextAngle(), DataTextRadiusDefault, DataTextDisplay, DataTextPosition.
x
This method returns a data value for a data object (riser)
in a graph.
Syntax:
double getDataValue (IdentObj id);
where:
- id
Is an object ID returned by a getObject() method (for example, getSeriesGroup()).
Example:
setDepthAngle(0);
setDepthRadius(0);
setDataTextDisplay(true);
setDataValue(getSeriesGroup(0,0), 100);
setDataValue(getSeriesGroup(1,1), getDataValue(getSeriesGroup(0,0)));
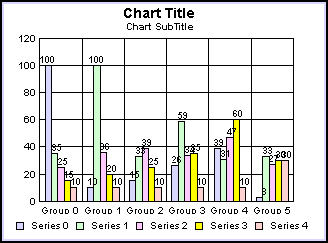
See setDataValue().
x
This method returns a boolean that identifies whether
or not an object is visible in a graph.
Syntax:
boolean getDisplay(IdentObj id);
where:
- id
Is an object ID returned by a getObject() method (for example, getTitle()).
Returned values can be true (the object is displayed) or false
(the object is not displayed).
Example:
setDepthRadius(0);
setDataRange(0,0,2,2);
setDataTextDisplay(getDisplay(getO1Label()));
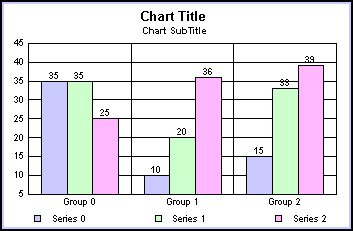
See setDisplay().
x
This method returns a boolean that identifies whether
or not off-scale data points are imaged in a graph.
Syntax:
boolean getDisplayOffScale(IdentObj id);
where:
- id
Is an object ID returned by a getObject() method (for example, getY1Axis()).
Returned values can be true (offscale values are drawn) or false
(offscale values are not drawn).
Example:
setDepthRadius(0);
setGraphType(21);
setDataValue(getSeriesGroup(0,0),100);
setDataValue(getSeriesGroup(1,1),140);
setDataRange(0,0,2,2);
setDataTextDisplay(true);
setY1TitleString("Y1 Axis");
setY2TitleString("Y2 Axis");
setDisplayOffScale(getY1Axis(),true);
setDisplayOffScale(getY2Axis(), getDisplayOffScale(getY1Axis()));
setY1ScaleMax(80.0);
setY2ScaleMax(120);
setY2ScaleMaxAuto(false);
setY1ScaleMaxAuto(false);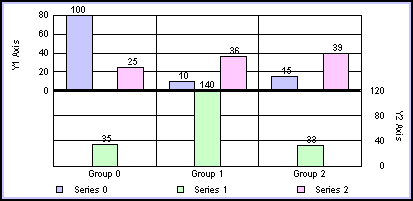
Note: You may also use one of the object-specific properties
to determine the off-scale display attribute of a specific object
(for example, X1OffScaleDisplay, Y1OffScaleDisplay, and so on).
See setDisplayOffScale(), X1OffScaleDisplay, Y1OffScaleDisplay, Y2OffScaleDisplay.
xgetDocumentHeightInPoints()
This method returns the document/graph height in points.
It is a convenience function that converts the document height in
TWIPs to points. The height in TWIPs is defined by the DocumentHeightInTwips
property.
Syntax:
int getDocumentHeightInPoints();
Input:
None
Note: A TWIP is 1/20th point or 1/100th millimeter. The
document size is used to calculate the size of text using absolute
font sizes.
See DocumentHeightInTwips, setFontSizeAbsolute().
xgetDocumentWidthInPoints()
This method returns the document width in points as
an integer. It is a convenience function that converts the document
width in TWIPs (set by setDocumentWidthInTwips()) to points.
Syntax:
int getDocumentWidthInPoints();
Note: A TWIP is 1/20th point or 1/100th millimeter. The
document size is used to calculate the size of text using absolute
font sizes.
See DocumentWidthInTwips, setFontSizeAbsolute().
xgetDrawTicksPerpendicular()
In 2D graphs where depth effect can be applied with
DepthAngle and DepthRadius and independent tick marks are drawn,
this method returns true when ticks are drawn perpendicular to axis,
and false when ticks are not drawn at an angle.
Syntax:
boolean getDrawTicksPerpendicular(IdentObj id)
- id
object ID returned by a getObject() method. It must be one
of the tick mark objects (for example, getY1MajorTick()).
See setDrawTicksPerpendicular().
x
The value assigned to the ColorMode property defines
the basic color scheme for coloring riser objects in a graph. However,
some graph types (3D surface and 3D connected groups) prefer color-by-height,
and most prefer color-by-series. These preferences can usually be
overridden by an explicit ColorMode setting.
Syntax:
int getEffectiveColorMode()
This method returns the actual color mode used regardless of
the ColorMode setting. Values can be:
- 0 (automatic).
Use the group as the series if there is only one series. 3D connected
series ribbon and areas are colored by series. 3D group ribbon and
areas are colored by group.
- 1 (color by
series).
- 2 (color by
group).
See ColorMode.
xgetEffectiveGroupOffset()
This method can be used to determine whether or not
all groups in the data set are imaged in the graph.
Syntax:
int getEffectiveGroupOffset();
This method returns the effective group offset (that is, the
total number of groups in the data set minus the number of viewable
groups). The number of viewable groups is set by the ViewableGroups
property.
Example:
setDepthRadius(0);
setViewableGroups(3);
setScrollOffsetGroup(2);
setDataTextDisplay(true);
setDataValue(getSeriesGroup(0,2),  getEffectiveGroupOffset());
setDataValue(getSeriesGroup(1,2),getScrollOffsetGroup());
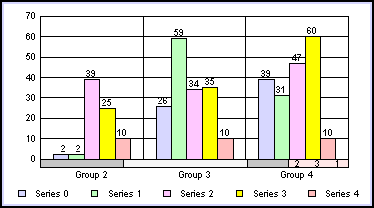
See getEffectiveSeriesOffset(), ViewableGroups, ScrollOffsetGroup.
xgetEffectiveSeriesOffset()
This method can be used to determine whether or not
all series in the data set are being imaged in the graph.
Syntax:
int getEffectiveSeriesOffset();
This method returns the effective series offset (that is, the
total number of series in the data set minus the number of viewable
series). The number of viewable series is set by the ViewableSeries
property.
Example:
setDepthRadius(0);
setDataScrollerPresenceGroups(0);
setDataScrollerPresenceSeries(0);
setViewableSeries(3);
setScrollOffsetSeries(3);
setDataValue(getSeriesGroup(2,0),  getEffectiveSeriesOffset());
setDataTextDisplay(true);
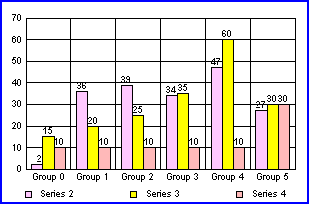
See getEffectiveGroupOffset(), ViewableSeries, ScrollOffsetSeries.
xgetEffectiveViewableGroups()
This method can be used to determine whether or not
data scrolling is being used in the graph.
Syntax:
int getEffectiveViewableGroups();
If this method returns a value greater than zero, it indicates
the ViewableGroups property is set to a value greater than zero
(that is, not all groups in the data set are imaged). A value of
zero indicates the number of imaged groups is the same as the number of
groups in the data set.
Example:
setDepthRadius(0);
setViewableGroups(3);
setScrollOffsetGroup(2);
setDataTextDisplay(true);
setDataValue(getSeriesGroup(0,2),  getEffectiveViewableGroups());
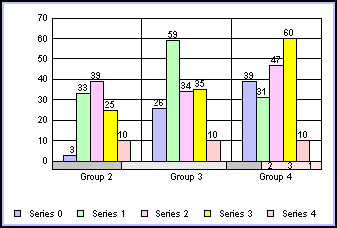
See getEffectiveGroupOffset(), getEffectiveSeriesOffset(), getEffectiveViewableSeries(), ViewableSeries, ScrollOffsetSeries.
xgetEffectiveViewableSeries()
This method can be used to determine whether or not
data scrolling is being used in the graph.
Syntax:
int getEffectiveViewableSeries();
If this method returns a value greater than zero, it indicates
the ViewableSeries property is set to a value greater than zero
(that is, not all series in the data set are imaged). A value of
zero indicates the number of imaged series is the same as the number
of series in the data set (that is, ViewableSeries=0).
Example:
setDepthRadius(0);
setDataScrollerPresenceGroups(0);
setDataScrollerPresenceSeries(0);
setViewableSeries(3);
setScrollOffsetSeries(3);
setDataValue(getSeriesGroup(2,0),  getEffectiveViewableSeries());
setDataTextDisplay(true);
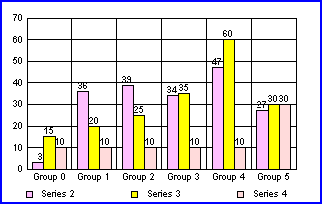
See getEffectiveGroupOffset(), getEffectiveSeriesOffset(), getEffectiveViewableGroups(), ViewableSeries, ScrollOffsetSeries.
x
This method returns a boolean that indicates whether
or not the maximum label is excluded from an axis.
Syntax:
boolean getExcludeMaxLabel(IdentObj id);
where:
- id
Is an object ID returned by a getObject() method (for example, getY1Label()).
Returned values can be true (the maximum label is excluded) or
false (the maximum label is included).
Example:
setDepthAngle(0);
setDepthRadius(0);
setViewableGroups(3);
setViewableSeries(3);
setDataScrollerPresenceGroups(0);
setO1ExcludeMaxLabel(true);
setExcludeMaxLabel(getY1Label(),  getExcludeMaxLabel(getO1Label()));
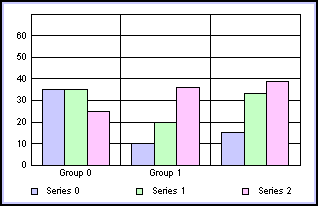
Note: You may also use one of the axis-specific properties
to determine whether or not the maximum label is excluded from a
particular axis (for example, O1ExcludeMaxLabel, O2ExcludeMaxLabel,
X1ExcludeMaxLabel, and so on).
See setExcludeMaxLabel(), getExcludeMinLabel(), setExcludeMinLabel(), O1ExcludeMaxLabel, O2ExcludeMaxLabel, X1ExcludeMaxLabel, Y1ExcludeMaxLabel, Y2ExcludeMaxLabel.
x
This method returns a boolean that indicates whether
or not the minimum label is excluded from an axis in a graph.
Syntax:
boolean getExcludeMinLabel(IdentObj id);
where:
- id
Is an object ID returned by a getObject() method (for example, getY1Label()).
Returned values can be true (the minimum label is excluded) or
false (the minimum label is included).
Example:
setDepthAngle(0);
setDepthRadius(0);
setViewableGroups(3);
setViewableSeries(3);
setDataScrollerPresenceGroups(0);
setO1ExcludeMinLabel(true);
setExcludeMinLabel(getY1Label(),getExcludeMinLabel(getO1Label()));
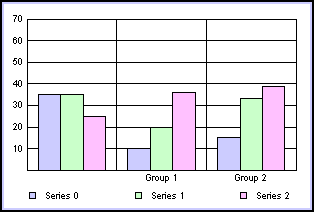
Note: You may also use one of the axis-specific properties
to determine whether or not minimum labels are excluded on an axis
(for example, O1ExcludeMinLabel, O2ExcludeMinLabel, X1ExcludeMinLabel,
and so on).
See setExcludeMinLabel(), getExcludeMaxLabel(), setExcludeMaxLabel(), O1ExcludeMinLabel, O2ExcludeMinLabel, X1ExcludeMinLabel, Y1ExcludeMinLabel, Y2ExcludeMinLabel.
x
This method returns the value of a fill color for an
object in a graph. If the value is null, this means that no fill
color is applied.
Syntax:
Color getFillColor (IdentObj id);
where:
- id
Is an object ID returned by a getObject() method (for example, getSeries()).
Example:
setDepthRadius(0);
setGraphType(32);
setFillType(getSeries(0), 1);
setFillColor(getSeries(0), new Color(245,175,224));
setFillType(getSeries(1), 1);
setFillColor(getSeries(2), getFillColor(getSeries(0)));
setFillType(getSeries(4), 1);
setFillColor(getSeries(4), getFillColor(getSeries(0)));
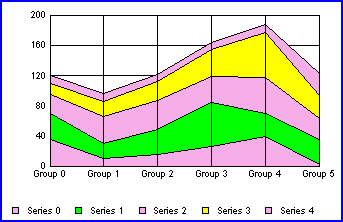
See setFillColor(), getBorderColor(), setBorderColor(), getFillType(), setFillType(), getTransparentFillColor(), setTransparentFillColor(), setSeriesFillColor().
x
This method returns an integer
that identifies the fill type assigned to an object.
Syntax:
int getFillType (IdentObj id);
where:
- id
Is an object ID returned by a getObject() method (for example, getSeries()).
Returned fill type values can be:
- 1 (color)
- 2 (gradient)
- 3 (texture)
Example:
setDepthRadius(0);
setGraphType(32);
setFillType(getSeries(0), 1);
setFillColor(getSeries(0), new Color(245,175,224));
setFillType(getSeries(1), getFillType(getSeries(0)));
setFillColor(getSeries(2), getFillColor(getSeries(0)));
setFillType(getSeries(4), getFillType(getSeries(0)));
setFillColor(getSeries(4), getFillColor(getSeries(0)));
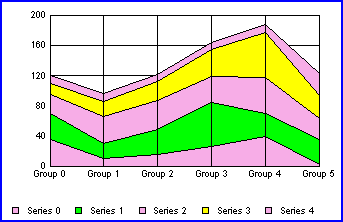
See setFillType(), getFillColor(), setFillColor().
x
This method returns a string
that identifies the font name assigned to a text object. If the
string is null, then no font name has been applied.
Syntax:
String getFontName(IdentObj id);
where:
- id
Is an object ID returned by a getObject() method (for example, getFootnote()).
Example:
setDepthAngle(0);
setDepthRadius(0);
setViewableSeries(3);
setDataScrollerPresenceSeries(0);
setViewableGroups(3);
setDataScrollerPresenceGroups(0);
setFontName(getTitle(), "Courier");
setFontName(getFootnote(), getFontName(getTitle()));
setFontName(getSubtitle(), getFontName(getTitle()));
setFontName(getO1Label(), getFontName(getTitle()));
setFontName(getY1Label(), getFontName(getTitle()));
setFontName(getLegendText(), getFontName(getTitle()));
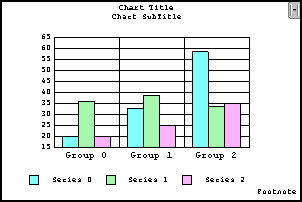
See setFontName(), getFontSizeVC(), setFontSizeVC(), getFontStyle(), setFontStyle(), setFontSize().
x
This method returns a font size in destination coordinates.
It can be an integer value in the range 1...128 (inclusive) identifying
the font size. The default is 12.
Syntax:
int getFontSize();
int getFontSize(IdentObj id);
where:
- id
Is an object ID returned by a getObject() method (for example, getFootnote()).
Example:
setDepthAngle(0);
setDepthRadius(0);
setFontSizeAbsolute(getTitle(), true);
setFontSizeAbsolute(getSubtitle(), true);
setFontSize(getSubtitle(), 24);
setFontSize(getTitle(), getFontSize(getSubtitle()));
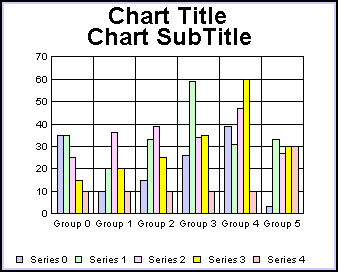
Note:
- If a specific
object is not identified with the input parameter id, this method returns
the associated value (if any) for the first item in the selection
list.
- This method
has been replaced by setFontSizeInPoints() when setFontSizeAbsolute()
is true.
See getFontSizeVC(), setFontSize(), setFontSizeAbsolute(), setFontSizeVC().
x
This function returns the boolean value set by setFontSizeAbsolute(). When
true, setFontSizeInPoints() must be used to set a text object's
font size in points. When false, setFontSizeVC() must be used to
set a text object's font size in virtual coordinates.
Syntax:
boolean getFontSizeAbsolute(IdentObj id)
where:
- id
Is an object ID returned by a getObject() method (for example, getFootnote()).
See setFontSizeAbsolute().
x
This function returns a text object's font size in points
(1...128) that has been set by setFontSizeInPoints(). The default
value is 12.
Syntax:
int getFontSizeInPoints(IdentObj id)
where:
- id
Is an object ID returned by a getObject() method (for example, getFootnote()).
See setFontSizeAbsolute(), setFontSizeInPoints().
x
This method returns a font size in virtual coordinates.
Syntax:
int getFontSizeVC(IdentObj id);
where:
- id
Is an object ID returned by a getObject() method (for example, getTitle()).
Example:
setDepthAngle(0);
setDepthRadius(0);
setFontSizeAbsolute(getTitle(), false);
setFontSizeAbsolute(getSubtitle(), false);
setFontSizeVC(getSubtitle(), 2000);
setFontSizeVC(getTitle(),getFontSizeVC(getSubtitle()));
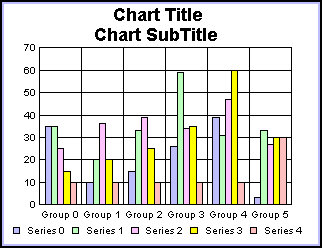
See setFontSizeVC(), getFontSize(), setFontSize(), setFontSizeAbsolute().
x
This method returns an integer that identifies the font
style assigned to a text object.
Syntax:
int getFontStyle(IdentObj id);
where:
- id
Is an object ID returned by a getObject() method (for example, getFootnote()).
Returned font styles can be:
0 = Plain | 4 = |
1 = Italic | 5 = Italic/Underline |
2 = Bold | 6 = Bold/Underline |
3 = Italic/Bold | 7 = Bold/Italic/Underline |
Example:
setAutofit(getTitle(),false);
setFontSizeVC(getTitle(),3400);
setAutofit(getSubtitle(),false);
setFontSizeVC(getSubtitle(), getFontSizeVC(getTitle()));
setFontStyle(getTitle(),3);
setFontStyle(getSubtitle(), getFontStyle(getTitle()));
setDepthAngle(0);
setDepthRadius(0);
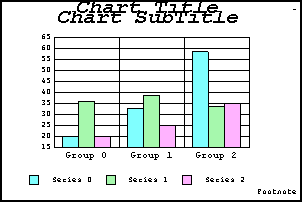
See setFontStyle(), getFontSizeVC(), setFontSizeVC(), getFontName(), setFontName(), setFontSize().
x
This method returns the depth offset of a graph frame
where a DepthAngle has been applied to form a 3D effect (2.5D) on
a 2D graph.
Syntax:
Point getFrameDepthOffset ();
See DepthAngle, DepthRadius.
x
This method returns the frame rectangle translated to
destination coordinates. It makes the rectangle smaller by one pixel
in each dimension and translates it to virtual coordinates.
Syntax:
Rectangle getFrameRect(boolean bInner);
where:
- bInner
Can be one of the following:
true for
the inside edge of frame.
false for the outside
edge of frame.
Example:
setDisplay(getY1AxisLine(),false);
setDisplay(getY1MajorGrid(),false);
setDisplay(getO1MajorGrid(),false);
setDisplay(getFrame(),false);
setLegendRect(getFrameRect(false));
setDataRange(1,1,3,3);
setDepthAngle(0);
setDepthRadius(0);
setViewableSeries(3);
setDataScrollerPresenceSeries(0);
setViewableGroups(3);
setDataScrollerPresenceGroups(0);
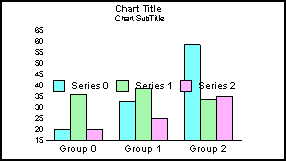
See getRect(), setRect().
x
This method returns an integer
that identifies the direction of a gradient.
Syntax:
int getGradientDirection(IdentObj id);
where:
- id
Is an object ID returned by a getObject() method (for example, getSeries()).
Returned integer values can be one of the following gradient
directions:
1 = right | 9 = radial |
2 = left | 10 = radial/top/left |
3 = down | 11 = radial/top/right |
4 = up | 12 = radial/bottom/left |
5 = down/left | 13 = radial/bottom/right |
6 = up/left | 16 = radial pie |
7 = down/right | 17 = inverted radial pie |
8 = up/right | |
See setGradientDirection().
x
This method returns the number of pins in a gradient.
Syntax:
int getGradientNumPins(IdentObj id);
where:
- id
Is an object ID returned by a getObject() method (for example, getSeries()).
See setGradientNumPins().
xgetGradientPinLeftColor()
This method returns the color used by the left pin of
a gradient.
Syntax:
Color getGradientPinLeftColor(IdentObj id, int nIndex);
where:
- id
Is an object ID returned by a getObject() method (for example, getSeries()).
- nIndex
Is the number of pins in the gradient.
See setGradientPinLeftColor().
x
This method returns a value that identifies the pin
position of a gradient (0.0 to 1.0).
Syntax:
double getGradientPinPosition(IdentObj id, int nIndex);
where:
- id
Is an object ID returned by a getObject() method (for example, getSeries()).
- nIndex
Is the number of pins in the gradient.
See setGradientPinPosition().
xgetGradientPinRightColor()
This method returns the color used by the right pin
of a gradient.
Syntax:
Color getGradientPinRightColor(IdentObj id, int nIndex);
where:
- id
Is an object ID returned by a getObject() method (for example, getSeries()).
- nIndex
Is the number of pins in the gradient.
See setGradientPinRightColor().
x
This method returns the number
of minor grid lines on the primary ordinal (O1) axis.
Syntax:
int getGridCount(IdentObj id);
int getGridCount(int objectID);
where:
- id
Is an object ID returned by a getObject() method (for example, getO1MinorGrid()).
Example:
setDepthRadius(0);
setDisplay(getO1MinorGrid(), true);
setGridStyle(getO1MinorGrid(), 4);
setGridCount(getO1MinorGrid(), 5);
setY1MajorGridStepAuto(false);
setY1MajorGridStep(getGridCount(getO1MinorGrid()));
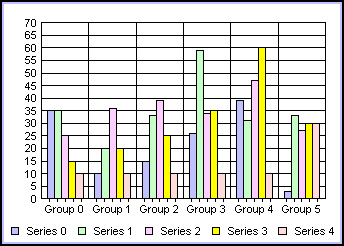
Note: You may also use O1MinorGridCount to determine the
count of minor grid lines.
See setGridCount(), O1MinorGridCount.
x
This method returns the number of grid steps assigned
to a numeric axis.
Syntax:
double getGridStep(IdentObj id);
where:
- id
Is an object ID returned by a getObject() method (for example, getY1MajorGrid()).
Example:
setDepthAngle(0);
setDepthRadius(0);
setViewableGroups(3);
setViewableSeries(3);
setDataScrollerPresenceGroups(0);
setY1MajorGridStepAuto(false);
setGridStep(getY1MajorGrid(),getGridStep(getO1MajorGrid());
setLineWidth(getY1MajorGrid(),2);
setFillColor(getY1MajorGrid(), new Color (0,0,255));
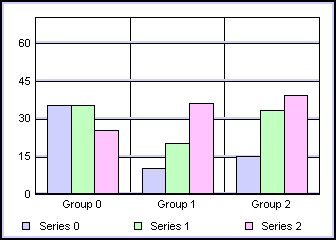
Note: You may also use one of the axis-specific properties
to determine the number of grid steps assigned on an axis (for example,
X1MajorGridStep, X1MinorGridStep, Y1MajorGridStep, and so on).
See setGridStep(), getGridStepAuto(), setGridStepAuto().
x
This method returns a boolean that indicates whether
or not grid steps are automatically calculated for a numeric axis.
Syntax:
boolean getGridStepAuto(IdentObj id);
where:
- id
Is an object ID returned by a getObject() method (for example, getY1MajorGrid()).
Returned values can be true (grid steps are automatically calculated)
or false (grid steps are not automatically calculated).
Example:
setDepthRadius(0);
setViewableGroups(3);
setViewableSeries(3);
setDataScrollerPresenceGroups(0);
setDisplay(getO1MinorGrid(), getGridStepAuto(getY1MajorGrid()));
setLineWidth(getO1MinorGrid(),2);
setFillColor(getO1MinorGrid(), new Color (0,0,255));
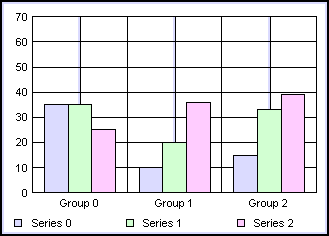
Note: You may also use one of the axis-specific properties
to determine whether or not grid steps are automatically calculated
on an axis (for example, X1MajorGridStepAuto, X1MinorGridStepAuto,
and so on).
See setGridStepAuto(), X1MajorGridStepAuto, X1MinorGridStepAuto, Y2MajorGridStepAuto, Y2MinorGridStepAuto, Y1MajorGridStepAuto, Y1MinorGridStepAuto.
x
This method returns an integer that identifies the style
of grid lines assigned to an axis.
Syntax:
int getGridStyle(IdentObj id);
where:
- id
Is an object ID returned by a getObject() method (for example, getY1MajorGrid()).
Returned integer values can be one of the following grid styles:
- 0 (no grid)
- 1 (normal grid)
- 2 (grids and
ticks)
- 3 (inner ticks)
- 4 (outer ticks)
- 5 (spanned ticks)
Example:
setDepthRadius(0);
setViewableGroups(3);
setViewableSeries(3);
setDataScrollerPresenceGroups(0);
setDisplay(getO1MinorGrid(), getGridStepAuto(getY1MajorGrid()));
setLineWidth(getO1MinorGrid(),2);
setFillColor(getO1MinorGrid(), new Color (0,0,255));
setGridStyle(getO1MinorGrid(), 3);
setGridStyle(getY1MajorGrid(), getGridStyle(getO1MinorGrid()));
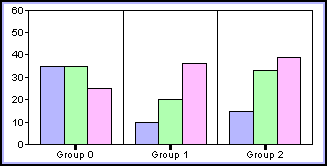
See setGridStyle(), O1MajorGridStyle, O1MinorGridStyle, X1MajorGridStyle, X1MinorGridStyle, Y1MajorGridStyle, Y1MinorGridStyle, Y2MajorGridStyle, Y2MinorGridStyle.
x
This method returns a group label string for a specific
object ID or group.
Syntax:
String getGroupLabel(IdentObj id);
String getGroupLabel(int groupID);
where:
- id
Is an object ID returned by a getObject() method (for example, getGroup()).
- groupID
Is a group number.
Example:
setDepthAngle(0);
setDepthRadius(0);
setViewableGroups(3);
setViewableSeries(3);
setDataScrollerPresenceGroups(0);
setTitleString(getGroupLabel(0));
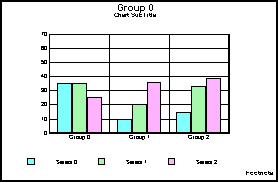
See setGroupLabel(), getDataLabel(), setDataLabel(), getSeriesLabel(), setSeriesLabel().
x
This method indicates whether or not the graph contains
2D graphics. Returned values can be true (the graph has 2D graphics)
or false (the graph does not have 2D graphics).
Syntax:
boolean getHasGraphics2D()
x
This method indicates whether or not a particular series
is set to be ignored by setIgnoreSeries(). Returned values can be
true (the series is ignored) or false (the series is not ignored).
Syntax:
boolean getIgnoreSeries (IdentObj id);
boolean getIgnoreSeries (int seriesID);
where:
- id
Is an object ID returned by a getObject() method (for example, getSeries(1)).
- seriesID
Is a series number.
See setIgnoreSeries().
x
This method returns the uniform insets for all sides
of an annotation, title box, subtitle box, or footnote box object.
Syntax:
Insets getInsets(IdentObj anObject)
where:
- anObject
Is an object ID returned by a getObject() method.
Note: Currently supported objects include: an annotation
object (for example, getAnnotationBox(0)), the title box object
(that is, getTitleBox()), the subtitle box object (that is, getSubtitleBox()),
or the footnote box object (that is, getFootnoteBox()).
See setInset().
x
These methods get the top/bottom and right/left insets of borders
of a specified object. The default value is 1 (which is essentially
off).
Syntax:
getBottomInset(IdentObj idObj);
getLeftInset(IdentObj idObj);
getRightInset(IdentObj idObj);
getTopInset(IdentObj idObj);
where:
- idObj
Is the object ID returned by getAnnotationBox(), getBeveledLegend(), getBeveledLegendMarker(),
getFootnoteBox(), getSubtitleBox(), or getTitleBox().
Return:
int; For get...Inset(), the inset of the border in virtual coordinates.
See Beveled Borders.
x
This method indicates whether or not labels are staggered
on an axis. Returned values can be true (labels are staggered) or
false (labels are not staggered).
Syntax:
boolean getLabelStagger();
boolean getLabelStagger(IdentObj id);
where:
- id
Is an object ID returned by a getObject() method (for example, getO1Label()).
Example:
setViewableSeries(3);
setDataScrollerPresenceSeries(0);
setViewableGroups(3);
setDataScrollerPresenceGroups(0);
setLabelStagger(getO1Label(),true);
setLabelStagger(getY1Label(), getLabelStagger(
    getO1Label()));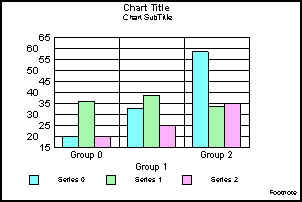
Note:
- If a specific
object is not identified with the input parameter id, this method returns
the associated value (if any) for the first item in the selection
list.
- You may also
use one of the axis-specific properties to determine whether or
not labels are staggered on a particular axis (for example, X1LabelStagger,
Y1LabelStagger, Y2LabelStagger, and so on).
See setLabelStagger(), O1LabelStagger, X1LabelStagger, Y1LabelStagger, Y2LabelStagger.
x
This method returns the smallest width (in virtual coordinates)
such that none of the legend labels will wrap or truncate. Note
that since it specifically calculates a width, it is applicable
to vertical legends only. If you try to call this method on a horizontal legend,
or before the legend has been created, this method returns zero.
Syntax:
int getLegendMinWidth ();
x
This function returns the date format string set by
setLevelDateFormat() for a graph that uses a time scale axis.
Syntax:
String getLevelDateFormat(int level)
where:
- int
Is the level (0...2) from which to get the date format.
Note: A time scale axis can only be defined in clustered
bar, stacked bar, line, and scatter graphs.
See setLevelDateFormat() and Time Scale Axis Graphs.
x
This function returns the fill color assigned to the
specified object or level, set by setLevelFillColor() for a graph
that uses a time scale axis.
Syntax:
Color getLevelFillColor(IdentObj id)
Color getLevelFillColor(int level)
- id
Is an object ID of the level from which to get the fill color
(that is, getTimeScaleLevel(n);).
- level
Is the level (0...2) from which to get the fill color.
Note: A time scale axis can only be defined in clustered
bar, stacked bar, line, and scatter graphs.
See setLevelFillColor() and Time Scale Axis Graphs.
x
This function returns the level height set by setLevelHeight()
for a graph that uses a time scale axis.
Syntax:
int getLevelHeight(int level)
where:
- level
Is the level (0...2) from which to get the level height.
Note: A time scale axis can only be defined in clustered
bar, stacked bar, line, and scatter graphs.
See setLevelHeight() and Time Scale Axis Graphs.
x
This function returns the level interval set by setLevelInterval()
for a graph that uses a time scale axis.
Syntax:
int getLevelInterval(int level)
where:
- level
Is the level (0...2) from which to get the interval.
TIME_INTERVAL_UNDEFINED = 0
TIME_INTERVAL_SECONDS = 1
TIME_INTERVAL_MINUTES = 2
TIME_INTERVAL_HOURS = 3
TIME_INTERVAL_DAYS = 4
TIME_INTERVAL_WEEKS = 5
TIME_INTERVAL_MONTHS = 6
TIME_INTERVAL_QUARTERS = 7
TIME_INTERVAL_YEARS = 8
Note: A time scale axis is only defined in clustered/stacked
bar, line, and scatter graphs.
See setLevelInterval() and Time Scale Axis Graphs.
x
This function returns the level text format integer
set by setLevelTextFormat() for a graph that uses a time scale axis.
Syntax:
int getLevelTextFormat(int level)
- level
Is the level from which to get the text format (0...2).
Note: A time scale axis is only defined in clustered/stacked
bar, line, and scatter graphs.
See setLevelTextFormat() and Time Scale Axis Graphs.
x
This method returns the line basic stroke type set by setLineBasicStrokeType()
for a specified line object.
Syntax:
int getLineBasicStrokeType(IdentObj id)
- id
Is an object ID of a line object returned by a getObject()
method (that is, getY1MajorGrid())
Returned integer (0...5) values can be
one of the following basic stroke types:
0 = Don't use Java2D. Draw line with regular
JDK 1.1.8 code
1 = Use Java2D BasicStroke() which constructs
a new BasicStroke with defaults for all attributes.
2 = Use Java2D BasicStroke(float width) which
constructs a solid BasicStroke with the specified line width and
default values for the cap and join styles.
3 = Use Java2D BasicStroke(float width, int
cap, int join) which constructs a solid BasicStroke with the specified
attributes.
4 = Use Java2D BasicStroke(float width, int
cap, int join, float miterlimit) which constructs a solid BasicStroke
with the specified attributes.
5 = Use Java2D BasicStroke(float width, int
cap, int join, float miterlimit, float[] dash, float dash_phase)
which constructs a new BasicStroke with the specified attributes
See setLineBasicStrokeType().
x
This method returns the cap style that has been applied
to a specified line object by setLineCap().
Syntax:
int getLineCap(IdentObj id)
where:
- id
Is the object ID of a line object returned by a getObject()
method (that is, getY1MajorGrid())
The method return an integer that defines the decoration that
has been applied to the ends of unclosed subpaths and dash segments
of a specified line as defined by the Java 2D BasicStroke object
(for example, CAP_BUTT, CAP_ROUND or CAP_SQUARE). See the java.awt.BasicStroke
constructors for values that may be returned by this method.
See setLineCap().
x
This method returns a vector (java.lang.Float) of floating
point numbers that defines the dash pattern set by setLineDash()
for a specified line object.
Syntax:
Vector getLineDash(IdentObj id)
where:
- id
Is an object ID of a line object returned by a getObject()
method (that is, getY1MajorGrid()).
See setLineDash().
x
This method returns an array representing the lengths
of the dash segments specified by setLineDash() for a specified
line object. It translates a Vector of Floats into a float[] array.
Syntax:
float[] getLineDashFloat(IdentObj id)
- id
Is an object ID of a line object returned by a getObject()
method (that is, getY1MajorGrid())
See setLineDash().
x
The method returns the current dash phase. The dash
phase is a distance specified in user coordinates that represents
an offset into the dashing pattern. In other words, the dash phase
defines the point in the dashing pattern that will correspond to
the beginning of the stroke. This value is set by setLineDashPhase().
Syntax:
float getLineDashPhase(IdentObj id)
- id
Is an object ID of a line object returned by a getObject()
method (that is, getY1MajorGrid())
See setLineDashPhase().
x
This method returns an integer that defines a line object's
join decoration applied by setLineJoin(). A join decoration is a
decoration that has been applied where path segments meet (for example,
JOIN_ROUND, JOIN_BEVEL, or JOIN_MITER).
Syntax:
int getLineJoin(IdentObj id)
where:
- id
Is an object ID of a line object returned by a getObject()
method (that is, getY1MajorGrid())
Note: See the java.awt.BasicStroke constructors for constants
that can be specified in NewValue.
See setLineJoin().
x
When setLineJoin() applies JOIN_MITER to a line object,
this method returns a value that defines the limit to trim the miter
join. This value is set by setLineMiterLimit()
Syntax:
float getLineMiterLimit(IdentObj id)
- id
Is an object ID of a line object returned by a getObject()
method (that is, getY1MajorGrid()).
See getLineJoin(), setLineJoin(), setLineMiterLimit().
x
This method returns the thickness (in pixels) of a series
line.
Syntax:
int getLineWidth (IdentObj id)
where:
- id
Is the object ID of a line object.
Example:
setGraphType(41);
setY1MajorGridStep(10.0);
setLineWidth(getSeries(0),10);
setLineWidth(getSeries(1), getLineWidth(getSeries(0)));
setLineWidth(getSeries(2), getLineWidth(getSeries(0)));
setViewableSeries(3);
setDataScrollerPresenceSeries(0);
setViewableGroups(3);
setDataScrollerPresenceGroups(0);
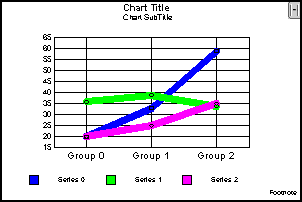
See setLineWidth().
x
This method returns a boolean that indicates whether
a numeric axis uses a logarithmic (true) or linear (false) scale.
Syntax:
boolean getLogScale(IdentObj id);
where:
- id
Is an object ID returned by a getObject() method (for example, getY1Axis()).
Example:
setDataRange(0,0,2,2);
setDepthAngle(0);
setDepthRadius(0);
setGraphType(21);
setViewableGroups(3);
setViewableSeries(3);
setDataScrollerPresenceSeries(0);
setDataScrollerPresenceGroups(0);
setLogScale(getY1Axis(),true);
setLogScale(getY2Axis(),getLogScale(getY1Axis()));
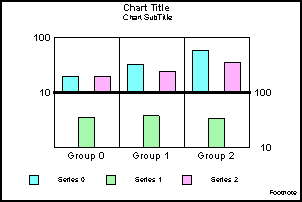
Note: You may also use one of the axis-specific properties
to determine whether logarithmic or linear scale is used on a particular
axis (for example, X1LogScale, Y1LogScale, Y2LogScale, and so on).
See setLogScale(), X1LogScale, Y1LogScale, Y2LogScale.
x
When logarithmic scaling is used on a numeric axis in
a graph, this property returns a value that identifies the lowest/base
value drawn on the axis.
Syntax:
double getLogScaleBase(IdentObj id)
where:
- id
Is an object ID returned by a getObject() method (for example, getY1Axis()).
Example:
setGraphType(21);
setDepthAngle(0);
setDepthRadius(0);
setY1LogScale(true);
setY2LogScale(true);
setLogScaleBase(getY1Axis(), 15);
setLogScaleBase(getY2Axis(), getLogScaleBase(getY1Axis()));
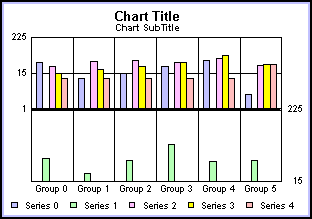
See getLogScale(), setLogScaleBase().
x
This method returns an integer value that identifies
the shape of a marker for a specified object.
Syntax:
int getMarkerShape();
int getMarkerShape(IdentObj id);
where:
- id
Is an object ID returned by a getObject() method (for example, getSeries()).
Returned values can be 0...32. Zero is
for no shape. Marker shapes 1...18 identify one of the following
marker shapes:
1 | 2 | 3 | 4 | 5 | 6 | 7 | 8 | 9 |

| 
| 
| 
| 
| 
| 
| 
| 
|
10 | 11 | 12 | 13 | 14 | 15 | 16 | 17 | 18 |

| 
| 
| 
| 
| 
| 
| 
| 
|
Example:
setDepthRadius(0);
setDepthAngle(0);
setGraphType(61);
setMarkerSizeDefault(60);
setMarkerShape(getSeries(0),getMarkerShape(getSeries(3)));
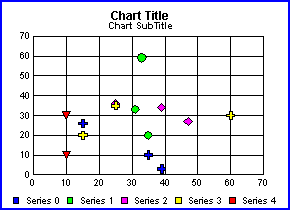
Note: If an object ID (id) is not specified, this method
returns the marker shape (if any) for the first item in the selection
list.
See getMarkerSize(), setMarkerSize(), getMarkerTemplate(), MarkerDisplay, MarkerSizeDefault.
x
This method returns an integer value that identifies
the size of a marker (0...100).
Syntax:
int getMarkerSize(IdentObj id);
int getMarkerSize(int seriesID);
int getMarkerSize(int seriesID, int groupID);
where:
- id
Is an object ID returned by a getObject() method (for example, getSeries()).
- seriesID
Is a series number.
- groupID
Is a group number.
Example:
setGraphType(61);
setMarkerSize(getSeries(0),90);
setMarkerSize(getSeries(1), getMarkerSize(getSeries(0)));
setMarkerSize(getSeries(2), getMarkerSize(getSeries(0)));
setMarkerSize(getSeries(3), getMarkerSize(getSeries(0)));
setMarkerShape(getSeries(0),4);
setMarkerShape(getSeries(1), getMarkerShape(getSeries(0)));
setMarkerShape(getSeries(2), getMarkerShape(getSeries(0)));
setMarkerShape(getSeries(3), getMarkerShape(getSeries(0)));

See setMarkerSize(), getMarkerShape(), setMarkerShape(), MarkerDisplay, MarkerSizeDefault.
x
This method returns the marker template (0...32) that
may be assigned to an object. The marker template can be assigned
to an object or all objects in a graph by the setMarkerShape() method.
Syntax:
MarkerTemplate getMarkerTemplate(IdentObj id);
where:
- id
Is an object ID returned by a getObject() method (for example, getSeries()).
See getMarkerShape(), setMarkerShape(), MarkerDisplay, MarkerSizeDefault.
x
The following method can be used to get the maximum
number of annotations.
Syntax:
int getMaxNumAnnotations();
For annotations in excess of the default (30), the setTransparentFillColor()
and setTransparentBorderColor() methods should be used to set transparent
fill and border colors for the associated annotation box as desired:
- setTransparentFillColor(getAnnotationBox(nnn),
true | false);
- setTransparentBorderColor(getAnnotationBox(nnn),
true | false);
x
This function returns the time in milliseconds since
January 1, 1970, 0:00:00 GMT for the date/time specified by the
input parameters.
Syntax:
long getMillisFromDate(
     int year,
     int month,
     int day,
     int hour,
     int minute,
     int second)
where:
- year
Is a year number (for example, 2004).
- month
Is a month number 1...12 (1=January, 12=December).
- day
Is a day in month (that is, 1...31).
- hour
Is an hour in day (1...24).
- minute
Is a minute in hour (1...60).
- second
Is a second in minute (1...60).
x
This method returns the minimum dimensions (height and
width) of a graph.
Syntax:
java.awt.Dimension getMinimumSize();
x
This method returns the minimum number of groups in
a specified graph type.
Syntax:
int getMinNumGroups(int nIntegerGraphType)
int getMinNumGroups()
where:
- nIntegerGraphType
Is a graph type number (0...106).
Example:
setDepthAngle(0);
setDepthRadius(0);
setViewableGroups(getMinNumGroups(17));
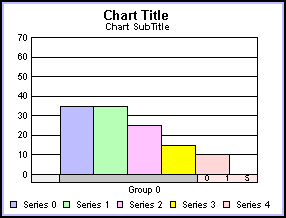
Note: If a graph type is not specified with nIntegerGraphType,
this method returns the minimum number of groups required for the
current graph type.
See getMinNumSeries().
x
This method returns the minimum number of series in
a specified graph type.
Syntax:
int getMinNumSeries()
int getMinNumSeries(int nIntegerGraphType)
where:
- nIntegerGraphType
Is a graph type number (0...106).
Example:
setDepthAngle(0);
setDepthRadius(0);
setViewableSeries(getMinNumSeries(17));
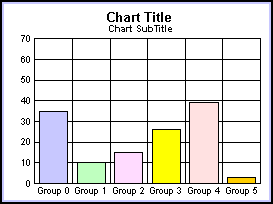
Note: If a graph type is not specified with nIntegerGraphType,
this method returns the minimum number of series required for the
current graph type.
See getMinNumGroups().
x
This method indicates whether or not a non-zero baseline
has been set by setNonZeroBaseline() on a numeric axis. Returned
values can be true (a non-zero baseline is set) or false (a zero
baseline is set).
Syntax:
boolean getNonZeroBaseline(IdentObj id)
where:
- id
Is an object ID returned by a getObject() method (for example, getY1Axis()).
Example:
setGraphType(21);
setDepthAngle(0);
setDepthRadius(0);
setNonZeroBaseline(getY1Axis(),true);
setNonZeroBaselineValue(getY1Axis(),10);
setNonZeroBaseline(getY2Axis(), getNonZeroBaseline(getY1Axis()));
setNonZeroBaselineValue(getY2Axis(),
getNonZeroBaselineValue(getY1Axis()));
setFillColor(getNonZeroBaseLineZeroLine(), new Color (255,0,0));
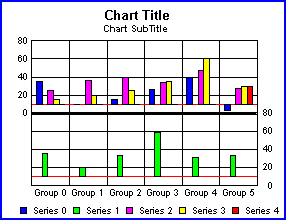
See getNonzeroBaselineValue(), setNonZeroBaseline(), setNonZeroBaselineValue().
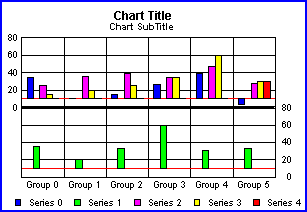
xgetNonzeroBaselineValue()
This method returns the non-zero baseline value set
by setNonZeroBaselineValue() for a numeric axis.
Syntax:
double getNonZeroBaselineValue(IdentObj id)
where:
- id
Is an object ID returned by a getObject() method (for example, getY1Axis()).
Example:
setGraphType(21);
setDepthAngle(0);
setDepthRadius(0);
setNonZeroBaseline(getY1Axis(),true);
setNonZeroBaselineValue(getY1Axis(),10);
setNonZeroBaseline(getY2Axis(), getNonZeroBaseline(getY1Axis()));
setNonZeroBaselineValue(getY2Axis(),   getNonZeroBaselineValue(getY1Axis()));
setFillColor(getNonZeroBaseLineZeroLine(), new Color (255,0,0));
See getNonZeroBaseline(), setNonZeroBaseline(), setNonZeroBaselineValue().
x
This method returns an integer value that identifies
the number of series in the graph that have not been ignored by
setIgnoreSeries().
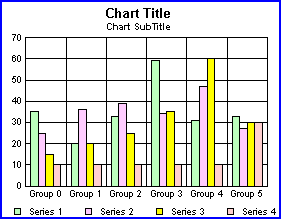
Syntax:
int getNumNonIgnoredSeries();
Example:
setDepthAngle(0);
setDepthRadius(0);
setIgnoreSeries(getSeries(0), true);
setIgnoreSeries(getNumNonIgnoredSeries(), true);
See setIgnoreSeries().
x
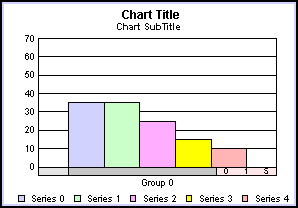
This method returns the number of groups required per
data column for a particular graph type.
Syntax:
int getNumColumnsInGroup(int nIntegerGraphType)
int getNumColumnsInGroup()
where:
- nIntegerGraphType
Is a graph type number.
Example:
setDepthAngle(0);
setDepthRadius(0);
setViewableGroups(getNumColumnsInGroup(17));
Note: If a graph type is not specified with nIntegerGraphType,
this method returns the number of groups required per data column
for the current graph type.
See getMinNumGroups(), getMinNumSeries().
x
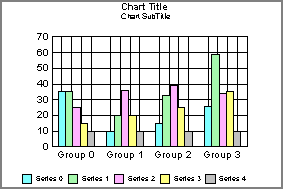
This method returns an integer value that identifies
the number of viewable groups in a graph. The number of viewable
groups is the number of groups that are visible in a graph after
data scrolling and/or zooming. Use getNumTotalGroups() to determine
the total number of groups in a graph's data set.
Syntax:
int getNumGroups();
Example:
setViewableGroups(4);
setDataScrollerPresenceGroups(0);
setO1MinorGridCount(getNumGroups());
setO1MinorGridDisplay(true);
setO1MajorGridDisplay(false);
setDepthRadius(0);
setDepthAngle(0);
See getNumTotalGroups(), getNumSeries(), getNumTotalSeries().
x
This method returns an integer value that identifies
the number of viewable series in a graph. The number of viewable
series is the number of series that are visible in a graph after
any data scrolling and/or zooming. Use getNumTotalSeries() to determine
the total number of series in a graph's data set.
Syntax:
int getNumSeries();
Example:
setViewableSeries(3);
setDataScrollerPresenceSeries(0);
setViewableGroups(4);
setDataScrollerPresenceGroups(0);
setO1MinorGridCount(getNumSeries());
setO1MinorGridDisplay(true);
setO1MajorGridDisplay(false);
setDepthRadius(0);
setDepthAngle(0);
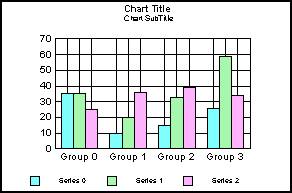
See getNumGroups(), getNumTotalGroups(), getNumTotalSeries().
x
This method returns an integer value that identifies
the total number of groups in a graph's entire data range. It does
not consider any data scrolling or zooming operations that may have
been applied to a graph. Use getNumGroups() if you want to get the
number of viewable groups in a graph (after any data scrolling or zooming).
Syntax:
int getNumTotalGroups();
Example:
setViewableGroups(4);
setDataScrollerPresenceGroups(0);
setO1MinorGridCount(getNumTotalGroups());
setO1MinorGridDisplay(true);
setO1MajorGridDisplay(false);
setDepthRadius(0);
setDepthAngle(0);
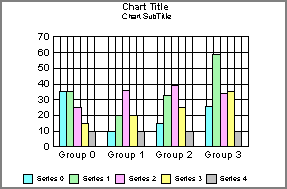
See getNumGroups(), getNumSeries(), getNumTotalSeries().
x
This method returns an integer value that identifies
the total number of series in a graph's entire data range. It does
not consider any data scrolling or zooming operations that may have
been applied to a graph. Use getNumSeries() if you want to get the
number of viewable series in a graph (after any data scrolling or zooming).
Syntax:
int getNumTotalSeries();
See getNumSeries(), getNumGroups(), getNumTotalGroups().
xgetO1MajorGridColorBand1()
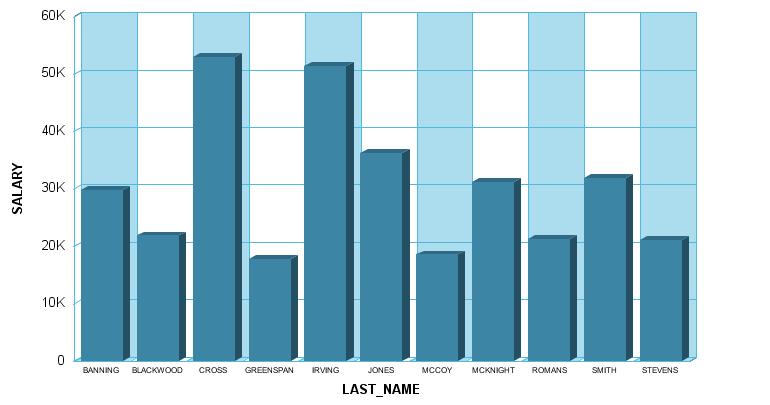
This method returns the object ID of the X-axis Color
Band 1, which allows color banded styling to be applied to the X-axis
grid in a graph.
Syntax:
IdentObj getO1MajorGridColorBand1()
Example:
setDisplay(getO1MajorGridColorBand1(),true);
setFillColor(getO1MajorGridColorBand1(), new Color (171,221,239));
xgetO1MajorGridColorBand2()
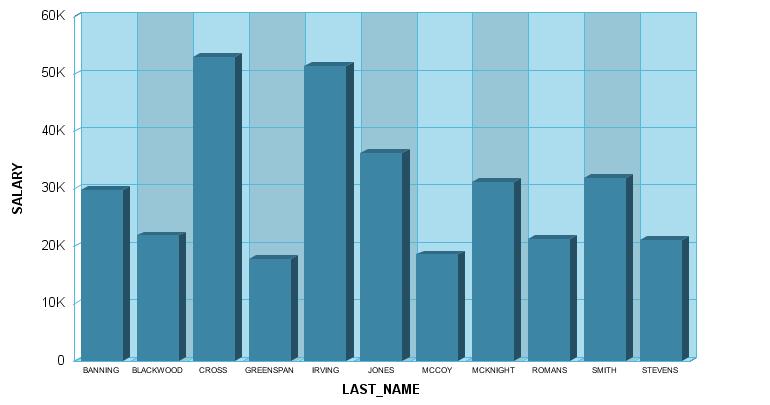
This method returns the object ID of the X-axis Color
Band 2, which allows color banded styling to be applied to the X-axis
grid in a graph.
Syntax:
IdentObj getO1MajorGridColorBand2()
Example:
setDisplay(getO1MajorGridColorBand1(),true);
setFillColor(getO1MajorGridColorBand1(), new Color (171,221,239));
setDisplay(getO1MajorGridColorBand2(),true);
setFillColor(getO1MajorGridColorBand2(), new Color (153,198,214));
x
This method returns a boolean that identifies whether
or not a pie slice has been deleted from a pie graph.
Syntax:
boolean getPieSliceDelete(IdentObj id);
boolean getPieSliceDelete(int seriesID);
boolean getPieSliceDelete(int seriesID,int groupID);
where:
- id
Is an object ID returned by a getObject() method (for example, getSeries()).
- seriesID
Is a series number.
- groupID
Is a group number.
Returned values can be true (the slice has been deleted) or false
(the slice has not been deleted).
Example:
setGraphType(55);
setPieSliceDelete(4,0,true);
setPieSliceDelete(2,0,getPieSliceDelete(4,0));
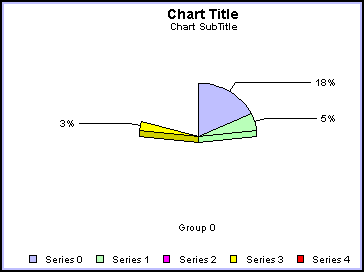
See getPieSliceDelete(), getPieSliceDetach(), setPieSliceDetach().
x
This method returns an integer value that identifies
the distance (0...100) a slice is detached from a pie graph.
Syntax:
int getPieSliceDetach(IdentObj id);
int getPieSliceDetach(int seriesID);
int getPieSliceDetach(int seriesID, int groupID);
where:
- id
Is an object ID returned by a getObject() method (for example, getSeries()).
- seriesID
Is a series number.
- groupID
Is a group number.
See getPieSliceDelete(), setPieSliceDelete().
x
This method returns the horizontal alignment set by
setPlaceAlign() for a specified object.
Syntax:
int getPlaceAlign(IdentObj id)
where:
- id
Is an object ID of a text object returned by a getObject()
method (for example, getO1Label()).
Returned values can be 0 (do not allow horizontal alignment of
the specified graph object) or 1 (allow horizontal alignment of
the specified graph object).
Note:
- All getPlace...()
and setPlace...() methods are only valid when the automatic graph
layout manager has been enabled with setPlace(true).
- The value assigned
to the specified object will only be used if the automatic graph layout
manager determines that realignment is needed to produce a better
graph layout.
See setPlaceAlign(), Place.
x
This function returns a rectangle that defines the margin
around a graph applied by setPlaceMargin(). The default margin is
new Rectangle (-15500, -15500, 24000, 31000).
Syntax:
Rectangle getPlaceMargin()
Note: All getPlace...() and setPlace...() methods are
only valid when the automatic graph layout manager has been enabled
with setPlace(true).
See Place, setPlaceMargin().
xgetPlaceMaxNumWordWrapLines()
This method returns the maximum number of word wrap
lines set by setPlaceMaxNumWordWrapLines() for a specified text
object.
Syntax:
int getPlaceMaxNumWordWrapLines(IdentObj id)
where:
- id
Is an object ID of a text object returned by a getObject()
method (for example, get O1Label()).
This method returns the maximum number of word wrap lines (0...10).
The default value is 3.
Note:
- All getPlace...()
and setPlace...() methods are only valid when the automatic graph
layout manager has been enabled with setPlace(true).
- The value assigned
to the specified object will only be used if the automatic graph layout
manager determines that word wrapping is needed to produce a better
graph layout.
See setPlaceMaxNumWordWrapLines(), Place.
x
This method returns the minimum font point size set
by setPlaceMinFontSize() for a specified text object.
Syntax:
int getPlaceMinFontSize(IdentObj id)
where:
- id
Is an object ID of a text object returned by a getObject()
method (for example, getO1Label()).
The minimum font size can be a value from 4...96. The default
value is 4.
Note:
- All getPlace...()
and setPlace...() methods are only valid when the automatic graph
layout manager has been enabled with setPlace(true).
- The value assigned
to the specified object will only be used if the automatic graph layout
manager determines that font resizing is needed to produce a better
graph layout.
See setPlaceMinFontSize(), Place.
x
This method returns the value set by setPlacePosition()
for a specified object. In the current implementation, only the
legend object can be repositioned.
Syntax:
int getPlacePosition(IdentObj id)
where:
- id
Is the object ID returned by a getObject() method.
In the current implementation, only the legend object can be repositioned
(for example, getLegendArea()).
Returned values can be:
- 0 (automatic
- not currently implemented)
- 1 (bottom)
- 2 (right - not
currently implemented)
- 3 (free-floating
- not currently implemented)
- 4 (right-center)
Note:
- All getPlace...()
and setPlace...() methods are only valid when the automatic graph
layout manager has been enabled with setPlace(true).
- The value assigned
to the specified object will only be used if the automatic graph layout
manager determines that repositioning is needed to produce a better
graph layout.
See setPlacePosition(), Place.
x
This method returns the rectangle set by setPlaceRect()
for a specified object. In the current implementation, only object
IDs return by getPlaceVertO1LabelsTitle() or getPlaceHorzO1LabelsTitle()
can be used.
Syntax:
Rectangle getPlaceRect(IdentObj id)
where:
- id
Is an object ID returned by getPlaceVertO1LabelsTitle() or getPlaceHorzO1LabelsTitle().
Note: All getPlace...() and setPlace...() methods are
only valid when the automatic graph layout manager has been enabled
with setPlace(true).
See setPlaceRect(), Place.
x
This method returns the resizing value set by setPlaceResize()
for a specified object.
Syntax:
int getPlaceResize(IdentObj id)
where:
- id
Is the object ID of a graph object returned by a getObject()
method (for example, getO1Label()).
Returned values can be 0 (do not allow resizing of graph objects)
or 1 (allow resizing of graph objects).
Note:
- All getPlace...()
and setPlace...() methods are only valid when the automatic graph
layout manager has been enabled with setPlace(true).
- The value assigned
to the specified object will only be used if the automatic graph layout
manager determines that resizing is needed to produce a better graph layout.
See setPlaceResize(), Place.
x
This method returns the value set by setPlaceRotate()
for a specified text object.
Syntax:
int getPlaceRotate(IdentObj id)
where:
- id
Is the object ID of a text object returned by a getObject()
method (for example, getO1Label()).
Returned values can be 0 (do not allow rotation of objects) or
1 (allow rotation of objects).
Note:
- All getPlace...()
and setPlace...() methods are only valid when the automatic graph
layout manager has been enabled with setPlace(true).
- The value assigned
to the specified object will only be used if the automatic graph layout
manager determines that rotation is needed to produce a better graph layout.
See setPlaceRotate(), Place.
x
This method returns the label skip value set by setPlaceSkip()
for labels on the primary ordinal axis.
Syntax:
int getPlaceSkip(IdentObj id)
where:
- id
Is the object ID of primary ordinal axis labels (for example, getO1Label();).
Returned values can be 0 (do not allow label skipping) or 1 (allow
label skipping).
Note:
- All getPlace...()
and setPlace...() methods are only valid when the automatic graph
layout manager has been enabled with setPlace(true).
- The value assigned
to the specified object will only be used if the automatic graph layout
manager determines that label skipping is needed to produce a better
graph layout.
See setPlaceSkip(), Place.
x
This method returns the truncate count (0...1096) set
by setPlaceTruncateCount() for a specified text object. The default
value is 0.
Syntax:
int getPlaceTruncateCount(IdentObj id)
where:
- id
Is an object ID of a text object returned by a getObject()
method (for example, getO1Label()).
Note:
- All getPlace...()
and setPlace...() methods are only valid when the automatic graph
layout manager has been enabled with setPlace(true).
- The value assigned
to the specified object will only be used if the automatic graph layout
manager determines that truncation is needed to produce a better
graph layout.
See setPlaceTruncateCount(), Place.
x
This method returns the value set by setPlaceWordWrap()
for a specified text object.
Syntax:
int getPlaceWordWrap(IdentObj id)
where:
- id
Is an object ID of a text object returned by a getObject()
method (for example, getO1Label()).
Returned values can be 0 (do not allow word wrapping) or 1 (allow
word wrapping). The default value is 1.
Note:
- All getPlace...()
and setPlace...() methods are only valid when the automatic graph
layout manager has been enabled with setPlace(true).
- The value assigned
to the specified object will only be used if the automatic graph layout
manager determines that word wrapping is needed to produce a better
graph layout.
See setPlaceWordWrap(), Place.
x
This method returns the scale value where the vertical
quadrant line identified by nIndex is located. If the returned value
is NO_LINEVALUE, then automatic scaling is enabled.
Syntax:
double getQuadrantLineValueX(int nIndex)
where:
- nIndex
Is a quadrant line number (zero to number of quadrant lines drawn).
Example:
setGraphType(89);
setGridStep(getX1MajorGrid(),10.0);
setGridStep(getY1MajorGrid(),10.0);
setQuadrantLineValueY(0, getQuadrantLineValueX(0));
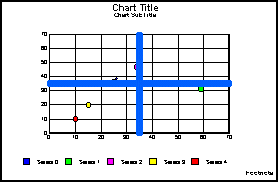
x
This method returns the scale value where the horizontal
quadrant line identified by nIndex is located. If the returned value
is NO_LINEVALUE, then automatic scaling is enabled.
Syntax:
double getQuadrantLineValueY(int nIndex)
where:
- nIndex
Is a quadrant line number (zero to number of quadrant lines drawn).
Example:
setGraphType(89);
setGridStep(getX1MajorGrid(),10.0);
setGridStep(getY1MajorGrid(),10.0);
setQuadrantLineValueX(0, getQuadrantLineValueY(0));
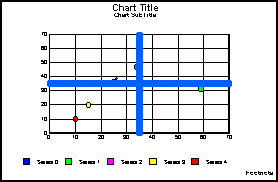
x
This method returns the bounding rectangle for a user-movable
object in virtual coordinates (x, y, width, height). See Virtual Coordinate System for
a description of virtual coordinates and a list of user-movable
objects.
Syntax:
Rectangle getRect(IdentObj id);
where:
- id
Is an object ID returned by a getObject() method (for example, getFrame()).
Example:
setDepthAngle(0);
setDepthRadius(0);
setViewableGroups(3);
setViewableSeries(3);
setDataScrollerPresenceGroups(0);
setDataScrollerPresenceSeries(0);
setLegendOrient(1);
setLegendRect(getRect(getFrame()));
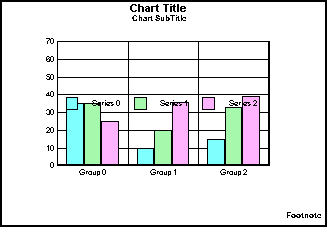
See setRect(), getFrameRect(), getLegendRect(), setLegendRect().
x
This method returns the number of reference lines (0...2)
that have been defined in a graph.
Syntax:
int getReferenceLineCount()
Example:
setDepthRadius(0);
setGraphType(21);
setReferenceLine(getY1Axis(),0,50);
setLineWidth(getReferenceLine(getY1Axis(),0),3);
setFillColor(getReferenceLine(getY1Axis(),0), new Color(255,0,0));
setReferenceLine(getY2Axis(), 1,
      getReferenceLineValue(getY1Axis(), 0));
setLineWidth(getReferenceLine(getY2Axis(),1),
      getReferenceLineCount());
setFillColor(getReferenceLine(getY2Axis(),1), new Color(255,0,0));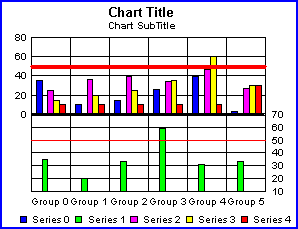
See getReferenceLineValue(), setReferenceLine().
x
This method returns the location/value at which a specified
reference line (nIndex) is drawn on a specified axis (axisObj).
Syntax:
double getReferenceLineValue(IdentObj axisObj, int nIndex);
where:
- axisObj
Is an object ID returned by a getObject() method (for example, getY1Axis().
- nIndex
Is a reference line index number (0...2).
Example:
setGraphType(21);
setDepthRadius(0);
setReferenceLine(getY1Axis(),0,50);
setLineWidth(getReferenceLine(getY1Axis(),0),3);
setFillColor(getReferenceLine(getY1Axis(),0),
      new Color(255,0,0));
setReferenceLine(getY2Axis(), 1,
      getReferenceLineValue(getY1Axis(), 0));
setLineWidth(getReferenceLine(getY2Axis(),1),3);
setFillColor(getReferenceLine(getY2Axis(),1),
      new Color(255,0,0));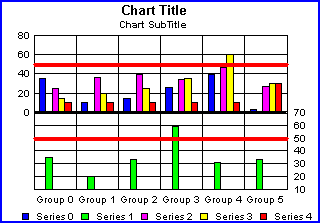
See getReferenceLineCount(), setReferenceLine().
x
This method returns the object ID of a XY reference
line. The XY reference line is defined by the setX1(), setY1(),
setX2(), and setY2() methods.
Syntax:
IdentObj getReferenceLineXY(IdentObj XYObj, int nIndex);
where:
- XYObj
Is the XY object ID.
- nIndex
Is the integer reference line index number.
Example:
setBorderColor(getReferenceLineXY(0),new Color(255,0,0));
setDisplay(getReferenceLineXY(0),true);
setFillColor(getReferenceLineXY(0),new Color(255,0,0));
setLineWidth(getReferenceLineXY(0),3);  setX1(getReferenceLineXY(0), 0.5);
setY1(getReferenceLineXY(0), 0); setX2(getReferenceLineXY(0), 0.7); setY2(getReferenceLineXY(0), 0.3);setReferencePercentageMode(getReferenceLineXY(0),true);
setDisplay(getReferenceLineXYText(0), true);
setReferenceTextPosition(getReferenceLineXYText(0), 0);
setTextString(getReferenceLineXYText(0), "Just a Line");
See setBorderColor(), setDisplay(), setFillColor(), setLineWidth(), setTextString(), ReferenceTextPosition, ReferencePercentageMode, setX1(), setY1(), setX2(), setY2().
x
This method returns the object ID of a custom marker.
The XY reference marker is defined by the setX1() and setY1() methods.
Syntax:
IdentObj getReferenceMarker(IdentObj XYObj, int nIndex);
where:
- XYObj
Is the marker object ID.
- nIndex
Is the integer reference marker index number.
Example:
setBorderColor(getReferenceMarker(0),new Color(255,0,0));
setDisplay(getReferenceMarker(0),true);
setFillColor(getReferenceMarker(0),new Color(255,0,0));
setReferenceMarkerShape(getReferenceMarker(0),5);
setReferenceMarkerSize(getReferenceMarker(0), 15);  setX1(getReferenceMarker(0),.3); setY1(getReferenceMarker(0),.8);setReferencePercentageMode(getReferenceMarker(0), true);
setDisplay(getReferenceMarkerText(0), true);
setReferenceTextPosition(getReferenceMarkerText(0), 0);
setTextString(getReferenceMarkerText(0), "Interesting!");
See setBorderColor(), setDisplay(), setFillColor(), setTextString(), ReferenceTextPosition, ReferencePercentageMode, setX1(), setY1().
x
This method returns the object ID of a custom rectangle.
The reference rectangle is defined by the setX1(), setY1(), setX2(),
and setY2() methods.
Syntax:
IdentObj getReferenceRect(IdentObj XYObj, int nIndex);
where:
- XYObj
Is the rectangle object ID.
- nIndex
Is the integer reference rectangle index number.
Example:
setBorderColor(getReferenceRect(0),new Color(255,111,111));
setDisplay(getReferenceRect(0),true);
setFillColor(getReferenceRect(0),new Color(255,111,111));  setX1(getReferenceRect(0),
0.0); setY1(getReferenceRect(0), 0.0); setX2(getReferenceRect(0),
0.5); setY2(getReferenceRect(0), 0.5);setReferencePercentageMode(getReferenceRect(0),true);
setBorderColor(getReferenceRect(1),new Color(255,255,111));
setDisplay(getReferenceRect(1),true);
setFillColor(getReferenceRect(1),new Color(255,255,111));  setX1(getReferenceRect(1),
0.0); setY1(getReferenceRect(1), 0.5); setX2(getReferenceRect(1),
0.5); setY2(getReferenceRect(1), 1);setReferencePercentageMode(getReferenceRect(1),true);
setBorderColor(getReferenceRect(2),new Color(255,0,0));
setDisplay(getReferenceRect(2),true);
setFillColor(getReferenceRect(2),new Color(255,0,0));  setX1(getReferenceRect(2),
0.5); setY1(getReferenceRect(2), 0); setX2(getReferenceRect(2),
1); setY2(getReferenceRect(2), 0.5);setReferencePercentageMode(getReferenceRect(2),true);
setBorderColor(getReferenceRect(3),new Color(111,255,111));
setDisplay(getReferenceRect(3),true);
setFillColor(getReferenceRect(3),new Color(111,255,111));  setX1(getReferenceRect(3),
0.5); setY1(getReferenceRect(3), 0.5); setX2(getReferenceRect(3),
1); setY2(getReferenceRect(3), 1);setReferencePercentageMode(getReferenceRect(3),true)
setDisplay(getReferenceRectText(0), true);
setReferenceTextPosition(getReferenceRectText(0), 6);
setTextString(getReferenceRectText(0), "Custom Peach  ");
setDisplay(getReferenceRectText(1), true);
setReferenceTextPosition(getReferenceRectText(1), 6);
setTextString(getReferenceRectText(1), "Custom Yellow");
setDisplay(getReferenceRectText(2), true);
setReferenceTextPosition(getReferenceRectText(2), 6);
setTextString(getReferenceRectText(2), "Custom Red");
setDisplay(getReferenceRectText(3), true);
setReferenceTextPosition(getReferenceRectText(3), 6);
setTextString(getReferenceRectText(3), "Custom Green");
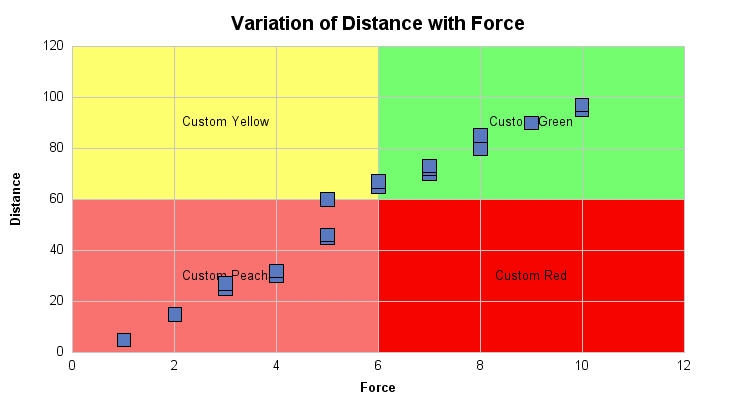
See setBorderColor(), setDisplay(), setFillColor(), setTextString(), ReferenceTextPosition, ReferencePercentageMode, setX1(), setY1(), setX2(), setY2().
x
This method returns the maximum scale value assigned
to a numeric axis.
Syntax:
double getScaleMax(IdentObj id);
where:
- id
Is an object ID returned by a getObject() method (for example, getY1Axis()).
Example:
setDepthAngle(0);
setDepthRadius(0);
setViewableGroups(2);
setViewableSeries(2);
setGraphType(21);
setDataScrollerPresenceGroups(0);
setData(0,0,getScaleMax(getY1Axis()));
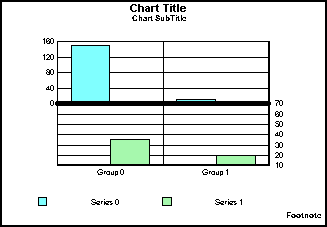
Note: You may also use one of the axis-specific properties
to get the maximum scale on a particular axis (for example, X1ScaleMax,
Y1ScaleMax, Y2ScaleMax, and so on).
See setScaleMax(), getScaleMaxAuto(), setScaleMaxAuto(), getScaleMin(), setScaleMin(), getScaleMinAuto(), setScaleMinAuto(), X1ScaleMax, X1ScaleMaxAuto, Y1ScaleMax, Y1ScaleMaxAuto, Y2ScaleMax, Y2ScaleMaxAuto.
x
This method returns a boolean that indicates whether
automatic or manual scaling is used for the maximum value on a numeric
axis. Returned values can be true (the maximum value is automatically
calculated (automatic scaling)) or false (the maximum value is not
automatically calculated (manual scaling)).
Syntax:
boolean getScaleMaxAuto(IdentObj id);
where:
- id
Is an object ID returned by a getObject() method (for example, getY1Axis()).
Note: You may also use one of the axis-specific properties
to determine automatic/manual scaling on a particular axis (for
example, X1ScaleMaxAuto, Y1ScaleMaxAuto, and so on).
See getScaleMax(), setScaleMax(), setScaleMaxAuto(), getScaleMin(), setScaleMin(), getScaleMinAuto(), setScaleMinAuto(), X1ScaleMax, X1ScaleMaxAuto, Y1ScaleMax, Y1ScaleMaxAuto, Y2ScaleMax, Y2ScaleMaxAuto.
x
This method returns the minimum scale value assigned
to a numeric axis.
Syntax:
double getScaleMin(IdentObj id);
where:
- id
Is an object ID returned by a getObject() method (for example, getY1Axis()).
Example:
setDataScrollerPresenceGroups(0);
setDepthRadius(0);
setViewableGroups(2);
setViewableSeries(2);
setGraphType(21);
setData(0,0,getScaleMax());
setData(1,1,getScaleMin(getY1Axis()));
Note: You may also use one of the axis-specific properties
to get the minimum scale on a particular axis (for example, X1ScaleMin(),
Y1ScaleMin(), Y2ScaleMin(), and so on).
See setScaleMin(), getScaleMax(), setScaleMax(), getScaleMaxAuto(), setScaleMaxAuto(), getScaleMinAuto(), setScaleMinAuto(), X1ScaleMin, X1ScaleMinAuto, Y1ScaleMin, Y1ScaleMinAuto, Y2ScaleMin, Y2ScaleMinAuto.
x
This method returns a boolean that identifies whether
manual or automatic scaling is used for the minimum value on a numeric
axis. Returned values can be true (the minimum value is automatically
calculated) or false (the minimum value is not automatically calculated).
Syntax:
boolean getScaleMinAuto(IdentObj id);
where:
- id
Is an object ID returned by a getObject() method (for example, getY1Axis()).
Note: You may also use one of the axis-specific properties
to determine automatic/manual scaling on a particular axis (for
example, X1ScaleMinAuto(), Y1ScaleMinAuto(), Y2ScaleMinAuto(), and
so on).
See setScaleMinAuto(), getScaleMax(), setScaleMax(), getScaleMaxAuto(), setScaleMaxAuto(), getScaleMin(), setScaleMin(), X1ScaleMin, X1ScaleMinAuto, Y1ScaleMin, Y1ScaleMinAuto, Y2ScaleMin, Y2ScaleMinAuto.
xgetScaleMustIncludeZero()
This method returns a boolean that identifies whether
or not a given axis must include zero. Returned values can be true
(the axis must include zero) or false (zero is not required on this
axis).
Syntax:
boolean getScaleMustIncludeZero(IdentObj id);
where:
- id
Is an object ID returned by a getObject() method (for example, getY1Axis()).
Note: You may also use one of the axis-specific properties
to determine if a particular axis must include zero (for example,
X1MustIncludeZero, Y1MustIncludeZero, Y2MustIncludeZero, and so
on).
See setScaleMustIncludeZero(), X1MustIncludeZero, Y1MustIncludeZero, Y2MustIncludeZero.
x
This method returns the border color of a particular
series in a graph.
Syntax:
Color getSeriesBorderColor (int s);
where:
- s
Is a series number.
Example:
setViewableGroups(2);
setViewableSeries(2);
setDataScrollerPresenceGroups(0);
setDataScrollerPresenceSeries(0);
setSeriesBorderColor(0,new Color(0,0,239));
setSeriesFillColor(0, getSeriesBorderColor(0));
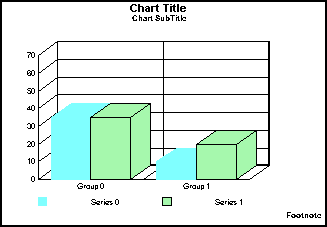
See getSeriesFillColor(), setSeriesBorderColor().
xgetSeriesDataTextDisplay()
This method returns the boolean set by setSeriesDataTextDisplay()
for a specified series. Returned values can be true (data text is
displayed for the specified series) or false (data text is not displayed
for the specified series).
Syntax:
boolean getSeriesDataTextDisplay(IdentObj idSeries)
where:
- idSeries
Is an object ID returned by a getObject() method (for example, getSeries()).
See setSeriesDataTextDisplay().
x
This method returns the fill color of a particular series
in a graph.
Syntax:
Color getSeriesFillColor (int s);
where:
- s
Is a series number.
Example:
setSeriesFillColor(0, new Color(206,0,121));
setSeriesFillColor(2, getSeriesFillColor(0));
setGraphType(93);
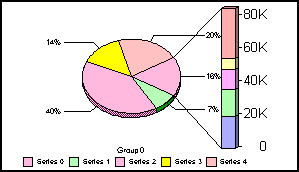
See setSeriesBorderColor(), setSeriesFillColor().
x
This method returns a label string associated with a
series in a graph.
Syntax:
string getSeriesLabel(IdentObj id);
string getSeriesLabel(int seriesID);
where:
- seriesID
Is any valid series number.
- id
Is an object ID returned by a getObject() method (for example, getSeries()).
Example:
setViewableGroups(2);
setViewableSeries(2);
setDataScrollerPresenceGroups(0);
setDataScrollerPresenceSeries(0);
setTitleString(getSeriesLabel(0));
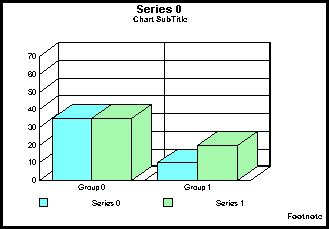
See setSeriesLabel().
x
This method returns an integer value that identifies
the series type for a specific object or a specific series.
Syntax:
int getSeriesType(IdentObj id);
int getSeriesType(int seriesID);
where:
- id
Is an object ID returned by a getObject() method (for example, getSeries()).
- seriesID
Is a series number.
The integer value for the series type can be:
- 0 (riser unspecified)
- 1 (riser bar)
- 2 (riser marker)
- 3 (riser area)
Example:
setDepthRadius(0);
setDepthAngle(0);
setSeriesType(getSeries(0),3);
setSeriesType(getSeries(4), getSeriesType(getSeries(0)));
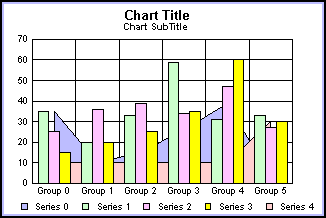
See setSeriesType().
x
This method returns the shadow fill type set by setShadowFillType()
for a specified Java2D text object.
Syntax:
int getShadowFillType(IdentObj id)
where:
- id
Is an object ID returned by a getObject() method (for example, getTitle()).
The integer value for the shadow fill type can be:
- 1 (FILL_COLOR).
This value is the default.
- 2 (FILL_GRADIENT_LEFTTORIGHT).
- 3 (FILL_TEXTURE)
See setShadowFillType().
xgetShadowGradientEndColor()
This method returns the shadow gradient end color set
by setShadowGradientEndColor() for a specified Java2D text object.
The default value is Green.
Syntax:
Color getShadowGradientEndColor(IdentObj idObj)
where:
- idObj
Is the object ID returned by a getObject() method
(for example, getTitle()).
See setShadowGradientEndColor().
xgetShadowGradientStartColor()
This method returns the shadow gradient start color
set by setShadowGradientStartColor() for a specified text object.
The default value is Blue.
Syntax:
Color getShadowGradientStartColor(IdentObj idObj)
where:
- idObj
Is an object ID returned by a getObject() method (for example, getTitle()).
See setShadowGradientStartColor().
x
This method returns the texture that has been applied
to a Java 2D text object by setShadowTextureURL().
Syntax:
Image getShadowTextureURL(String szURL)
This form of this method returns a java.awt.Image set
by setShadowTextureURL() for a specified text object.
String getShadowTextureURL(IdentObj id)
This form of this method returns the URL specification string
that identifies a texture file, set by setShadowTextureURL() for
a specified text object.
where:
- id
Is the object ID of a text object returned by a getObject() method.
See setShadowTextureURL().
x
This method returns the label skip begin value. This
value represents the first label to be skipped when manual skip
mode is enabled with setO1LabelAutoSkip(2).
Syntax:
int getSkipBegin(IdentObj id);
where:
- id
Is an object ID returned by a getObject() method (for example, getO1Label()).
See setSkipBegin(), getSkipCount(), setSkipCount(), O1LabelAutoSkip.
x
This method returns a skip interval value. This value
represents the interval of labels to be skipped when manual skip
mode is enabled with setO1LabelAutoSkip(2).
Syntax:
int getSkipCount(IdentObj id);
where:
- id
Is an object ID returned by a getObject() method (for example, getO1Label()).
See setSkipCount(), getSkipBegin(), O1LabelAutoSkip.
x
This method returns the background color value set by setTextBackgroundColor()
for a specified text object. The default value is White.
Syntax:
Color getTextBackgroundColor(IdentObj idObj)
where:
- idObj
Is an object ID returned by a getObject() method (for
example, getTitle()).
x
This method returns an integer value that identifies
the format of a numeric text object. Returned values can be -2,
-1 (the format of the number is defined by one of the ...FormatPattern()
properties or methods) or 0...21, 24...30 (the format of the number
is defined by a preset format). See Preset Number Formats.
Syntax:
int getTextFormatPreset(IdentObj id);
where:
- id
Is an object ID returned by a getObject() method (for example, getY1Label()).
Example:
setGraphType(61);
setDepthRadius(0);
setDepthAngle(0);
setTextFormatPreset(getY1Label(), 6);
setTextFormatPreset(getX1Label(), getTextFormatPreset(getY1Label()));
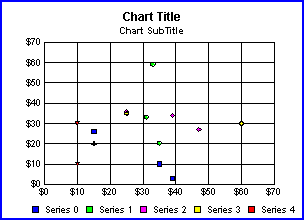
See setTextFormatPreset(), getTextFormatPattern(), setTextFormatPattern().
x
This method returns an integer value that identifies
the horizontal alignment of a text object.
Syntax:
int getTextJustHoriz(IdentObj id);
where:
- id
Is an object ID returned by a getObject() method (for example, getY1Label()).
Returned values can be:
- 0 (left)
- 1 (center)
- 2 (right)
See setTextJustHoriz(), getTextJustVert(), setTextJustVert().
x
This method returns an integer value that identifies
the vertical alignment of a text object.
Syntax:
int getTextJustVert(IdentObj id);
where:
- id
Is an object ID returned by a getObject() method (for example, getY1Label()).
Returned values can be:
- 0 (top)
- 1 (center)
- 2 (bottom)
See setTextJustVert(), getTextJustHoriz(), setTextJustHoriz().
x
This method returns the value set by setTextStrikethrough()
and identifies whether or not strike-through has been applied to
a specified text object.
Returned values can be true (strike-through has been applied
to the specified text object) or false (strike-through not applied).
The default value is false.
Syntax:
boolean getTextStrikethrough(IdentObj idObj)
where:
- idObj
Is an object ID returned by a getObject() method (for
example, getTitle()).
x
This method returns the value set by setTextUnderlineType()
and defines the underline style that has been applied to a specified
text object. The default value is 2 (UNDERLINE_LOW_TWO_PIXEL).
Syntax:
int getTextUnderlineType(IdentObj id)
where:
- id
Is an object ID returned by a getObject() method (for
example, getTitle())
Returned integer values can be one of the following:
- 1 (UNDERLINE_LOW_ONE_PIXEL)
- 2 (UNDERLINE_LOW_TWO_PIXEL)
- 3 (UNDERLINE_LOW_DOTTED)
- 4 (UNDERLINE_LOW_GRAY)
- 5 (UNDERLINE_LOW_DASHED)
See setTextUnderlineType().
x
This method can be used to determine if a texture has
been applied to an object in a graph. When a texture name (that
is, a .GIF file name) is supplied as an input parameter, this method
identifies whether or not the named texture is applied to any object in
the graph. If an object ID is specified (for example, getTexture
(getSeries(1);), this method will identify whether or not a texture
is applied to the specific object. A returned value of null means
that texture is not in the look.
Syntax:
Image getTexture(String szURL);
String getTexture(IdentObj id);
where:
- szURL
Is the name of an image to look for in the graph.
- id
Is an object ID returned by a getObject() method (for example, getSeries()).
Example:
setDepthRadius(0);
setFillType(getSeries(2),3);
setTextureDisplayMode(getSeries(2),0);
setTextureURL(getSeries(2),"/images/tdg/Azul_Granite.gif");
setViewableGroups(3);
setViewableSeries(3);
setDataScrollerPresenceGroups(0);
setTitleString(getTexture(getSeries(2)));
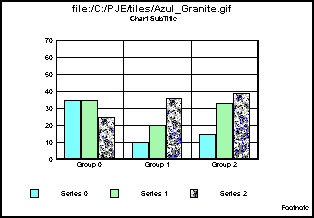
See getTextureDisplayMode(), setTextureDisplayMode(), getFillType(), setFillType(), setTextureURL(), DisplayBarAsPictograph.
x
This method returns the texture background color set
by setTextureBGColor() for a specified object.
Syntax:
Color getTextureBGColor(IdentObj id)
Color getTextureBGColor(int seriesID)
Color getTextureBGColor(int seriesID, int groupID)
where:
- IdentObj
Is an object ID returned by a getObject() method.
- seriesID
Is a series number.
- groupID
Is a group number.
See setTextureBGColor().
x
This method indicates whether or not line wrapping is
enabled for a text object. Returned values can be true (text wrapping
is enabled) or false (text wrapping is not enabled).
Syntax:
boolean getTextWrap(IdentObj id);
where:
- id
Is an object ID returned by a getObject() method (for example, getO1Label()).
See setTextWrap(), O1LabelWrap, O2LabelWrap.
x
This method returns the number of tick marks on the
specified axis set by setTickCount().
Syntax:
int getTickCount(IdentObj id)
where:
- id
Is an object ID returned by a getObject() method.
It must identify a tick mark object (for example, getY1MajorTick()).
See setTickCount().
x
This method returns the length of tick marks set by
setTickLength(), in virtual coordinates.
Syntax:
int getTickLength(IdentObj id)
where:
- id
Is an object ID returned by a getObject() method. It must
identify a tick mark object (for example, getY1MajorTick())
See setTickLength().
x
This method returns the number of tick steps set by
setTickStep() on a specified axis.
Syntax:
double getTickStep(IdentObj id)
where:
- id
Is an object ID returned by a getObject() method. It must
identify a tick mark object (for example, getY1MajorTick()).
See setTickStep().
x
This method returns the boolean set by setTickStepAuto()
for a specified axis. It indicates whether or not automatic calculation
of tick steps is enabled.
Syntax:
boolean getTickStepAuto(IdentObj id)
where:
- id
Is an object ID returned by a getObject() method.
It must identify a tick mark object (for example, getY1MajorTick()).
See setTickStepAuto().
x
This method returns the tick mark style set by setTickStyle().
Syntax:
int getTickStyle(IdentObj id)
where:
- id
Is an object ID returned by a getObject() method.
It must identify a tick mark object (for example, getY1MajorTick()).
Returned values can be:
0 for small tick marks from frame edge outward
1 for small tick marks from frame edge outward
2 for small tick marks from frame edge inward
3 for small tick marks from frame edge outward
4 Small tick marks span across the frame edge
See setTickStyle().
x
This method returns the width of tick marks set by setTickWidth()
in device coordinates.
Syntax:
int getTickWidth(IdentObj id)
where:
- id
Is an object ID returned by a getObject() method.
It must identify a tick mark object (for example, getY1MajorTick())
See setTickWidth().
xgetTransparentBorderColor()
This method indicates whether or not a transparent border
color is applied to an object. Returned values can be true (transparent
border color is applied) or false (transparent border color is not
applied).
Syntax:
boolean getTransparentBorderColor(IdentObj id);
where:
- id
Is an object ID returned by a getObject() method (for example, getSeries()).
See setTransparentBorderColor(), getBorderColor(), setBorderColor(), setSeriesBorderColor().
xgetTransparentFillColor()
This method indicates whether or not a transparent fill
color is applied to an object. Returned values can be true (transparent
fill color is applied) or false (transparent fill color is not applied).
Syntax:
boolean getTransparentFillColor(IdentObj id);
where:
- id
Is an object ID returned by a getObject() method (for example, getSeries()).
See setTransparentFillColor(), getFillColor(), setFillColor(), setSeriesFillColor().
xgetUseTextBackgroundColor()
This method returns the value set by setUseTextBackgroundColor()
for a specified text object. If this method returns true, background
color can be applied to the specified text object with setTextBackgroundColor().
If this method returns false, background color is disabled for the
specified text object. The default value is false.
Syntax:
boolean getUseTextBackgroundColor(IdentObj idObj)
where:
- idObj
Is an object ID returned by a getObject() method (for
example, getTitle()).
x
This method returns the mode (normal, subtotal, total,
or extra) assigned to a group in a waterfall graph.
Syntax:
int getWaterfallGroupMode(int nGroup)
where:
- nGroup
Is a group number.
Returned values can be one of the following waterfall group mode
numbers:
- 0 (normal)
- 1 (subtotal)
- 2 (total)
- 3 (extra)
See setWaterfallGroupMode().
xgetX1MajorGridStepAutoValue()
When the X1MajorGridStepAuto property is true (enabling
automatic calculation of major grid steps on the X1 axis), this
method returns a Java double-precision number that identifies the
interval between major grid steps on the X1 axis.
Syntax:
double getX1MajorGridStepAutoValue()
Example:
setGraphType(61);
setDepthRadius(0);
setX1MajorGridStepAuto(false);
setX1MajorGripStepAutoValue(10);
setX1MajorGridStep(getX1MajorGridStepAutoValue());
setMarkerSizeDefault(100);
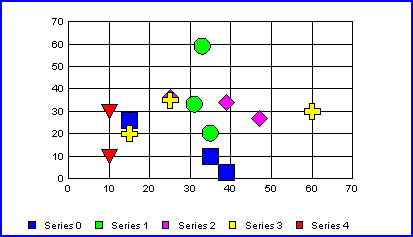
See X1MajorGridStepAuto.
x
When the X1ScaleMaxAuto property is true (enabling automatic
calculation of the maximum scaling value on the X1 axis), this method
returns a Java double-precision number that identifies the maximum
scale value that will be used on the X1 axis.
Syntax:
double getX1ScaleMaxAutoValue()
Example:
setDepthRadius(0);
setGraphType(61);
setMarkerSizeDefault(100);
setDataValue(getSeriesGroup(0,0),  getX1ScaleMaxAutoValue());
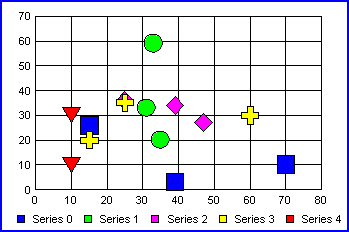
See getX1ScaleMinAutoValue(), X1ScaleMaxAuto.
x
When the X1ScaleMinAuto property is true (enabling automatic
calculation of the minimum scaling value on the X1 axis), this method
returns a Java double-precision number that identifies the minimum
scale value that will be used on the X1 axis.
Syntax:
double getX1ScaleMinAutoValue()
Example:
setDepthRadius(0);
setGraphType(61);
setMarkerSizeDefault(100);
setDataValue(getSeriesGroup(0,0),  getX1ScaleMinAutoValue());
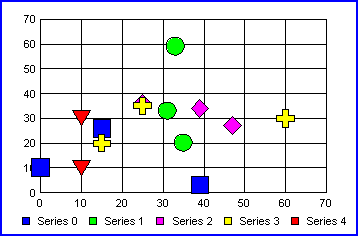
See getX1ScaleMaxAutoValue(), X1ScaleMinAuto.
xgetY1MajorGridColorBand1()
This method returns the object ID of the Y1-axis Color
Band 1, which allows color banded styling to be applied to the Y1-axis
grid in a graph.
Syntax:
IdentObj getY1MajorGridColorBand1()
Example:
setDisplay(getY1MajorGridColorBand1(),true);
setFillColor(getY1MajorGridColorBand1(), new Color (171,221,239));
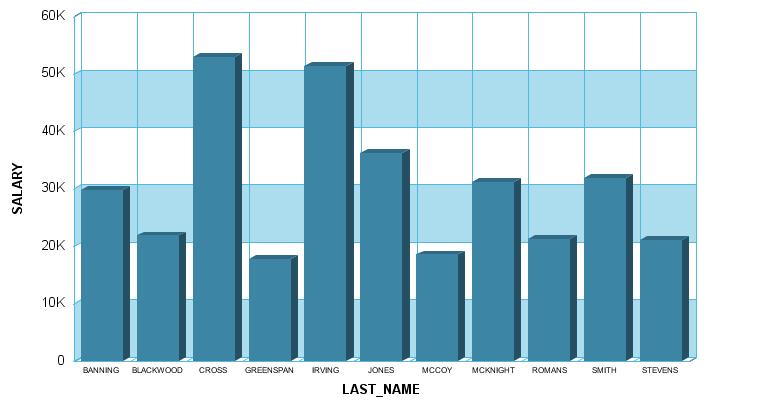
xgetY1MajorGridColorBand2()
This method returns the object ID of the Y1-axis Color
Band 2, which allows color banded styling to be applied to the Y1-axis
grid in a graph.
Syntax:
IdentObj getY1MajorGridColorBand2()
Example:
setDisplay(getY1MajorGridColorBand1(),true);
setFillColor(getY1MajorGridColorBand1(), new Color (171,221,239));
setDisplay(getY1MajorGridColorBand2(),true);
setFillColor(getY1MajorGridColorBand2(), new Color (153,198,214));
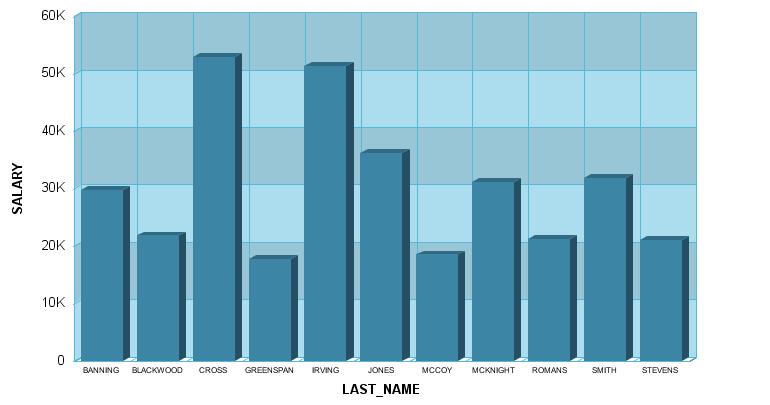
xgetY1MajorGridStepAutoValue()
When the Y1MajorGridStepAuto property is true (enabling
automatic calculation of major grid steps on the Y1 axis), this
method returns a Java double-precision number that identifies the
interval between major grid steps on the Y1 axis.
Syntax:
double getY1MajorGridStepAutoValue()
Example:
setDepthRadius(0);
setViewableGroups(2);
setDataScrollerPresenceGroups(0);
setGraphType(21);
setDataValue(getSeriesGroup(1,0), getY1MajorGridStepAutoValue());
setDataTextDisplay(true);
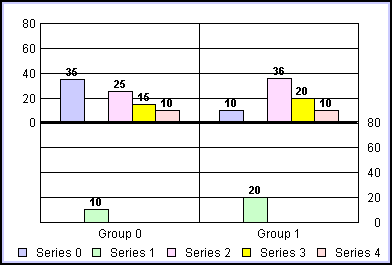
See Y1MajorGridStepAuto.
x
When the Y1ScaleMaxAuto property is true (enabling automatic
calculation of the maximum scaling value on the Y1 axis), this method
returns a Java double-precision number that identifies the maximum
scale value that will be used on the Y1 axis.
Syntax:
double getY1ScaleMaxAutoValue()
Example:
setDepthRadius(0);
setViewableGroups(2);
setDataScrollerPresenceGroups(0);
setGraphType(21);
setDataValue(getSeriesGroup(1,0), getY1ScaleMaxAutoValue());
setDataTextDisplay(true);
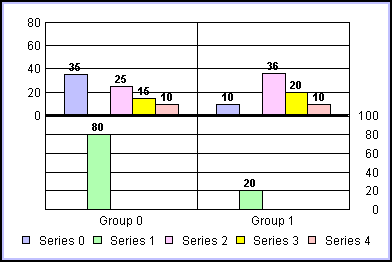
See getY1ScaleMinAutoValue(), Y1ScaleMaxAuto.
x
When the Y1ScaleMinAuto property is true (enabling automatic
calculation of the minimum scaling value on the Y1 axis), this method
returns a Java double-precision number that identifies the minimum
scale value that will be used on the Y1 axis.
Syntax:
double getY1ScaleMinAutoValue()
Example:
setDepthRadius(0);
setViewableGroups(2);
setDataScrollerPresenceGroups(0);
setGraphType(21);
setDataValue(getSeriesGroup(1,0), getY1ScaleMinAutoValue());
setDataTextDisplay(true);
setNonZeroBaseline(getY2Axis(),true);
setNonZeroBaselineValue(getY2Axis(),10);
setDataTextPosition(3);
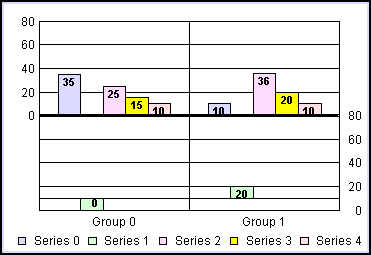
See getY1ScaleMaxAutoValue(), Y1ScaleMinAuto.
xgetY2MajorGridColorBand1()
This method returns the object ID of the Y2-axis Color
Band 1, which allows color banded styling to be applied to the Y2-axis
grid in a graph.
Syntax:
IdentObj getY2MajorGridColorBand1()
Example:
setDisplay(getY2MajorGridColorBand1(),true);
setFillColor(getY2MajorGridColorBand1(), new Color (171,221,239));
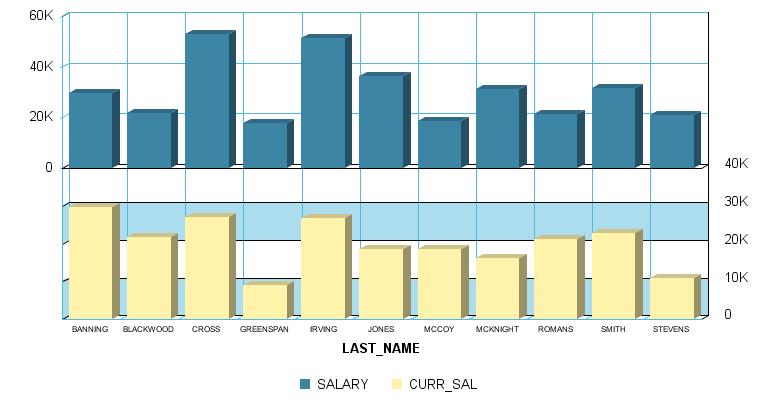
xgetY2MajorGridColorBand2()
This method returns the object ID of the Y2-axis Color
Band 2, which allows color banded styling to be applied to the Y2-axis
grid in a graph.
Syntax:
IdentObj getY2MajorGridColorBand2()
Example:
setDisplay(getY2MajorGridColorBand1(),true);
setFillColor(getY2MajorGridColorBand1(), new Color (171,221,239));
setDisplay(getY2MajorGridColorBand2(),true);
setFillColor(getY2MajorGridColorBand2(), new Color (153,198,214));
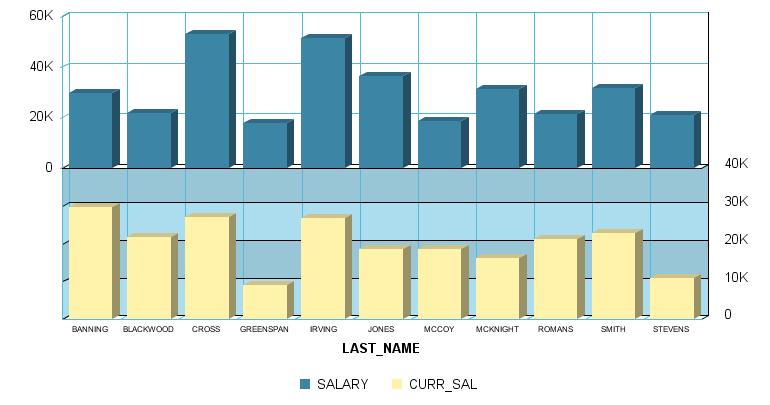
xgetY2MajorGridStepAutoValue()
When the Y2MajorGridStepAuto property is true (enabling
automatic calculation of major grid steps on the Y2 axis), this
method returns a Java double-precision number that identifies the
interval between major grid steps on the Y2 axis.
Syntax:
double getY2MajorGridStepAutoValue()
Example:
setDepthRadius(0);
setViewableGroups(2);
setDataScrollerPresenceGroups(0);
setGraphType(21);
setDataValue(getSeriesGroup(1,0), getY2MajorGridStepAutoValue());
setDataTextDisplay(true);
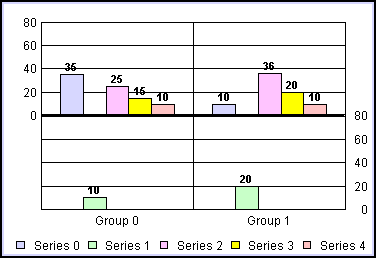
See Y2MajorGridStepAuto.
x
When the Y2ScaleMaxAuto property is true (enabling automatic
calculation of the maximum scaling value on the Y2 axis), this method
returns a Java double-precision number that identifies the maximum
scale value that will be used on the Y2 axis.
Syntax:
double getY2ScaleMaxAutoValue()
Example:
setDepthRadius(0);
setViewableGroups(2);
setDataScrollerPresenceGroups(0);
setGraphType(21);
setDataValue(getSeriesGroup(1,0), getY2ScaleMaxAutoValue());
setDataTextDisplay(true);
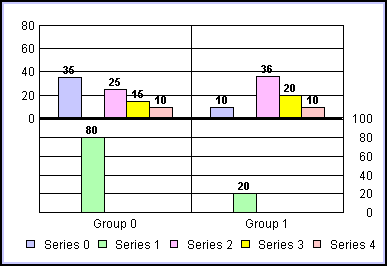
See getY2ScaleMinAutoValue(), Y2ScaleMaxAuto.
x
When the Y2ScaleMinAuto property is true (enabling automatic
calculation of the minimum scaling value on the Y2 axis), this method
returns a Java double-precision number that identifies the minimum
scale value that will be used on the Y2 axis.
Syntax:
double getY2ScaleMinAutoValue()
Example:
setDepthRadius(0);
setViewableGroups(2);
setDataScrollerPresenceGroups(0);
setGraphType(21);
setDataValue(getSeriesGroup(1,0), getY2ScaleMinAutoValue());
setDataTextDisplay(true);
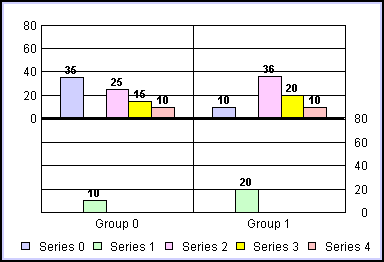
See getY2ScaleMaxAutoValue(), Y2ScaleMinAuto.


