WebFOCUS Visual Discovery AE views can be used to perform
a variety of tasks. Views include:
xWebFOCUS Visual Discovery Getting Started Dialog
The WebFOCUS Visual Discovery AE Getting Started dialog
box displays after you click the icon on your desktop. Use this
dialog box to open the application.
Use the dialog box to:
-
Access the Quick Start wizard. This wizard guides
you through the process of loading data and selecting how the data
is to be displayed for analysis.
-
Create a new project. Select this option to display a
blank page in the workspace.
-
Open an existing project. This option can be used to
select an existing project.
Tip: To display this screen each time you start the application,
be sure a checkmark appears in the Show This Screen on Startup field.
Access the Quick Start Wizard
- Click the Quick Start button to display
the welcome page of the Quick Start wizard. Click Next.
- In the Load Data wizard page, select the method in which you
wish to load data:
- Click Data Wizard to
load data using the Data Wizard.
- Click Data Templates to load previously-defined
data. The Load Previous Data Sources dialog box displays. Select
a data source by clicking the check box next to the applicable entry
and click Open.
Click Next.
- Select an analysis template based on the type of data that you
are using as well as the analysis you are performing. Click Next.
- In the Select Primary Analysis Field wizard page, use the drop-down
lists to select the data table and table field which will be the
primary focus of your analysis. Click Next.
- Optionally, you can select other fields, using the Select Related
Fields wizard page, to aid in your data analysis. Click Next.
- Optionally, choose a Measure field from the drop-down list.
Note that if you do not select a measure here, WebFOCUS Visual Discovery
AE uses the count of items as the unit of measure. Click Next.
- The Summary wizard page displays information about the page
that WebFOCUS Visual Discovery AE has created based on your selections.
Review this information. To complete the process, click Next.
To make changes, click Back and change your
selections as required.
- The Page Design Completed wizard page displays. Click Finish to
close the wizard.
Creating a New Project
- Click the New Project button. A blank
page is added to the workspace.
Opening an Existing Project
- To open an existing project, click the Open Project button.
In the Open Project dialog box, select a project from the list
and click Open.
- The data is loaded and the project page is displayed in the
workspace.
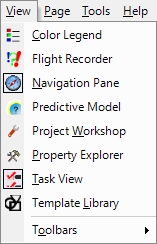
xColor and Selection Legend
To access this view, select Color Legend from the View
menu or click the  button. The Color Legend,
located at the bottom right side of the screen, displays the color scale
for currently-selected data.
button. The Color Legend,
located at the bottom right side of the screen, displays the color scale
for currently-selected data.
The Color Legend shows how color is applied to the data that
is displayed in the Color By field. By selecting data within a chart,
you can see how color is assigned to the selected data. This is
a read-only view. Information displayed here cannot be changed or edited.
x
The Project Workshop View allows you to view and manage
your project. To display the Project Workshop view, select Project
Workshop from the View menu or click the  button in the View toolbar.
The Project Workshop Elements
-
Tree/panel design. The Project Workshop makes use
of the familiar tree/panel design. Project items are arranged in
the tree to allow fast and easy access. As you click to select
an item in the tree, the associated panel displays item-specific information
and tasks.
-
Toolbar. Frequently used tools and functions are just
a click away on the toolbar of the Project Workshop, which is always
accessible, no matter which project item you are viewing.
-
Navigation. With the Project Workshop, you can get to
there from here, and in a variety of ways:
- Selection of items
in the tree.
- Using the Back/Forward buttons, which are located on the toolbar.
- Using the navigation bar, which is located below the toolbar.
- Selection of links to related items from the current panel.
Capabilities
-
Load Data
-
Manage Data Sources
-
Use the Link Wizard and Modify Links Dialogs
-
Use Color Models
-
Use the Expression Builder
-
Use the Date Parser
-
Configure Data Hierarchies
-
Data Pool Visualization
x
The Date Parser can be used to generate new date/time
fields for a dataset without having to manually edit the data source.
New date/time fields are created in the project using one of 29
format options, based on data values from an existing field with
a DateTime data type.
The Date Parser can be very useful for generating rollups (for
example, week, quarter, month, year) from a detailed date format.
However, be aware that the result data type is (currently) a String,
not a Date, so use a format that will sort properly and be aware
that some charts that accept dates do not accept string (for example,
Time Table x axis). The formats that will sort properly are marked
with a check in the Sortable column.
To access the Date Parser, select Date Parser from the Tools
menu or click the Date Parser button  in the Project Workshop
toolbar. Select a table from the Table drop-down list. Select a DateTime
field from the drop-down list. Only fields with the DateTime data
type will appear in this list.
in the Project Workshop
toolbar. Select a table from the Table drop-down list. Select a DateTime
field from the drop-down list. Only fields with the DateTime data
type will appear in this list.
In the Date/Time Field Options grid, select the checkbox for
the applicable format option that will be used to generate the new
date/time field. Once you select a format, the New Field Name column
displays a default field name. You can edit this name as desired by
clicking on the New Field Name cell and editing
the existing name or typing in a new name.
NOTE 1: You can select multiple date/time field options.
NOTE 2: If the data values in the source DateTime field do not
contain the necessary information, the generated field will contain
empty data values (zeros). For example, if you selected the Hour:Minute
format option and the source DateTime field does not contain time values,
the new Hour:Minute field will be displayed 00:00 data values.
Click Apply to add new fields to the selected
table in the data pool.
x
The Expression Builder is used to create new fields
defined by an expression or calculation. This expression consists
of operators, constants, functions, and fields from one data table.
Fields may be numeric, string, or date. A separate tool, the Date Parser,
is also available for manipulating dates and provides a wider set
of formatting options.
To Access the Expression Builder
Select Expression Builder from the Tools menu or click the Expression Builder button
 in the Project Workshop
toolbar.
in the Project Workshop
toolbar.
User Interface
Elements of the user interface are:
-
Table. Choose a table name.
-
Calculated Field. Existing calculated fields in the current
table are shown in the drop-down list; type into this box to name
a new field.
-
Drag or select to add to expression. This box contains
a tree that shows the data fields available in the current table
and the operators, functions, and constants that can be used to
create expressions. You can use this as a reminder, or drag items from
it into the expression edit box to construct your expression.
-
Expression edit box. Define your expression her by typing
directly into this box, dragging elements from the tree, or clicking
elements in the tree.
-
New Field Preview. After you have created an expression,
this will show the first 25 rows of the input rows and the created
field so that you can check that the expression created what you
expected.
-
Result type. After a new field is created, this shows
the type of that field. Types will be string, integer, double,
or date.
Control buttons are:
-
Evaluate. Click this to create a new field using
the specified expression.
-
Clear. Clears input so that you can start over.
-
Delete. Deletes the field show in the Calculated Field
list box.
-
Cancel. Cancels all changes made and closes the dialog;
the state of the data is as it was when the dialog was started.
-
OK. Exit from the dialog leaving all changes.
-
Help. Show this help.
To Create a New Expression
- Select the table to contain the new field from the Table
box.
- Name your new field in the Calculated Field box.
- Type the expression or click or drag fields, operators, functions,
and constants from the language box.
- Click Evaluate to create the new field
and show its first 25 rows.
- Exit keeping the new field by clicking OK.
Exit without keeping the new field by clicking Cancel.
To Edit an Existing Expression
- Select the table to contain the new field from the Table
box.
- Select the name of the existing field from the Calculated Field
box.
- Modify the expression by typing or clicking and dragging fields,
operators, functions, and constants from the language box.
- Click Evaluate to modify the field and
show its first 25 rows.
- Exit keeping the modification by clicking OK.
Exit without keeping the change by clicking Cancel.
To Delete an Existing Calculated Field
- Select the table to contain the new field from the Table
box.
- Select the name of the existing field from the Calculated Field
box.
- Click the Delete button.
- Exit with this change by clicking OK.
Exit without the deletion by clicking Cancel.
To See Usage of an Existing Calculated Field
- Be sure that the Usage tab is displayed. From the Table
drop-down list, select the table that contains the calculated field(s)
that you have to view. A list of calculated fields is displayed.
- To delete one or more of these fields from the project, click
the checkbox for each field to be deleted (a checkmark should appear
in the checkbox). Click the Delete button.
- Charts that use a calculated field may be found with the Usage
button.
Warning
Beware of expressions that produce semi-additive measures!
Semi-additive measures are meaningless if they are aggregated by
summing. For example, you can calculate the percentage of one field
versus another (for example, Int( FieldA / FieldB * 100)). But
if you weight a Bar Chart by this new field, it will be weighted
by the sums of the percentages of the rows that have that category.
This is not a useful weight! In this case, you should use the Ratio
weight in the bar chart instead to yield a weight that aggregates correctly.
Expression Language
- Case and whitespace in expressions are not significant.
Operator precedence follows standards mathematical standards (and
follow the rules of the C programming language).
- An expression is evaluated for each row in a table, and the
result of the expression is added as the value of a new field to
that table.
- Integers and double values may be used interchangeably, but
otherwise there are not implicit type conversions. You must explicitly
convert types using the string(), double(), or int() functions.
- All tokens of the language (for example, function names, constants)
are case independent: now and Now will both be recognized. Field
names must match case, however.
- See Primitives below for a discussion of legal field names,
strings, and quoting.
Primitives
The names in angle brackets used below indicate a class of characters.
|
Item
|
Meaning
|
|---|
|
<integer>
|
Any integer number. Examples are: 0, 1,
11, 243.
|
|
<real>
|
Any real (decimal) number. Decimal constants
in expressions must be entered in US format, with a . as the decimal
point. Examples are: 0.1, 1.1, 3.14159.
|
|
Any string
|
A literal string is enclosed by single quotes
(') and may contain any printable character.
|
|
<fieldname>
|
The name of a field in the target table.
The value of that field for the current row is substituted. Names
starting with an alphabetic character and consisting of only alphanumeric
characters and underscore (_) do not need to be quoted. If the field
name contains other characters, such as spaces, the name must be
quoted. A field name that matches an Expression Builder reserved
word, such as a function name, must be quoted. Use back quotes (`)
for a field name. Double quotes may also be used.
|
|
A field name
|
A field name enclosed by back quotes (`)
and may contain any printable character including space. Quoting
may also be used if a field name is the same as an Expression Builder
reserved word, such as a function name.
|
|
string
|
A string surrounded with double quotes that
matches a field name in the current table will be taken as that
field name; otherwise it is a literal string. This usage is not
recommended since an invalid reference to a field name may not be
detected; use back quotes instead.
|
|
mm/dd/yy
|
Constant dates are given as
strings using the format of the current locale; time is optional.
Constant dates are currently only valid in comparison operators.
|
|
i
|
Current row index, starting
at 1.
|
|
n
|
Number of rows in the table.
|
|
missing
|
A missing value in a field.
A missing value indicates the absence of data. Most charts ignore
missing data or display it optionally. Missing values may be present
in the source data. In general a missing value in an expression
will cause the result of evaluating the expression to be missing
as well, since most operations combined with missing result in missing.
Missing values may be tested for (using the if ... then ... else
... expression) and created in the output field (again typically
using an if ... then ... else ... expression).
|
|
now
|
The current date and time.
This can be broken into year, month, or day using date functions,
and can be subtracted from a date field value to find the number
of days between the dates.
|
|
nowdataload
|
The date and time when the data was loaded.
For an adv project that loads data, this will be basically the same
as now. For an advm project that includes saved data, this will
be the date/time when that project was created. Use this if you
will be working on a project with saved data for a period of time
and adding new calculations which you want to all be relative to
the same current point in time. Case is irrelevant, so you can use
NowDataLoad or other alternatives as well.
|
Functions taking Numeric Field
|
Item
|
Meaning
|
|---|
|
mean(field)
|
The mean or average of the field.
|
|
median(field)
|
The median, the middle value from the field
after it is ordered. The middle of the sample.
|
|
stddev(field)
|
The standard deviation of the field values.
|
|
sigma(field), var(field), variance(field), sigma2(field)
|
The variance of the field values, the standard
deviation squared.
|
|
norm(field)
|
The normalized value, (x - mean) / stddev
|
|
order(field)
|
Integer index of the value in the current
row in sorted order. The median is the valued indexed by the middle
value in the order.
|
|
rank(field)
|
Rank of numbers in the field.
|
|
min(field)
|
The minimum value in the field.
|
|
max(field)
|
The maximum value in the field.
|
|
bin(field, integer)
|
Create an integer bin number
based on the field values. The range of the field is divided into
integer bins, and the bin number is used as the value of the calculated
field.
|
|
sum(field)
|
Sum of values in the field.
|
Functions taking Numeric Expressions
|
Item
|
Meaning
|
|---|
|
sqrt(expr), root(expr)
|
Square root.
|
|
log(expr)
|
Natural log.
|
|
log10(expr)
|
Logarithm base 10.
|
|
exp(expr)
|
Exponential.
|
|
abs(expr)
|
Absolute value.
|
|
sign(expr)
|
1.0 if the number is positive, -1.0 if the
number is negative, and 0.0 if the number is 0.0.
|
|
int(expr)
|
The expression value truncated
to an integer (if a double) or converted from a string.
|
|
double(expr)
|
The expression value as a real
or double. The expression may be a string or an integer.
|
|
min(expr, expr, ...)
|
Minimum of list.
|
|
max(expr, expr, ...)
|
Maximum of list
|
|
string(expr, [format])
|
Converts expression to a string. The optional
second parameter is a string specifying how the conversion of a
number is to be done. The values for this format are given below.
This is most commonly used to give the precision. For example, %.2f
gives 2 decimal places. Since all numbers are internally represented
as real numbers, to format an integer without a decimal fraction,
use this format: %.0f.
|
Formatting Numbers
The format for a numeric result may be
specified by appending as <format>, where formats are n[0-9],
d, or c[0-9] ([0-9] specifies an optional number of positions after
a decimal point; the brackets are not actually used in the specification):
|
Item
|
Meaning
|
|---|
|
n[0-9]
|
Format as number with optional precision.
A thousand separator (,) will be used. Examples are n (0 precision),
n0 (0 precision), n2 (2 digit precision).
|
|
d
|
Format as integer number with no thousand
separator (,). This can be used if the result is a year, of example,
where a thousand separator is unexpected.
|
|
c[0-9]
|
Format as currency with optional precision.
A thousand separator (,) will be used. Examples are c (0 precision,
currency symbol, thousand separator) or c2 (2 digit precision, currency
symbol, thousand separator).
|
For example, here is an expression that will be formatted as
currency, with a thousands separator, and no decimal places:
amt / 10.0 as c
For example, here is an expression that will be formatted as
currency, with a thousands separator, and 2 decimal
amt / 10.0 as c2
The result of this expression will be formatted as an integer
with no thousand separator and no decimal places of precision:
amt / 10.0 as d
This result of this expression will be formatted with a thousand
separator and 1 digit of precision:
amt / 10.0 as n1
See Examples below for additional examples.
Functions taking String Expressions
Item | Meaning |
|---|
double(string) | Convert string expression to a double.
If the string is not a valid number, then missing. |
int(string) | Convert string expression to an integer.
If the string is not a valid number, then missing. |
substring(string, start, [length]) | Substring of string expression beginning
a start position (1 index) for length characters. If length is
omitted, the remainder of the string. |
match(string, pattern) | Returns 1 if pattern matches the string
expression, otherwise 0. Syntax for patterns is given below. |
sub(string, pattern, replacement) | For string expression, for the substring
matched by pattern, replace with replacement. Matches for occurrence
of pattern. |
gsub(string, pattern, replacement) | Replaces all occurrences of pattern in
string expr with string replacement. |
lower(string) | Convert string to all lower case. |
+ | Plus operator concatenates 2 strings. |
Note that the Date Calculator can also be used to convert dates
into a large number of equivalent formats.
Operators
Item | Meaning |
|---|
( ) | Parenthesis, for grouping. |
+ | Addition for number, concatenation for strings |
- | Subtraction. If operands are dates, the
result is the time difference in days. |
* | Multiplication |
/ | Division |
% | Modulo |
div | Integer division |
mod | Integer modulo |
^ | Exponentiation |
Logical Operators
The result of a logical operator is an integer 0 (false) or 1
(true).
Item | Meaning |
|---|
&& | Logical and |
|| | Logical or |
! | Not |
== | Equals |
!= | Not equal |
<= | Less than or equal |
< | Less than |
> | Greater than |
>= | Greater than or equal |
Set Operator
The set operator in is used to test if a field value is contained
in a specified set of values. This is a short hand to replace a
sequence of tests: field == a || field = b || field = c || ....
Item | Meaning |
|---|
<fieldname> in {v1, v2, ..., vn) | Test if values from fieldname are in the
set of constant literal values. The values must be numbers, strings,
or dates, according to the type of the field fieldname. |
Conditions
Item | Meaning |
|---|
condition ? expr1 : expr2 | If the condition is true, the result is
expression1; otherwise the result is expression2. Conditionals
can be nested to form if ... then ... else if ... chains. When
nesting, use parentheses to group. For example, consider this expression: a
= b ? e1 : a = c ? e2 : e3 This means: (a = b ? e1
: a = c) ? e2 : e3 but you probably intend: a = b ?
e1 : (a = c ? e2 : e3) Use parentheses so that it is interpreted
as you intend. |
if <condition> then <expr1> else <expr2> | Alternative syntax for if ... then ...
else .... This form does not require that the else clause be enclosed
with parentheses. |
Formats for Numbers
Numbers are stored internally as doubles, so the format specification
describes how to format a double as a number. The format for a number
converted to a string may be specified using a string with this
format:
The number is substituted for the format specification, which
begins with a %. Any other characters are included in the output
but do not affect formatting. Format specifications are:
- %f. Decimal notation; use .n to specify precision,
for example, %.2f. Use %.0f if you do not want a fractional part
(for example, the number is really an integer).
- %e. Use scientific notation
- %E. Scientific notation with E for exponent
- %g. Floating point or scientific notation, whichever
is smaller
The default format uses %f.
Regular Expression Patterns
Pattern matching functions accept string that are patterns using
this syntax.
An element can be one of the following things:
Examples:
- a matches the target sequence a but does not match the target
sequences B, b, or c.
- . matches all the target sequences a, B, b, and c.
- [b-z] matches the target sequences b and c but does not match
the target sequences a or B.
- [:lower:] matches the target sequences a, b, and c but does
not match the target sequence B.
- (a) matches the target sequence a and associates capture group
1 with the subsequence a, but does not match the target sequences
B, b, or c.
Repetition
Any element other than a positive assert, a negative assert,
or an anchor can be followed by a repetition count. The most general
kind of repetition count takes the form {min,max}. An element that
is followed by this form of repetition count matches at least min successive
occurrences and no more than max successive occurrences of a sequence
that matches the element. For example, a{2,3} matches the target
sequence aa and the target sequence aaa, but not the target sequence
a or the target sequence aaaa.
A repetition count can also take one of the following forms:
- {min}. Equivalent to {min,min}.
- {min,}. Equivalent to {min,unbounded}.
- *. Equivalent to {0,unbounded}.
Examples:
- a{2} matches the target sequence aa but not the target sequence
a or the target sequence aaa.
- a{2,} matches the target sequence aa, the target sequence aaa,
and so on, but does not match the target sequence a.
- a* matches the target sequence , the target sequence a, the
target sequence aa, and so on.
A repetition count can also take one of the following forms:
- ?. Equivalent to {0,1}.
- +. Equivalent to {1,unbounded}.
Examples:
- a? matches the target sequence and the target sequence
a, but not the target sequence aa.
- a+ matches the target sequence a, the target sequence aa, and
so on, but not the target sequence.
Concatenation
Regular expression elements, with or without repetition counts,
can be concatenated to form longer regular expressions. The resulting
expression matches a target sequence that is a concatenation of
the sequences that are matched by the individual elements. For example,
a{2,3}b matches the target sequence aab and the target sequence
aaab, but does not match the target sequence ab or the target sequence
aaaab.
Alternation
A concatenated regular expression can be followed by the character
'|' and another concatenated regular expression. Any number of concatenated
regular expressions can be combined in this manner. The resulting
expression matches any target sequence that matches one or more
of the concatenated regular expressions.
Examples
Item | Meaning |
|---|
1 | This creates an integer field with a constant
value of 1. Give this a meaningful name based on the thing that
each row represents (for example, # Customers if a row is a single
customer). This can be used instead of the standard count aggregation
since that isn't available within the Expression Builder expressions
or Bar Chart ratio aggregations. |
abc | New string field with values abc. |
x > (2 * median(x)) ? 1 : 0 | New field has value 1 where the value of
field X is greater than twice the median value, otherwise value
0. |
x - mean(x) | New field contains difference between current
row value and the mean. |
order(x) | New field has sorted order index of values
in numeric field x. |
int( x / 8 ) | New integer field has the value of numeric
field x that contains a number of hours converted to an integer
number of 8 hour days. |
(Employees <= 100) ? 100 : ((Employees
<= 250) ? 250 : ((Employees <= 500) ? 500 : ((Employees <= 750)
? 750 : (Employees <= 1000) ? 1000 : 1500))) | if ... then ...else expressions can be
nested to apply a series of tests; this creates bins for number
of employees into groups of 100 and under, 101 - 250, 251 - 500,
501 - 750, 751 - 100, and over 1000. It may be easiest to create
this outside of the Expression Builder using a text editor and then
copy and paste it into the Expression Builder. Note that parentheses
must be used to nest the conditional expressions in the else clause
correctly. |
if field1 = cp then y else n | New string field with values of y or n
based on whether field field1 has value cp. |
Field1 / (Field2 == missing ? 1 : Field2) | Divide Field1 value by Field2; if Field2
value is missing, then divide by 1. |
'A' + `Field A` + FieldB | Concatenate the string literal A with the
string field Field A and the string field FieldB. Field A and FieldB
must both be string fields; if not, convert to strings with the
string() function. |
match(FieldA, ^[0-9]*$) | New field with value 1 if FieldA value
is a number (matches the pattern that defines a sequence of numeric
digits) or 0 if not a number. |
match(FieldA, ^[0-9]*$) ? 1 : missing | New field with value 1 if FieldA contains
a string that is a number, or missing if not. |
if FieldA = missing then 0 else FieldA | New field with values of FieldA with missing
values replaced by 0. |
year(Date) | The 4 digit year from a date. |
int(now - Date) | Elapsed days from a date to today as an
integer. The elapsed days returned by the subtraction is a float,
which is not ideal for use in categorical charts such as bar charts.
|
int(NowDataLoad - Date) | Elapsed days from a date to when the data
was loaded as an integer. Use this form if you are working for a
period of time with saved data and want calculations to all be based
on the same now. |
year(now) - year(Date) | Number of years between date and today.
|
(now - Date) * 0.714 | Approximate working days between Date and
today (0.714 ~= 5/7). |
match(Date, Q3) ? string( (int( substring(Date, 1,
4) ) + 1), %.0f) + Q1 :(match(Date, Q4) ? string( (int( substring(Date, 1,
4) ) + 1), %.0f) + Q2 :(match(Date, Q1) ? substring(Date, 1, 4)
+ Q3 :(substring(Date, 1, 4) + Q2) ) ) | Shift a string in year/quarter format to
a June 30 fiscal year: 2007Q3 to 2008Q1 2007Q4 to 2008Q2 2008Q1
to 2008Q3 2008Q2 to 2008Q4 This is a series of nested
if ... then ... else ... expressions for the 4 possible quarters.
If the existing field matches Q1 or Q2, the year substring is found
and the shifted quarter is appended, Q3 or Q4 (respectively). If
the existing field matches Q3 or Q4, the year substring is found,
converted to an integer, incremented 1, converted back to a string
with 0 precision and the shifted quarter appended. Note that the
conversion of the year to a string must have 0 decimal places specified
(%.0f), since the integer is represented internally as a float.
|
year as d | Format field as number with no thousand
separator (,). |
amt / 10.0 as c | Display field as currency, with thousand
separator (,). |
FieldA in {a, b, c} | True (non zero) if the value of FieldA
is a, b, or c. Note that the constant strings must be quoted. |
FieldB in {1, 10, 100} | True (non zero) if the value of FieldA is
1, 10, or 100. |
FieldC in {'10/1/2001', '10/1/2002', '10/1/2003'} | True (non zero) if the value of FieldC
is any of the given dates. FieldC must be a date field. The date
is formatted according to the current locale and must be a quoted
string. |
x
The Flight Recorder is a record of what you have done
that can also be used to repeat previous actions. It provides
- A record of what you have done. Actions you take and selections
you make from charts are listed. Small images of charts you have
selected in show the selection you made.
- A place to collect observations by adding notes.
- A tool that can repeat previous actions, in the same session
on the same data or in a later session with updated data.
- A tool that can save "bookmarks" that may be reused in the future
or shared with others.
The Flight Recorder is a panel that appears initially on the
right side of the application frame. It is not displayed by default.
You display it by choosing the "Flight Recorder" menu item in the
"View" menu or "View" toolbar.
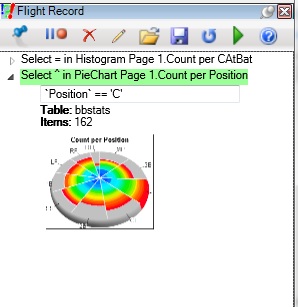
Most of your actions are recorded to the Flight Recorder automatically.
Recorded actions have a 1 line summary; some have additional details
that are revealed by clicking the arrow to the left.
The display for a selection operation includes:
- The label "Select", the operation.
- An indication of the selection mode: Replace (=), add (+),
subtract (-), intersect (&) and toggle (^).
- The type of chart (Bar, Pie, Line, etc.).
- The Page and Title of the chart.
- Expanding shows additional details:
- A textual description
of the selection.
- The number of rows selected.
- A reduced image of the chart after the selection.
Other actions are tracked as well, although they are typically
only described by the action and (if appropriate) chart page and
title.
Clicking a Flight Action selects it; click again to unselect
it. Drag over a series of actions to select them all. Selected
actions are highlighted in green.
The Flight Recorder pane provides a set of action buttons. (All
of these may not be visible if the pane is not wide enough; drag
the frame wider if necessary.) By default a minimal set of action
buttons is shown; a larger set may be shown using the context menu in
the Flight Recorder pane (below).
|
Button
|
Description
|
|---|
|
Bookmarks
|
Manage or use local bookmarks (discussed
below).
|
|
Turn on/off
|
Turn recording off to stop collection of
actions during a sequence that you are not interested in recording.
Not shown by default.
|
|
Clear
|
Clear all or selected actions. Not shown
by default.
|
|
Note
|
Add a note to the pane at the end or a selected
item. Notes are inserted with default text; click the note to edit
the text.
|
|
Import
|
Import a sequence of actions from a file.
The file is produced with the "Export" button (next). Not shown
by default.
|
|
Export
|
Export the selected actions
to a file. If nothing is selected, the entire Flight Record is written.
The number of actions written is displayed in a dialog afterward.
Not shown by default.
|
|
Go To
|
Click a selection action in
the Flight Record, then press this button to go back to the state
after that selection action. Non-selection actions are not repeated.
A Note is added to the Flight Record where this was done; An entry
is added to the Flight Record that lists all of the actions repeated.
If the selected state is different after replay than when the actions
were originally used, the different counts is shown. Limitations
on this replay are discussed below.
|
|
Do
|
Re-execute the selected flight
actions. Only some actions can be re-executed. A Note is added to
the Flight Record where this was done; expand the entry to see the
actions repeated. Counts of the original selected items versus the
current are shown if they do not match the original selection state.
Limitations on this replay are discussed below.
|
|
Help
|
Display help on this pane.
|
You drag across items in the Flight Record with mouse button
1 depressed to select them.
Clicking the Right Mouse Button shows a context menu with additional
options:
- Select All: Select all text in the Flight Record.
- Copy: Copy currently selected text to the clipboard.
- Print: Print the flight record.
- Full User Interface: show all operations listed above
The pane containing the Flight Record can be managed like any
WebFOCUS Visual Discovery Workbench AE pane:
- It can be hidden by clicking the "X". It can be restored
using the "Flight Recorder" menu item in the "View" menu.
- It can be "unpinned" by clicking the "pin" icon so that it "folds"
into the side of the application unless you hover the mouse over
it.
- It can be detached from the application, making it a floating
window, by dragging the top window frame.
- It can be docked to a side of the application by dragging to
the application frame. The pane docks when the dragged mouse cursor
touches the frame.
x
Bookmarks are states in your analysis that you can return
to. They persist between sessions on the current PC and are associated
with the current project. A bookmark can either be a saved list
of actions (as in the "Do" command described above) or a list of
actions that recreate the state as of a single selected action (as
in the "GoTo" command described above). Bookmarks are managed with
the "Bookmark" menu item in the top toolbar.
Actions for bookmarks are
- Go To ...: Go to the state defined by a bookmark.
- Create: Create a new bookmark using the state of the currently
selected action; you will be prompted for a name. "GoTo" style bookmarks
must be created from a single selected action; "Do" style bookmarks
are created from a list of selected actions. Bookmarks must have
unique names.
- Export: Export the current bookmarks to a file.
- Import: Import bookmarks from a previously exported file.
- Clear All: Remove all bookmarks.
Since bookmarks are stored on the local PC, to share them with
another person or PC, export the bookmarks and send the file.
x
How are "Go To" and "Do" performed?
The "Go To" and "Do" commands replay actions you took
previously. These both use the text descriptions given by the "Select"
or "Filter" detail lines in the Flight Record. These lines are text
descriptions of the selection action that you took with the mouse
in the chart.
Differences between these commands are:
- The "Go To" command replays only previous actions that impact
the goal state that you selected, returning you to that state. The
starting state of the dashboard doesn't matter.
- The "Do" command replays only the actions you selected. The
starting state is whatever the current state is when you press the
button. If this state is not the state when the sequence was originally
done, the end state may be different.
If you select the same sequence of actions and use each button,
"Do" works starting at the current state, while "Go To" will try
to return to exactly the same state no matter what the current state
is.
Actions are replayed using the text descriptions given by the
"Select" entry for the action. These descriptions are logical expressions
using the same language supported by the Expression Builder. Replaying
works by evaluating this condition for every row in the data table.
If the result is true, then that data row is "identified" by the
action, just as it was by the graphical selection you made with
the mouse. The impact of a row being "identified" is based on the
selection mode (replace, add, subtract, intersect, toggle) recorded
for the action.
Graphical selections in charts can be ambiguous: there may be
a number of interpretations of you intent. For example, consider
the selection in the bar chart labeled "Perror per Team" here. Bar
Chart selection. This bar chart is ordered by "Team", the X axis category,
with categories weighted by the field "Perror".
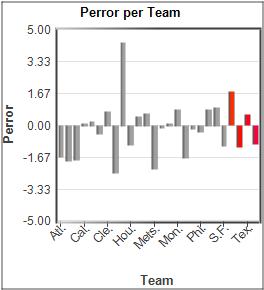
This selection could be described in a few ways:
- The top 4 bars in the chart.
- The bars named "Sea.", "StL.", "Tex.", and "Tor.".
- The bars with names between "Sea." and "Tor.", inclusive.
- The bars with names greater than "S.F.".
If this exact data is loaded, any of these interpretations will
have the same result. If the data is different, however, the result
may be different with different interpretations. For example, if
a new category "SanD." appeared in the data, this category would
be selected by condition 4 but not by the other rules.
The conditions created are based on the ordering of the chart,
its range, and the items selected. Conditions are chosen to give
a description that seems most appropriate, but this condition may
not have the same result when applied to new data.
When the automatically created condition is not correct for new
data, you can edit the text on the "Select" (or "Filter") line,
using the expression syntax described for the Expression Builder,
to better express your intent.
Conditions are in terms of the data that is used by a chart.
For charts that show aggregated data, the conditions are in terms
of the aggregation, not the underlying data.
When a previous Flight Actions is replayed, it is done using
the state of the chart when the action was recorded, independent
of the current state of the chart. For example, if you change the
ordering of a bar chart, replay of a previous action is still based
on the ordering in effect when the original action occurred (assuming
the recorded condition depends on order).
Limitations
- The number of items selected may differ slightly even when
replaying against the same data due to slight differences between
the graphical selection and the condition. Typically the difference
will only be a few items.
- Ordering by percent selected and by average in aggregated charts
(Bar, Line, Pie) are not currently recognized.
- Text condition are not created for these charts: Multiscape,
Data Constellations, Time Table, and Map. For these charts, replay
is done by reproducing the graphical sweep that you did originally.
x
From the View menu, select Help View or click the  button in the View toolbar.
The Help Index displays on the right side of the screen. It displays
a table of content for how-to and other help-related information.
button in the View toolbar.
The Help Index displays on the right side of the screen. It displays
a table of content for how-to and other help-related information.
When you select an topic from the table of contents, it is displayed
in the Help tab located in the workspace area. This tab contains
the following navigation buttons:
|
Toolbar Button
|
Description
|
|---|
|

|
Navigate Back. Displays the help
topic that you last viewed.
|
|

|
Navigate Forward. Displays the next
help topic in the table of contents.
|
|

|
Refresh Page. Displays the latest
version of the current help page.
|
|

|
Sync Contents. Use this function
to synchronize the Help view topic in the Contents tab based on
the topic displayed in the workspace.
|
|

|
Stop Browser. When you make a selection,
click on this button when it appears red in the menu to cancel the
current action.
|
|

|
Home. Returns to the Welcome to WebFOCUS
Visual Discovery AE Help topic.
|
x
A Navigation Pane is a pane in the WebFOCUS Visual Discovery
Workbench AE User Interface that can show a short formatted document
that tells a user something important about how to use the current
tab. The Navigation Pane is an embedded web browser that displays
a page coded RTF. The page can use any of the capabilities of RTF, including
popup windows, images, text formatting, and links. A Navigation
Pane is associated with a single tab in a WebFOCUS Visual Discovery
AE dashboard, and is automatically displayed when the tab is displayed.
A Navigation Pane may describe the next step in using a dashboard,
but it does not directly change the state of WebFOCUS Visual Discovery
AE. It is documentation only.
The user may close the Navigation Pane if they do not wish to
see it; it will remain hidden in subsequent sessions.
From the View menu, select Navigation Pane or click the  button in the View toolbar.
The content shown in the Navigation Pane is page-specific and changes
as you move from page to page within the project.
button in the View toolbar.
The content shown in the Navigation Pane is page-specific and changes
as you move from page to page within the project.
Content in the Navigation Pane may include links that lead to
other content pages, much like the web.
For more information about Navigation Panes, see the tutorial
page.
x
The Property Explorer can be used to edit less frequently-used
and/or advanced properties specific to an individual chart. Properties
are described for each chart in its overview.
To access the Property Explorer, select Property Explorer from
the menu or click the  in the chart toolbar. You
can also access the Property Explorer from many of the individual charts
by selecting the Property Explorer button in the Chart toolbar.
in the chart toolbar. You
can also access the Property Explorer from many of the individual charts
by selecting the Property Explorer button in the Chart toolbar.
x
The Tasks view appears on the left side of the screen.
It displays the tasks are required to load data, create pages,
analyze displayed data, and share results.
To display this view, select Tasks View from the View menu or
click the  button.
Tasks include:
x
This step offers two options for loading data:
New Data Source. Displays the Data Wizard. Use this wizard
to load text, Microsoft Excel spreadsheets, Microsoft Access database,
relational databases, or Microsoft Analysis Services data. See Load Data Using the Data Wizard for more information.
Load Previous Data Source. Displays the Load Previous
Data Sources dialog box. This dialog box contains data sources
that have been previously loaded using the Data Wizard and which
were designated as Remember Data Source Definition items in the
wizard. Choose a data source by clicking the checkbox next to the
appropriate selection. Click Open.
Refresh Data. Reloads the data source in its current state.
This function allows you to access the most-up-to-date data source
without having to exit WebFOCUS Visual Discovery AE and reload the
data.
x
This step offers two options for designing pages:
Build Page. Displays the Basic Analysis Quick Start dialog.
Use this dialog box to designate data fields to create a page.
A page consists of a layout, data (primary and optional secondary
data fields that you specify in the dialog box), and measure field (also
selected using this screen).
- In the Basic Analysis Quick Start dialog, you can specify
primary data field information first. Using the drop-down lists
in the Primary Data Field section:
- Select the table from
the data to be analyzed.
- Select the field that is most important to your analysis.
- Optionally, you can select additional fields for analysis in
the Secondary Data Fields section, as well as a Measure field. Note
that the Measure field serves as the Y axis in those charts with
X and Y axes.
- Click Create Page. Your new page is
displayed in the workspace.
Load Page Template. Use this function to select and load
a page template. When you select this option, the Load Page Template
dialog box displays. Select a template from the list and click Load.
x
Now that the data you selected is displayed in a page,
you can analyze the information to find answers to your business
questions.
x
You can easily share the results of your analysis by
using one of the following options:
Export Data:
You can export data directly from Data Sheets or Summary Sheets
on dashboard pages. If you have filtered and excluded data from
your dashboard then you will be exporting the subset of data that
is currently selected.
Note: Only the columns shown in the data sheet or summary
sheet are exported. If you want to export additional columns, then
they should be added to the chart. If you want the columns to export
but do not necessarily want to see those additional columns in the
dashboard, place them over to the right and shrink the column width
so that you don't see them.
To export data from a dashboard page, right click on the Data
Sheet or Summary Sheet that you want to export and select "Export"
from the popup menu (Figure 1). The data will be exported into a
CSV file with a link that will open it in Excel.
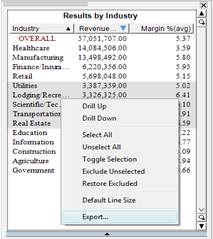
Exporting data from a Summary Sheet (or Data Sheet)
Copy Charts and Pages
You can copy charts directly from the dashboard pages as they
show on the screen. There are three ways to do this:
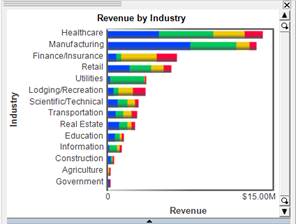
-
Copy a Single Chart: to copy a single chart out of
the dashboard, left click on the background of the chart so that
the chart window displays a thin grey border around the outer edge
(Figures 2, 3).
Note: Be careful that you do not click
on any data in the chart because then you will be selecting data
instead of selecting the chart window. Once the chart window is
highlighted with the grey border, use the Ctrl+C function on your
keyboard to copy the chart. You can now paste the chart into a new
document.
-
Export Current Page: In addition to copying a single
chart from a dashboard page, you can also copy all of the charts
on one dashboard page using the "Export Current Page" option on
the Page Menu.
This menu selection will export whatever page
is currently open in your dashboard. It opens a dialog (Figure 4)
which will allow you to change the default export title and description
for the page that you are exporting (the default title is the page
name in the dashboard). Next, choose the file format that you want
to export the page to. Under Options, decide whether or not you
want to include the color legend. Then save and open your new file.
-
Print screen: Another option is to screen capture the
whole page by using the Windows Print Screen function.
x
Saving a WebFOCUS Visual Discovery AE Project
You can save your work in a WebFOCUS Visual Discovery
AE project in one of two formats:
- An .adv format contains the project definition, but
no data. When an .adv project is opened it goes back to the source
data and reloads and rebuilds itself with a current copy of the
data. If you send this project to others, they must have rights and
a path to access the data. If the project cannot find the source
data, it will prompt the user for its location.
- An .advm format contains the project definition and all
the data. When an .advm project is opened it does NOT go back to
the source data -- rather it loads the data that is stored in the
project file into RAM, without going back to the data source(s). Because
user rights are not an issue with this format, you can send (or
post) this project to other WebFOCUS Visual Discovery AE users as
a standalone file.
x
Procedure: How to Save a WebFOCUS Visual Discovery AE Project:
-
Open the File Menu on the top toolbar.
-
Select "Save" to resave the current project in the same
name and format.
-
Select "Save As" to save the project under a new name
or format.
-
Projects are originally created in .adv format. To save
as an .advm form, select "Save As" and then make sure "Save as type"
is set to .advm.
x
Automating Project Refresh and Save
Also, WebFOCUS Visual Discovery AE ships with an adv2advm
utility which will open an .adv project file in order to reload
data from the data source(s), and then covert that file to an .advm
for end-user viewing and interaction. This utility can be embedded
in a short script so that a project can be refreshed periodically,
say daily, with the end result being an .advm file. An .advm file
will open faster, not impact the data sources, and consume less
RAM than the same project in an .adv file format. See Adv2Advm Utility
in Embedded Data in a Project, for more details.
xUsing the Template Library View
The Template Library is a repository of elements that
comprise a page. To access this view, select Template Library from
the View menu or click the  button.
The Template Library includes:
Data Sources. A data source is the path name where an
existing data source is located on your computer network.
Color Scales. A color scale is a range of colors that
can be applied to a variable. See Use Color Scale for more information about the color scales available
in WebFOCUS Visual Discovery AE.
Page Layouts. A page layout includes the size and placement
of the elements that comprise a page.
Color Schemes. A color scheme is a set of specific colors
that are assigned to specific items. For instance, a color scheme
could consist of a white background, black title font, green selector,
etc.
To select a template library element:
- Click on the appropriate template element (Data Sources,
Color Scale, Page Layouts, Color Schemes).
- A menu of selections displays. Double click on the desired
selection.