Defining a Conditional Report Style
In this section: How to: Reference: |
You can assign a conditional style to a report element. Conditional
styling enables you to define conditions that determine when to
apply particular fonts, point size, text style, foreground and background
color, vertical or horizontal grids, and drill down procedures to your
reports data when the report is run.
To apply conditional styling, first you define a global condition. Then,
you apply that condition to a report element.
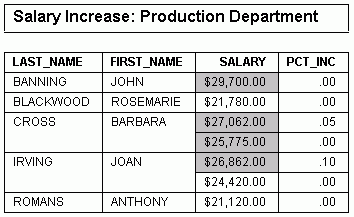
Example: Applying Conditional Styling to a Report
The
following example highlights employee salaries in excess of $25,000.
You
can also include variables that enable you to insert a new conditional
value each time the report is run. If the next week you wanted to
highlight all salaries that exceed $75,000, you would create a variable
condition that prompts you for a number each time the report is
run.
Note: If you plan to apply a customized style
template, you must do so before you define any conditional styling
attributes, or those attributes will be overwritten. For additional
information on stylesheets, see the Creating Reports With WebFOCUS Language manual.
x
Procedure: How to Access the Edit Condition Dialog Box for a Column
Conditions
are created, applied, and styled in the Edit Condition dialog box.
-
Right-click
the column in the Report Painter window and click Options from
the context menu.
The Field Properties dialog box opens.
-
From
the Style tab, click the Edit Conditions button.
The Condition List dialog box opens.
-
Click New.
The Edit Condition dialog box opens.
x
Procedure: How to Access the Edit Condition Dialog Box for a Report
Conditions are created, applied,
and styled in the Edit Condition dialog box.
-
Click Styling from
the Report Menu.
The Report Options dialog box opens at the Style tab.
-
From
the Style tab, click the Edit Conditions button.
The Condition List dialog box opens.
-
Click New.
-
The
Edit Condition dialog box opens.
x
Procedure: How to Access the Edit Condition Dialog Box for an Object Area
-
Highlight
an item (text or field) in an object area.
-
Right-click
the item.
-
Click Options from
the context menu.
-
From the
Style tab, click the Edit Conditions button.
The Condition List dialog box opens.
-
Click New.
-
The Edit
Condition dialog box opens.
x
Procedure: How to Create a Global Condition for a Report
A global
condition applies to any component in a report if you choose to
apply a condition. After a condition is defined, you can apply the
condition to any object.
Note: You can assign styling
after the condition is met. See How to Associate a Style With a Condition in an Object Area, How to Associate a Style With a Condition for a Column, or How to Associate a Style With a Condition for a Report.
Before you begin, review How to Access the Edit Condition Dialog Box for a Report.
Conditions are created, applied,
and styled in the Edit Condition dialog box.
-
Click Styling from
the Report Menu. The Report Options dialog box opens at the Style
tab.
-
From
the Style tab, click the Edit Conditions button.
The Condition List dialog box opens.
-
Click New.
The Edit Condition dialog box opens.
-
Type
a name for the condition or accept the default.
-
Select
the field for which you want to define a condition from the Field box.
-
Select
a relation from the Relations list.
-
Specify
a value by doing one of the following:
- Type a literal
value in the Value box.
or
- Click the Values button
to display existing database values and select a value.
or
- Click Another
Field to display other fields in the report and select
a field.
-
Click OK.
The condition is now added to the Condition List in the
Condition List dialog box, from which it can be applied to one or
more columns or to an object area.
Note: To create
another condition, repeat steps 4 to 10.
-
Click OK again
to return to the Style tab on the Report Options dialog box.
The default condition name (for example, COND0001) appears
in the Applying to Condition field box.
The condition you
created appears in the Condition Rule box.
You
can apply styling to the condition after it is met. See How to Associate a Style With a Condition in an Object Area, How to Associate a Style With a Condition for a Column, or How to Associate a Style With a Condition for a Report.
For related information about
conditional styling of data visualization bar graphs, see Visualizing Trends in Reports.
x
Reference: Condition List Dialog Box
The Condition
List dialog box has the following fields or options:
-
Condition
-
Lists conditions applied or available to be applied to the
selected object or report.
-
New
-
Enables you to create a condition in the Edit Condition Dialog Box.
-
Delete
-
Deletes the selected conditions from the selected object.
Select a condition from the Condition list box and press the Delete button.
-
Edit
-
Edits the criteria for the selected condition. The Edit Condition
dialog box opens. For more information, see the Edit Condition Dialog Box.
x
Reference: Edit Condition Dialog Box
The
Edit Condition dialog box has the following fields or options:
-
Condition
-
Displays the name of the condition being created or edited.
To change the default name (for example, COND0001), highlight the
text and type a new name.
-
Field
-
Displays a list of the columns that appear in the report.
-
Relation
-
Displays a list of possible relationships between the selected
report column and either a literal value or another field that it
will be compared to.
-
Value
-
Specifies a literal value or other field to which the selected
field is being compared in the When statement. The available choices
depend on the option button selected under Compare Type.
-
Compare Type
-
Chooses the type of comparison to make to the field selected
in the Field section. Select:
Value to
compare the selected field to a literal value. Press the Value button
for a list of data records.
Another Field to
compare the selected field to another field in the data source.
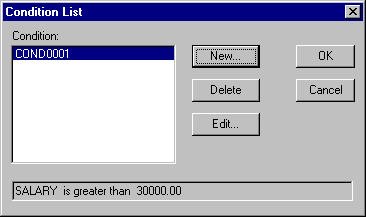
Example: Viewing a Condition in the Condition List Dialog Box
The
following image shows the Condition List dialog box displays the
condition COND0001: Salary is greater than or equal to $30,000.00:
Example: Creating a Report With Conditional Styling
Tip: For
an example of conditional styling with data visualization bar graphs, see Visualizing Trends in Reports.
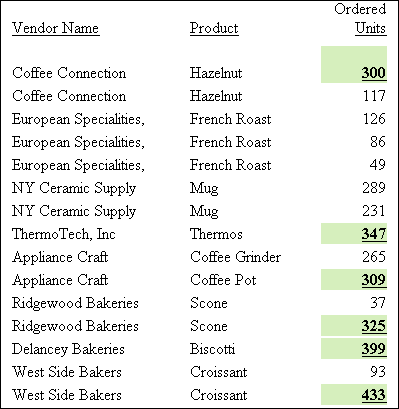
Suppose that you want to highlight
certain values in a report. The following example shows how to create
a report that highlights Gotham Grinds vendors who have ordered
300 or more units.
- Open the GGORDER
data source in Report Painter.
- Double-click
or drag VENDOR_NAME, PRODUCT_DESCRIPTION,
and QUANTITY from the Fields tab of the Object
Inspector into Report Painter.
- Open the Edit
Condition dialog box to create a condition for Ordered Units:
- Right-click Ordered
Units in the Report Painter window and select Options from
the context menu to open the Field Properties dialog box.
- From the Style
tab, click the Edit Conditions button to open
the Condition List dialog box.
- Click New to
open the Edit Condition dialog box.
- Create a condition
and name it ordgt300.
- Type ordgt300 in
the Condition box.
- Click QUANTITY from
the Field list.
- Click Is
greater than or equal to from the Relations list.
- Click the Values button
and select 300 from the Value window.
- Click OK to
return to the Condition List dialog box with the defined condition
displayed.
- Click OK to
return to the Style tab.
- Add a font
style to the condition.
- Click ordgt300 in
the Applying to Condition list box to apply the styling options
to this condition.
- In the Graphical
area of the Style tab, click the Select Font button
to open the Font dialog box.
- Click Bold from
the Font Style list and select the Underline check
box.
- Click OK to
return to the Style tab.
- Add a background
color.
- In the Graphical
area of the Style tab, go to the Background Coloring area and click
the Single Color option button and then the Select
Colors button.
- Select the
color yellow in the Color dialog box. The styles you have applied appear
in the Sample area.
- Click OK to
return to the Report Painter window.
- Run the report
by clicking the Run button on the toolbar.
The
report appears in the browser, as shown in the following image.
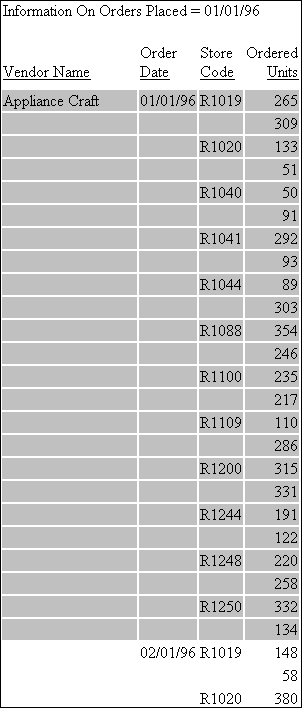
Example: Creating a Condition With Variable Values
Suppose
you want a report that conditionally highlights values. The following
example shows how to create a report of the total number of orders
for each Gotham Grinds store and highlight those orders placed on
a specific day.
- Open the GGORDER
data source in Report Painter.
- Identify your
report columns.
- Identify your
sort columns. Click By on the Report Painter
toolbar. Double-click or drag VENDOR_NAME, ORDER_DATE, and STORE_CODE from
the Fields tab in the Object Inspector.
- Identify your
detail column. Move the insertion point after the Store Code column.
Click Detail on the Report Painter toolbar.
Double-click or drag the QUANTITY from the
Fields tab of the Object Inspector.
- Add a page
heading.
- Position the
cursor in the page heading by clicking your left mouse button in
the heading area and type the following in the heading area:
Information
On Orders Placed On = &date.
- Press the Enter
key to bring your cursor to the next line.
- Open the Edit
Condition dialog box to create a condition for Vendor Name, Order
Date, Store Code, and Ordered
Units.
- Choose Styling from
the Report menu.
- Select Data from
the active object drop-down list.
- Click Edit
Conditions and then click New on
the Edit Condition dialog box to create a new condition.
- Create a condition
and name it rundate.
- Type rundate in
the Condition box.
- Click ORDER_DATE from
the Field list.
- Select Is
equal to from the Relations list.
- Type the variable &date in
the Value box.
- Click OK to
return to the Condition List dialog box.
- Click OK to
return to the Style tab on the Report Options dialog box.
- Add a background
color.
- In the Graphical
area of the Style tab, go to the Background Color group box and
click the Single Color option button and
then the Select Colors button.
- Select the
color Gray-25% in the Color dialog box.
- Click OK to
return to Report Painter.
- Click Run on
the toolbar to run the report. You are prompted for a date.
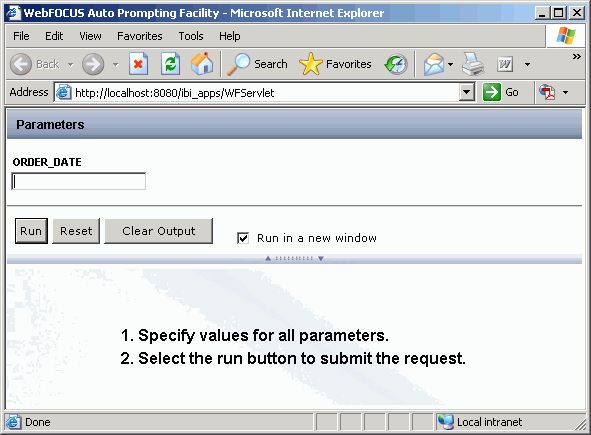
- Type 01/01/96 and
press Enter to run the WebFOCUS query, as shown in the following
image.
xAssociating a Style With a Condition
The following procedures provide information on how
to associate style with a condition.
x
Procedure: How to Associate a Style With a Condition in an Object Area
Before
you begin, review How to Access the Edit Condition Dialog Box for a Column.
-
Select
a defined condition from the Applying to Condition box.
-
Choose
one or a combination of the following:
- Click the Select
Font button to specify conditions, such as font, font
style and size, color and effects.
- Click the Background button
to select a background color.
- Click the Select
Grid button to select a line style (for PDF output formats
only).
- Click the Drill
down tab to embed a procedure. For more information
on drill down, see Creating a Drill Down Procedure.
-
Click OK.
The style is associated with the condition and you return to the
Report Painter window.
x
Procedure: How to Associate a Style With a Condition for a Column
Before
you begin, review How to Access the Edit Condition Dialog Box for a Column.
-
Select
a defined condition from the Applying to Condition dialog box in
the Style tab.
-
In the
Graphical area of the Style tab, choose one or a combination of the
following:
- Click the Select
Font button to specify conditions, such as font, font
style and size, color and effects.
- Click the Select
Grid button to select a line style (for PDF output formats
only).
- Click the Select
Borders button to select a line style.
- In the Background
Coloring area, click the Single Color option
button to select a background color.
-
Click OK.
The style is associated with the condition and you return to the
Report Painter window.
x
Procedure: How to Associate a Style With a Condition for a Report
Before you
begin, review How to Access the Edit Condition Dialog Box for a Report.
-
Select a defined condition from the
Applying to Condition dialog box in the Style tab.
-
In the
Graphical area of the Style tab, choose one or a combination of the
following:
- Click the Select
Font button to specify conditions, such as font, font
style and size, color and effects.
- Click the Select
Borders button to select border styles.
- Click the Select
Grid button to select a line style.
- Click the Visualize button
if you want to select conditional styling criteria for data visualization
bar graphs. For more information, see Visualizing Trends in Reports.
- In the Background
Coloring area, click the Single Color option
button and then the Select Colors button
to select a background color.
-
Click OK.
The style is associated with the condition and you return to the
Report Painter window.
x
Procedure: How to Clear Associated Styling for a Column
Before
you begin, review How to Access the Edit Condition Dialog Box for a Column.
-
Select
a defined condition from the Applying to Condition dialog box in
the Style tab.
-
Click
the Clear Associated Styling button.
Note: If
you change your mind and want to keep the conditional styling, click Cancel on
the Style tab. The condition will appear in the Applying to Condition
dialog box the next time you access Field Properties dialog box.
x
Procedure: How to Clear Associated Styling for a Report
Before
you begin, review How to Access the Edit Condition Dialog Box for a Report.
-
Select
a defined condition from the Applying to Condition dialog box in
the Style tab.
-
Click
the Clear Associated Styling button.
Note: If
you change your mind and want to keep the conditional styling, click Cancel on
the Style tab. The condition will appear in the Applying to Condition
dialog box the next time you access the Report Options dialog box.
x
The following procedures provide information on how
to edit conditions.
Before you begin, review How to Access the Edit Condition Dialog Box for a Column or How to Access the Edit Condition Dialog Box for a Report.
x
Procedure: How to Edit a Condition
-
Select
a condition from the Applying to Condition field
box on the Style tab of the Report Options dialog box.
-
Click
the Edit Conditions button.
The Condition List dialog box opens.
-
Click
the Edit button or double-click the selected
condition.
The Edit Condition dialog box opens.
-
Select
a field name from the Fields window.
-
Select
a relation from the Relations list box.
-
Specify
the value by choosing one of the following:
- Type a literal
value in the Value box.
or
- Click the Values button
to display existing database values and select a value.
or
- Click Another
Field to display other fields in the report and select
a field.
-
Click OK to
return to the Conditional List dialog box.
-
Click OK again
to return to the Style tab in the Report Options dialog box.
Note: After
a condition is changed, all objects that the condition is applied
to will be affected.
x
Procedure: How to Add a Condition to a Column
-
Right-click the column in the Report
Painter window and click Options from
the context menu.
The Field
Properties dialog box opens.
-
Select
a condition from the Applying to Condition field box.
-
Click
the Edit Conditions button.
The Condition List dialog box opens, displaying conditions
for the column or object.
-
Select
a condition from the Condition list box or create a new condition.
-
Click OK.
Note:
- A condition
determines the rule for conditional styling, but not the style. Therefore,
you must define the style.
- A plus sign
(+) appears next to an applied condition that also has styling associated to
it in the Applying to Condition field box.
x
Procedure: How to Add a Condition to a Report
-
Click Styling from
the Report Menu. The Report Options dialog box opens at the Style
tab.
-
Select
a condition from the Applying to Condition field box on the Style tab
of the Report Options dialog box.
-
Click
the Edit Conditions button.
The Condition List dialog box opens, displaying conditions
for the column or object.
-
Select
a condition from the Condition list.
-
Click OK.
Note:
- A condition
determines the rule for conditional styling, but not the style. Therefore,
you must define the style.
- A plus sign
(+) appears next to an applied condition that also has styling associated to
it in the Applying to Condition field box.
x
Procedure: How to Add a Condition to an Object Area
Before you
begin, review How to Access the Edit Condition Dialog Box for a Column.
-
Select
the object area.
-
Highlight
the item you want to style, then right-click and click Grid
Options or Cell Options.
The Properties dialog box opens, displaying conditions
for the column or object.
-
Select
a condition from the Condition list or create a new condition.
-
Click OK.
Note: A
condition determines the rule for conditional styling, but not the
style. Therefore, you must define the style.
x
Procedure: How to Rearrange the Order of Conditions Applied in a Column
-
Right-click the column in the Report
Painter window and click Options from the
context menu.
The Field Properties dialog box opens.
-
Select
a condition from the Applying to Condition field box on the Style tab
of the Report Options dialog box.
-
Click
the Move Condition Up or Move
Condition Down button.
Note: Order
is significant because conditions are applied in the order listed.
For example, if the first and last conditions are both true, the
style in the last condition will override the style in the first.
x
Procedure: How to Rearrange the Order of Conditions Applied in a Report
-
Click Styling from
the Report Menu. The Report Options dialog box opens at the Style
tab.
-
Select
a condition from the Applying to Condition field box on the Style tab
of the Report Options dialog box.
-
Click
the Move Condition Up or Move
Condition Down button.
Note: Order
is significant because conditions are applied in the order listed.
For example, if the first and last conditions are both true, the
style in the last condition will override the style in the first.
x
Procedure: How to Rearrange the Order of Conditions Applied in an Object Area
Before
you begin, review How to Access the Edit Condition Dialog Box for an Object Area.
-
Open
the Properties dialog box for the selected object area by right-clicking
the object area and selecting Grid Options or Cell
Options.
-
Select
a condition from the Applying to Condition box,
then click the Move Condition Up or Move
Condition Down button.
Note: Order
is significant because conditions are applied in the order listed.
For example, if the first and last conditions are both true, the
style in the last condition will override the style in the first.
x
Procedure: How to Delete a Condition From a Column
-
Right-click
the column in the Report Painter window and click Options from
the context menu.
The Field Properties dialog box opens.
-
Select
a condition from the Applying to Condition field box on the Style tab
of the Field Properties dialog box.
-
Click
the Edit Conditions button. The Condition List
dialog box opens.
-
Select
a condition from the Condition list.
-
Click Delete.
(If the condition is in use and you still want to delete it, click Yes when
you are prompted.)
-
Click OK.
You return to the Style tab on the Field Properties dialog box.
Note: These
steps remove the condition from the selected object only. It does
not delete the condition. The condition is still available to be
added to other objects in the report.
x
Procedure: How to Delete a Condition From a Report
-
Click Styling from
the Report Menu. The Report Options dialog box opens at the Style
tab.
-
Select
a condition from the Applying to Condition field box on the Style tab
of the Field Properties dialog box.
-
Click
the Edit Conditions button. The Condition List
dialog box opens.
-
Select
a condition from the Condition list.
-
Click Delete.
(If the condition is in use and you still want to delete it, click Yes when
you are prompted.)
-
Click OK.
You return to the Style tab on the Field Properties dialog box.
Note: These
steps remove the condition from the selected object only. It does
not delete the condition. The condition is still available to be
added to other objects in the report.
x
Procedure: How to Remove a Condition From an Object Area
Before you
begin, review How to Access the Edit Condition Dialog Box for an Object Area.
-
Right-click
the object area, then open the Edit Conditions dialog box.
-
Select
a condition.
-
Click
the Delete button.
-
Click OK.
Note: These
steps remove the condition from the selected object only. It does
not delete the condition. The condition is still available to be
added to other objects in the report.
x
Procedure: How to Copy a Condition From One Column to Another
You
can copy a condition from one column to another.
-
Select
the column(s) that you want to apply styling to by simultaneously
clicking your mouse and pressing the Shift key.
-
Select
the column that contains the styling you want to apply and keep the
Shift key pressed as you click it.
-
Click
the Match Conditional Styling option from the
Match All Styles drop-down list
 ,
and then select the column(s) you want to apply the formatting to.
To copy
all formatting characteristics (including font, grid, background
color, and conditional styling) from one column to another, click
the Match All Styles option.
x
Procedure: How to Conditionally Execute a Drill Down Procedure
-
Right-click
the column in the Report Painter window and click Options from
the context menu.
The Field Properties dialog box opens.
-
Click
the Drill Down tab.
-
Click
the Edit Conditions button.
The Condition List dialog box opens.
-
Click New.
The Edit Condition dialog box opens.
-
Select
a condition from the Condition list box or create a new condition.
-
Click OK to
return to the Drill Down tab.
-
Click OK to
close the Field Properties dialog box and return to Report Painter.


 ,
and then select the column(s) you want to apply the formatting to.