Whether you access legend options from the ribbon or the right-click menu, you are presented with the Format Legend dialog box of options. For instructions on how to open this dialog box, see Using Legend Properties.
The Format Legend dialog box contains options for formatting a legend on a chart. It contains the following tabs:
- Legend Options
- Markers & Labels
- Fill
- Border Styles
- Advanced
Note: The Fill, Border Style, and Shadows tab are not available in InfoAssist Basic.
For instructions on how to open this dialog box, see the procedures in Using Legend Properties.
Use the Legend Options tab to customize the appearance of a legend on a chart. The Legend Options tab is shown in the following image.

The Legend Options tab contains the following options.
- Show Legend. Select this option to show a legend on a chart. Clear this option to suppress a legend on a chart.
-
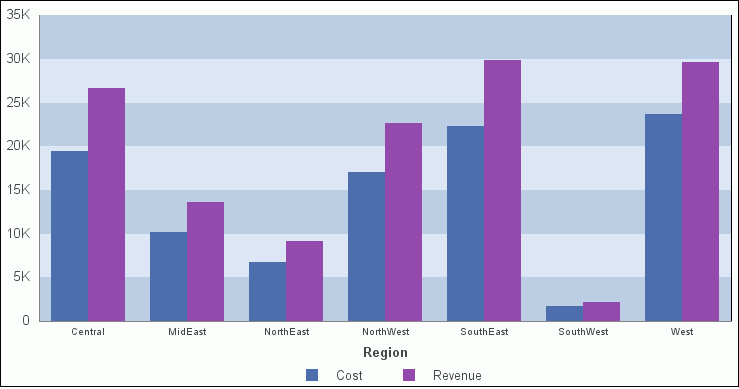
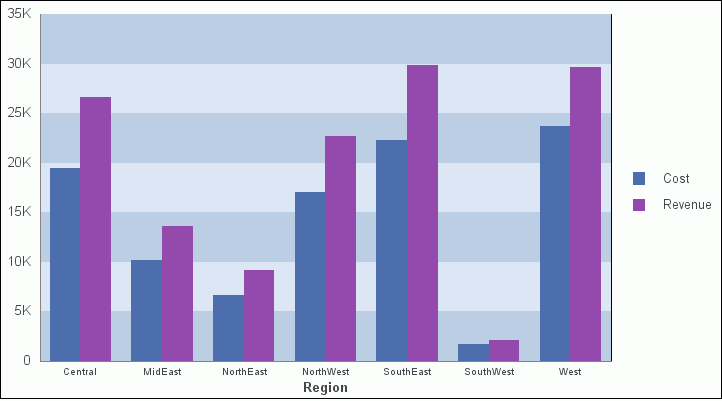
Legend Position. Select
an option from this drop-down menu to position a legend on a chart.
The options are:
- Auto
- Bottom
- Right
- Left
- Top
- Right Top
- Right Bottom
- Left Top
- Left Bottom
- Bottom Left
- Bottom Right
- Top Left
- Top Right
- Free Float
- Legend Orientation. Select an option from this drop-down menu to control the orientation of legend markers in the legend area. The available options are Auto, Horizontal, Vertical.
- Legend Series Start. Use this option to specify the first series to appear in the legend area.
- Reverse Legend Order. Select this option to specify that the legend be drawn in reverse order. Clear this option to specify that the legend be drawn in normal order.
-
Legend Position
- X. Controls the point location of the bottom left corner of the legend.
- Width. Controls the width of the legend.
- Y. Controls the point location of the bottom left corner of the legend.
- Height. Controls the height of the legend.
Use the Markers & Labels tab to customize the appearance of markers and labels on legends. The Markers & Labels tab is shown in the following image.
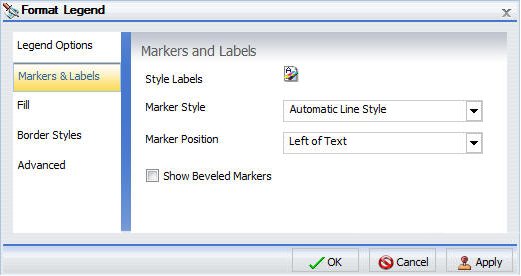
The Markers & Labels tab contains the following options:
- Style Labels. Click this button to open the Style dialog box, where you can style text.
-
Marker Style. Select
an option from this drop-down menu to edit the line style in the
legend. The options are:
- Markers Only
- Line Style Only
- Markers and Line Style
- Automatic Line Style
-
Marker Position. Select
an option from this drop-down menu to set the position of text relative
to the legend marker. The options are:
- Left of Text
- Right of Text
- Above Text
- Below Text
- On Text
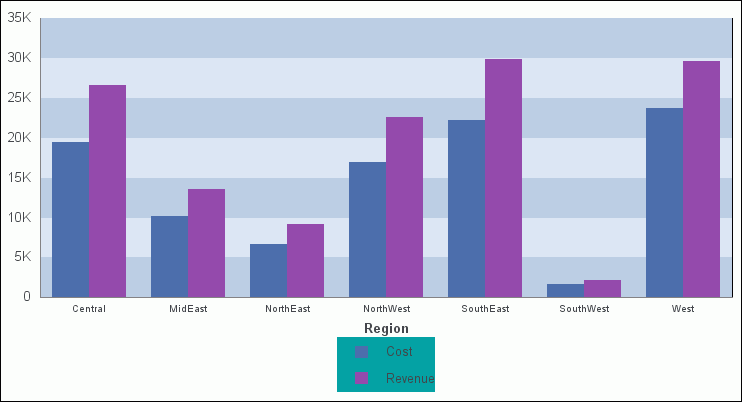
- Show Beveled Markers. Select this option to show beveled markers. Clear this option to suppress beveled markers.
Use the Fill tab to modify the color of the legend area. For more information, see Format Series Dialog Box.
Use the Border Styles tab to place a border around a legend. For more information, see Format Series Dialog Box.
The Border Styles tab contains the following options:
- Show Border. Select this option to place a border around a legend.
- Color. With the Show Border option selected, you can click this button to open the Color dialog box, where you can select a color for the border.
Use the Advanced tab to use square markers and marker shapes on a legend. The Advanced tab is shown in the following image.
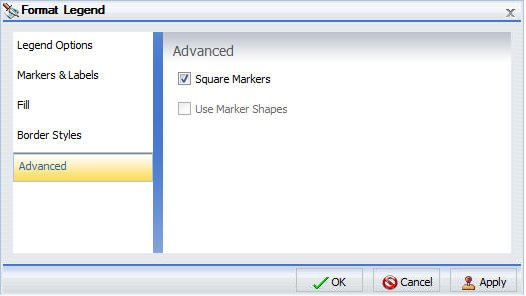
The Advanced tab contains the following options:
- Square Markers. Select this option to display square markers on a legend.
- Use Marker Shapes. Select this option to display marker shapes on a legend.