In this section: |
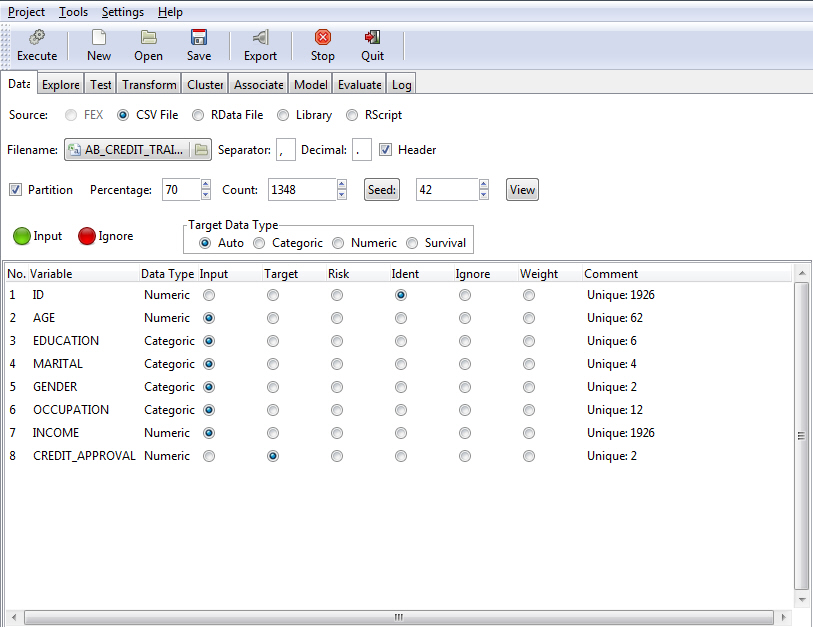
When the RStat tool opens for a new model to be built or modified, it appears as shown in the following image. Note that the data from the procedure (FEX) developed in Report Painter or the Report canvas is loaded into RStat and is ready for modeling. You can also open RStat without any data loaded (see Creating a Scoring Application for more information).
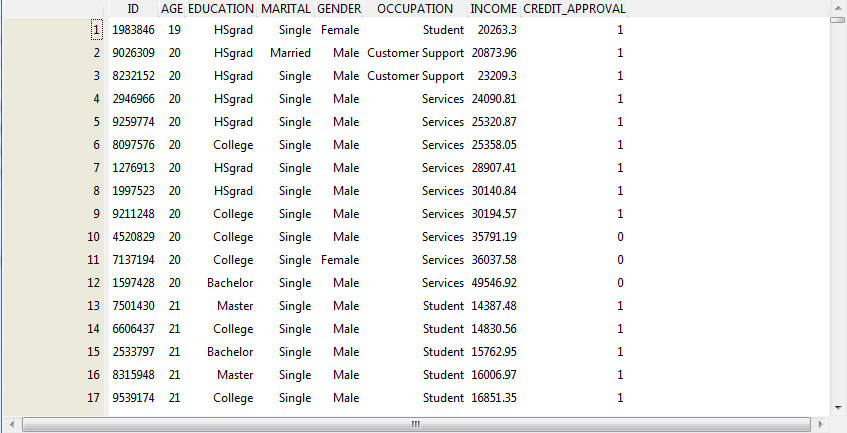
The first tab of RStat, the Data tab, displays the variables from a CSV file that are loaded into RStat.
The main display features of RStat are described in the following table.
|
Display Feature |
Description |
|---|---|
|
Menu Bar |
Displays the RStat menus, such as Project, Tools, Settings, and Help. |
|
Action Toolbar |
Displays the actions available in RStat, such as Execute, New, Open, Save, Export, Stop, and Quit. |
|
Data Tab |
Displays the options to load a data set. For more information, see Data Source Selection. |
|
Explore Tab |
Displays the options to explore the data to identify how it is distributed. For more information, see Data Exploration. |
|
Test Tab |
Displays the options for hypothesis testing, including Distribution Test (Kolmogorov-Smirnov and Wilcoxon Signed Rank Test), Location & Variance Test (Wilcoxon Rank Sum, T test, and F test), and Correlation Test (Chi-SQ Test). For more information, see Hypothesis Testing. |
|
Transform Tab |
Displays the options to transform the data in various ways. For more information, see Data Transformation. |
|
Cluster Tab |
Displays the options to build clusters for data sets. |
|
Associate Tab |
Displays the options to create association rules for the data. |
|
Model Tab |
Displays the options to build predictive models. |
|
Evaluate Tab |
Displays the options to evaluate the models. |
|
Log Tab |
The corresponding R Code appears in the Log tab. This enables you to review the R commands that perform the corresponding data mining tasks. |
|
Status Bar |
Indicates when an action is completed. |
The following options are available on the Data tab in RStat. You may also access the Data tab through the Tools menu.
Source
Different options may be available depending on the data type.
Partition
Partitioning splits the single data set into two data sets, a training data set used for analysis and modeling, and a test data set used to evaluate how well a model performs. It is a common practice to test models on new data, different from the data used to create the model.
You can define the partition size either as a percentage of the total records or as an exact number of records. Changing the percentage will automatically change the count and vice versa.
You can set a group of variables to a single role using the Input and Ignore buttons by:
The data type of the target variable determines the type of modeling available and the specific algorithms that will be used within the modeling process. The data type is defined based on the type of data RStat identifies and the quantity of unique values found in the actual data. In RStat, data types are defined as:
The Target option allows you to override these heuristic settings:
| WebFOCUS |