The Test tab allows you to do hypothesis testing and correlation analysis. RStat supports two types of statistical inferences, estimation and hypothesis testing.
Use Case for Hypothesis Testing
Analysts may want to determine if a marketing campaign is successful. They design a test group, which receives an offer, and a control group, which does not. The spending of both groups is tracked in the database. The hypothesis test will determine if the two groups differ significantly in their spending patterns.
Why test? In this example, analysts want to find out if the test group spends more. If the test group spends the same as the control group, they will assume that the campaign is not successful. Rarely are the expenditures of the two groups identical, so the question arises, how different must the expenditures be in order to determine if the campaign has an effect? The test statistics indicate whether the differences are statistically significant.
An image of the Test tab follows. Samples for testing can be selected in one of two ways.
Note: This method cannot be used for the Correlation and Wilcoxon Signed-Rank tests. Those options will be grayed out until the user selects the option below.
Note: The drop-down boxes can contain only numeric variables.
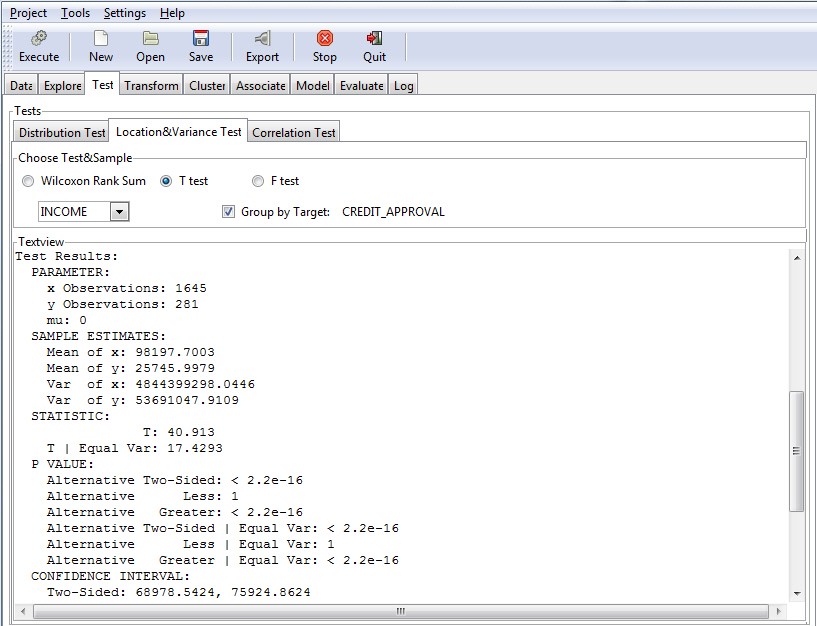
The following image shows an example of using a T test to identify two samples, people who have been approved for credit and those who have not, and whether their income differs significantly between the two groups.
The Test tab, which contains the various tests supported by RStat, is divided into three tabs: Distribution Test, Location&Variance Test, and Correlation Test, as shown in the following image.
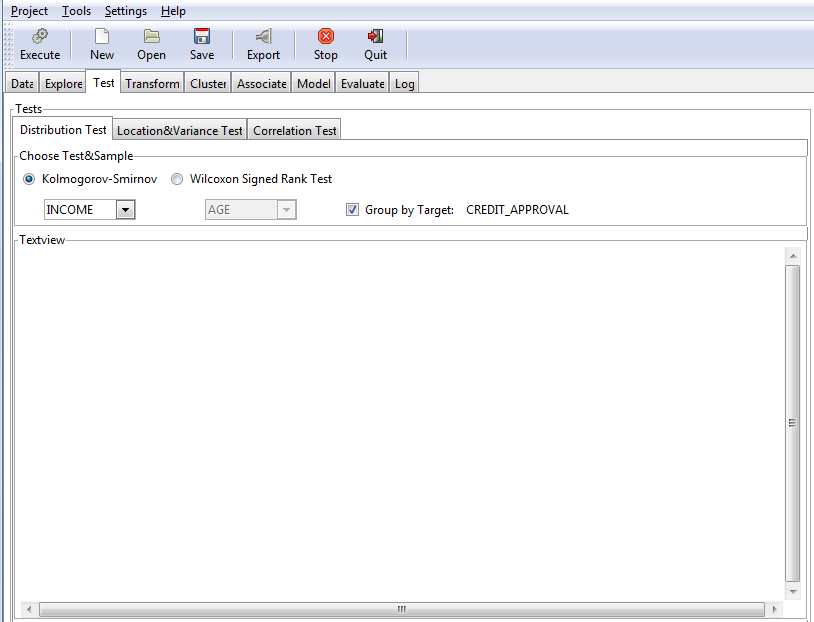
These tabs organize the different tests into logical categories. This section reviews these tests, and introduces the Chi-SQ GUI.
The types of tests include:
Distribution Test. These non-parametric tests make no assumptions that the underlying distribution is normal. They are suitable for many types of data that do not follow the normal distribution, for example, ranked and cross-tabulated data.
Location&Variance Test. These tests are used to determine if there is a shift of the distribution. The non-parametric test (Wilcoxon Rank Sum) makes no assumptions that the underlying distribution is normal. They are suitable for many types of data that do not follow the normal distribution, for example, ranked and cross-tabulated data. The parametric tests (T test and F test) make strong assumptions that the underlying distribution is normal, for example, having a bell-shaped curve.
Correlation Test. Determines if there is a linear relationship between two variables. It also measures the strength and direction of the relationship. Correlation analysis does not test whether two samples are different. Only the Pearson correlation test is performed in the Test tab.
The Pearson Chi-Squared test is a statistical test that is applied to categorical data, which is organized in sets. The test evaluates the likelihood that any observed difference arose between the sets by chance.
Note: To activate the Chi-SQ GUI, access the Correlation Test tab on the Test tab and click Execute. The Textview pane displays the results of your test.
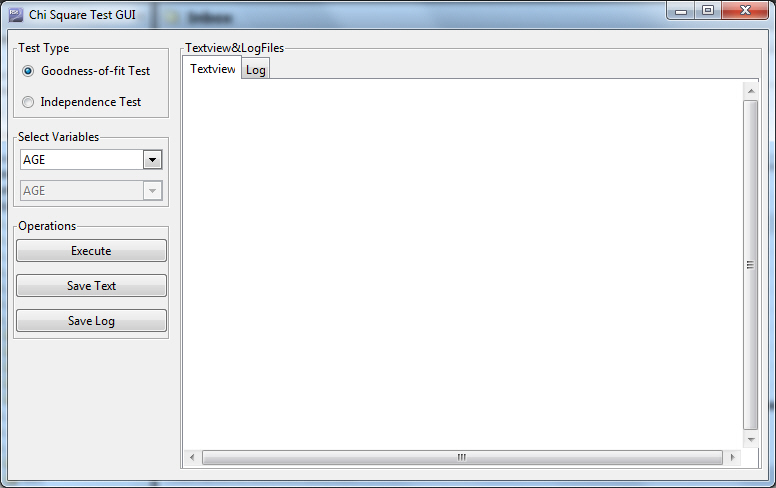
Once you make a selection for Goodness-of-fit Test or Independence Test, the relevant variable drop-down lists are activated.
Test Type. Allows you to select a test type (Goodness-of-fit Test or Independence Test). The Goodness-of-fit Test is selected, by default.
Select Variables. Depending on the test type with which you are working, you can select one variable (Goodness-of-fit) or two variables (Independence Test). The list of available variables is based on the data set you are using.
Operations. These are the functions that you can perform based on your test type and variable selections.
| WebFOCUS |