yaxis:
{
  colorScale: {
    colors: ['color1', 'color2', ..., 'colorn']
  }
},
where:
- ['color1', ...,'colorn']
Is an array of colors defined by a color name or numeric specification string. The default value is: ['#253494', '#2C7FB8', '#41B6C4', '#A1DAB4'].
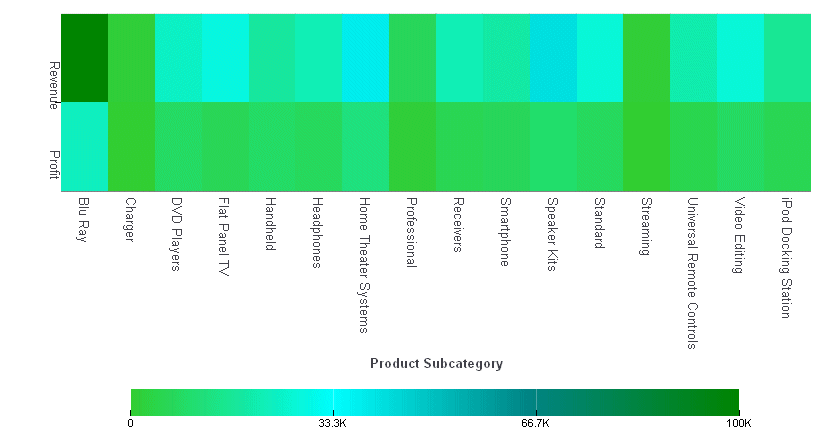
The following request generates a heatmap chart with a color scale consisting of the colors lime green, cyan, teal, and green:
GRAPH FILE WF_RETAIL_LITE
SUM  REVENUE_US AS 'Revenue'
        GROSS_PROFIT_US AS 'Profit'
BY PRODUCT_SUBCATEG
ON GRAPH PCHOLD FORMAT JSCHART
ON GRAPH SET LOOKGRAPH SPECTRAL
ON GRAPH SET STYLE *
*GRAPH_JS
yaxis: {colorScale: {colors: ['limegreen','cyan', 'teal', 'green'] }}
*END
INCLUDE=ENIADefault_combine.sty,$
ENDSTYLE
END
The output is:

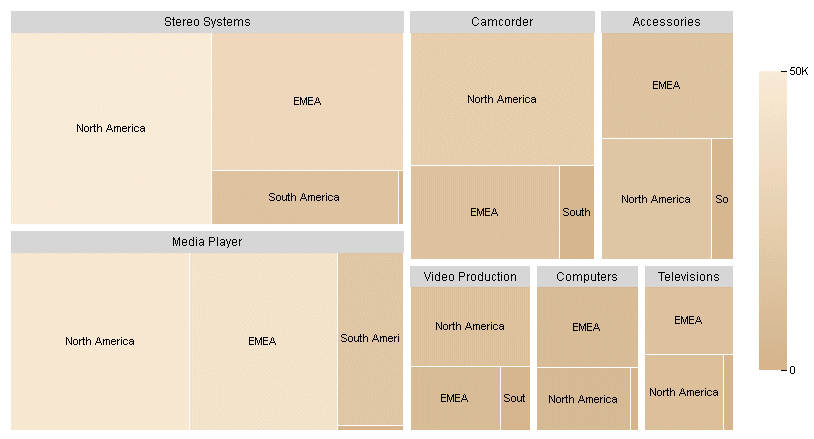
The following request generates a treemap chart with a color scale consisting of the colors tan and antique white:
GRAPH FILE WF_RETAIL_LITE
SUM GROSS_PROFIT_US COGS_US
BY PRODUCT_CATEGORY
BY BUSINESS_REGION
ON GRAPH PCHOLD FORMAT JSCHART
ON GRAPH SET LOOKGRAPH TREEMAP
ON GRAPH SET STYLE *
*GRAPH_JS
legend: {visible:true},
yaxis: {mode: 'color', colorScale: {colors: ['tan','antiquewhite']}}
*END
ENDSTYLE
END
The output is:
