In this section: |
When Report Painter opens for a new report, it appears as shown in the following image.
The main elements of Report Painter are described in the following table.
|
Display Feature |
Definition |
|---|---|
|
Menu Bar |
Displays pull-down menus for Report Painter. |
|
Developer Studio Main Toolbar |
Displays tool buttons and operational buttons, such as Open and Run with Message Viewer. For more information about the Main Toolbar, see the Developer Studio Application Development Getting Started manual. |
|
Report Painter Toolbars |
For a list of all Report Painter toolbars and their functions, see Report Painter Toolbars. |
|
Object Inspector |
Allows a user to add fields to a report, create sort groups, and view column, report, and image properties. For more information, see Using the Object Inspector. |
|
Insert Mode Symbol |
The insert symbol is a large letter I, which indicates that you can add a field in the report window. The following example shows the insert symbol between two fields in the Report Painter window.
|
|
Report Painter Window |
Displays the fields that are included in the report. This window is a representation of the printed report page. The Report Painter window contains four different view modes, accessible by tabs on the bottom-left hand side of Report Painter: Report, Source, Images, and Matrix (when using a For column to access the Financial Report Painter).
|
How to: Reference: |
Report Painter contains built-in docked toolbars that you can show, hide, or move as needed. By default, most of the toolbars are docked in Report Painter. These docked toolbars can be moved from their original position, where they become floating toolbars and can be placed anywhere on your Report Painter window. The docked toolbar locks in place when you drag it to the top or bottom edge of the Report Painter window.
A check mark next to the toolbar indicates it appears in the Report Painter window.
Tip: To quickly hide a floating toolbar, click the Close button in the upper-right hand corner of the toolbar.
Drag the move handle on a docked toolbar, or drag the title bar on a floating toolbar to another location. If you drag the toolbar to the bottom edge of the Report Painter window, it will snap in place and become a docked toolbar.
The Columns toolbar contains buttons that are primarily used to perform functions on the selected columns. Depending upon your selection, certain toolbar buttons may be inactive or unavailable.
|
Button |
Definition |
|---|---|
|
|
Displays the individual values of the selected fields when the report is executed. This button is selected by default when you open Report Painter. |
|
|
Provides a total of all values for the selected numeric field when the report is executed. |
|
|
Vertically sorts and groups data in a report by the values in the selected field. You can sort a report by more than one field. |
|
|
Sorts and formats a hierarchy with appropriate indentations that clearly show the parent and child relationships in a hierarchy. You can have multiple hierarchy sort fields in a report. Note: This option is only available when using a multi-dimensional data source. For more information, see Sorting Hierarchical Data in the Creating Reporting Applications With Developer Studio manual. |
|
|
Horizontally sorts and groups data in a report by the values in the selected field. You can sort a report by more than one field. |
|
|
Enables you to structure financial reports row-by-row in the Financial Report Painter, based on the selected For field. , see the Creating Financial Reports manual. |
|
|
Allows you to select Where, If, Where Total, and Retrieval Limits. If Where, If, or Where Total is selected, the Expression Builder opens. If Retrieval Limits is selected, the Retrieval Limits dialog box opens. |
|
|
Opens the Forecast dialog box in which you can add a Forecast column to the report. This feature calculates trends in numeric data and predicts values beyond the range of values stored in the data source. For details about creating temporary fields in reports, see Calculating Trends and Predicting Values With Forecast . |
|
|
Used with Guided Reports. Generates a parameter group from the selected column or columns. |
|
|
Enables you to select a guided report variable mode.
|
|
|
Removes a column or columns from the parameter group. The columns selected must be part of a parameter group to use this button. |
The Headings and Footings toolbar contains buttons that are used to add headings and footings to the report. You may also add Subtotals and Totals to columns in the report. Depending upon your selection, certain toolbar buttons may be inactive or unavailable.
|
Button |
Definition |
|---|---|
|
|
Enables you to enter a report heading for the report. A report heading is text that appears above the page heading at the top of the first page in a report. |
|
|
Enables you to enter a page heading in the report. A page heading is text that appears at the top of every page in a report. |
|
|
Enables you to enter a page footing in the report. A page footing is text that appears at the bottom of every page in a report. |
|
|
Enables you to enter a report footing for the report. A report footing is text that appears below the page footing at the bottom of the last page in a report. |
|
|
Enables you to enter a subheading in the report. The subheading appears each time the selected sort (By) field changes. It is placed before the new value. |
|
|
Displays a subtotal for numeric data whenever the value of the selected sort (By) field changes. |
|
|
Displays a total to all numeric columns and rows in the Report Painter window. If a column or row total already exists, clicking Total adds the total type that is missing. If both a column and row total already exist, the Totals option is unavailable. |
|
|
Enables you to enter a subfooting in the report. The subfooting appears each time the selected sort (By) field changes. It is placed after the new value. |
The Prefix toolbar provides a drop-down menu of prefix operators that you can apply to a field. Clicking the down arrow enables you to switch prefix operators for the selected field.
Tip: The list of available operators adjusts to show those that are appropriate for the type of field you select. For example, the following image shows the prefix operators for a Detail field.
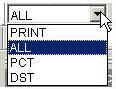
For more information about prefix operators, see Operations You Can Perform on Fields.
The Output Format toolbar enables you to select a styled report format directly from the Output Format toolbar. A complete list of styled, unstyled, and database report formats are available from the Report Options dialog box.
|
Button |
Definition |
|---|---|
|
|
Enables you to select a styled report format from the Output Format drop-down list. Note: For other available report formats, open the Report Options dialog box and select the desired output format. If you are opening a report that was created using the Document Composer tool, the output format cannot be changed. |
|
|
Opens the Report Options dialog box, from which you can change the properties of your report, apply formatting, add images, calculate values, apply selection criteria, and so on. |
The Zoom toolbar specifies the size (magnification or scale) of the Report Painter window. The Zoom toolbar is off by default.
|
Button |
Definition |
|---|---|
|
|
Specifies the size (magnification or scale) of the Report Painter window. Options are 100%, 75%, 50%, or 25%. The default value is 100%. |
The General toolbar contains buttons that provide quick access to commonly performed functions. The behavior of the button is determined either by the selected object or the previously performed command or action. Therefore, depending upon your location in Report Painter or previously performed actions, certain toolbar buttons may be inactive.
|
Button |
Definition |
|---|---|
|
|
Saves the entire report procedure to disk. |
|
|
Executes the report. |
|
|
Removes the selected item and places it on the clipboard. |
|
|
Copies the selected item to the clipboard. |
|
|
Inserts the content of the clipboard at the insertion point or replaces a selected item. |
|
|
Deletes the selected item from the report. |
|
|
Undoes the last command or action. This restores the report to the properties that existed prior to the last command or action. |
|
|
If the last command or action was undone (using the Undo button), this performs the last command or action again. |
|
|
Toggles between displaying or hiding invisible fields in the body of the report. |
|
|
Toggles between displaying or hiding the Object Inspector. |
|
|
Converts the report to a Precision report. For more information, see Creating Precision Reports. |
|
|
Promotes the report to a Compound Document. The original report remains unchanged while a copy of that report is placed on the Document canvas, in the Document Composer. For more information see the Creating Compound Reports With Document Composer manual. |
The Font toolbar contains buttons that are primarily used to apply styling to a selected item.
|
Button |
Definition |
|---|---|
|
|
Applies styling only to the title component of the column. |
|
|
Applies styling only to the data component of the column. |
|
|
Applies styling to the entire column, both title and data. |
|
|
Changes the font type of the selected item. |
|
|
Changes the font size of the selected item. |
|
|
Increases the font size of the column object by one point. |
|
|
Decreases the font size of the column object by one point. |
|
|
Applies the bold style to the selected object. |
|
|
Applies the italic style to the selected object. |
|
|
Applies the underline style to the selected object. |
|
|
Applies the WebFOCUS language underline command to the selected object. |
|
|
Applies left justification to the selected object. |
|
|
Applies center justification to the selected object. |
|
|
Applies right justification to the selected object. |
|
|
Returns the default justification to the selected object. |
|
|
Enables you to change font color. |
|
|
The Match All Styles button has a drop-down list with options that are primarily used to copy format characteristics from one column and apply the characteristics to another column. To activate the button, you must multi-select two or more columns. When you click one of the options from the drop-down list, Report Painter copies the style from the first column selected and applies the style to all other selected columns. Depending upon your selection, certain toolbar buttons may be inactive or unavailable. The styling options are: Match All Styles, Match Font, Match Grid/Border, Match Background Color, Match Conditional Styling, Match Justification, Match Width Attributes. |
|
|
Opens the StyleSheet Selection dialog box, which enables you to reference or embed an external StyleSheet, use the default WebFOCUS StyleSheet, or apply no styling to your report. For more information, see Using the StyleSheet File Selector. |
The Setup toolbar contains buttons that are used to launch other graphical tools whose functionality may be needed before the report is complete, such as Define, Join, and Set.
|
Button |
Definition |
|---|---|
|
|
Launches the Define tool. The Define tool enables you to create a virtual field as a component in a reporting procedure. A virtual field is evaluated on each retrieved record that passes any selection criteria on the real fields. Define the virtual field by assigning a format and typing an expression or composing it using the calculator and the fields and functions listed in the tabbed panes in the Define tool window. The result of the expression is treated as though it were a real field stored in the data source. For details about creating temporary fields in reports, see Creating Temporary Fields in the Creating Reporting Applications With Developer Studio manual. |
|
|
Opens the Report Options dialog box at the Computes tab, enabling you to create a calculated value. For more information, see Creating Temporary Fields With Report Painter. |
|
|
Launches the Join tool. If a report requires data from two or more related data sources, you can temporarily join the files and report from them as if they were one. Joined files remain physically separate, but are treated as one data source structure. The Join tool provides a graphical method for creating and manipulating all types of Joins. You must specify a host file, then a cross-referenced file to create a join. Note: Joins are not supported for cube data sources and therefore, the Join icon is unavailable. For instructions on creating joins, see Joining and Merging Data Sources in the Creating Reporting Applications With Developer Studio manual. |
|
|
Opens the Universal Concatenation dialog box, enabling you to retrieve data from unlike data sources in a single request. For more information, see Universal Concatenation in Report Painter. |
|
|
Launches the Dimension Builder tool. The Dimension Builder tool allows you to create a temporary OLAP hierarchy and dimensions. Unlike the Synonym Editor, this tool does not modify the Master File. For instructions on creating dimensions, see Analyzing Data in an OLAP Report in the Online Analytical Processing (OLAP) manual. |
|
|
Launches the Set tool. The Set tool enables you to customize procedure development. It controls the way that reports and graphs appear on the screen or printer, the content of reports and graphs, data retrieval characteristics that affect performance, and system responses to user requests. It also helps you set up your metadata and manipulate information, such as dates. For a list of SET commands, see Customizing Your Environment in the Developing Reporting Applications manual. |
Tip: You can also launch these tools by selecting the Setup tab in the Object Inspector and double-clicking a component. If you right-click a component in the Object Inspector, you also have options to edit, insert, delete, or add a component.
| WebFOCUS |