In this section: |
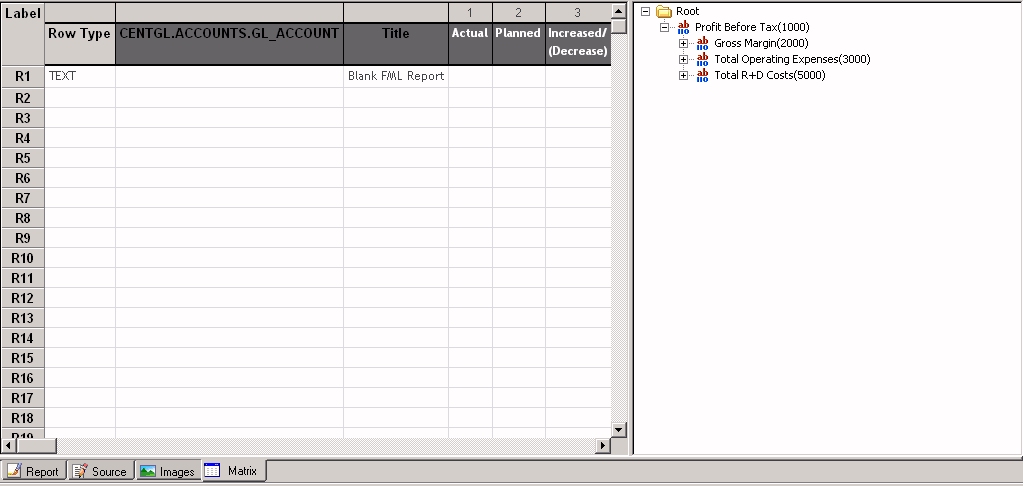
The For field, GL_ACCOUNT, is the only column listed in your report. You will be adding other columns to this report in the Financial Report Painter.
Initially, the hierarchy is collapsed in the For field values panel. You will expand various sections of the hierarchy as you begin to populate the rows of the matrix.
![]()
In the rest of this exercise, you will match revenue and expenses in the income statement, first showing all the revenue earned and then deducting from the revenue all the expenses (the costs of doing business) that you incurred in producing that revenue.
Your first task is to add three new columns to the report.
You will calculate all three columns from the Computes tab of the Report Options dialog box, which you can access directly from the Financial Report Painter.
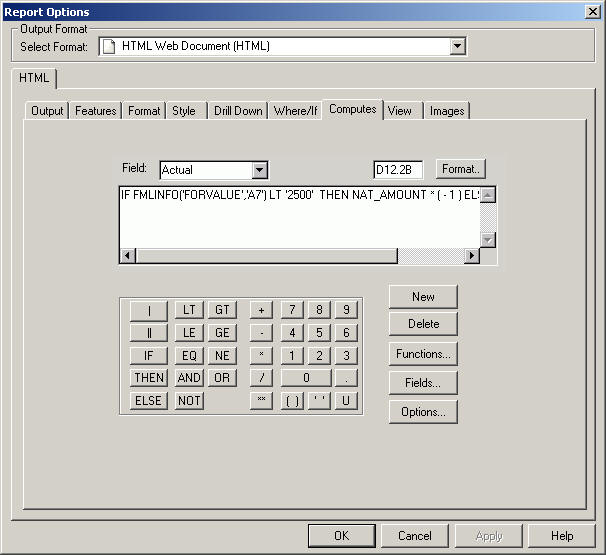
The Report Options dialog box opens at the Computes tab.
You will now create an expression that calculates Actual as a new field in which negative revenue values are converted to positive values.
IF FMLINFO('FORVALUE','A7') LT '2500' THEN NAT_AMOUNT * ( - 1 ) ELSE NAT_AMOUNTTip: You must type the following part of the expression:
FMLINFO('FORVALUE','A7') where:
Is the General Ledger account, in this case, GL_ACCOUNT, that you are using as the For field in the report.
Is the format of that field, as defined in the Master File.
Note that the FMLINFO function is only available to calculate values from the Compute tab and is not included on the generic list of functions that you access from the Functions button.
Before you repeat this process for Planned, reflect on what FMLINFO does. For accounts less than 2500, FMLINFO multiplies the Actual value by -1, thereby converting the negative value into a positive value for those accounts.
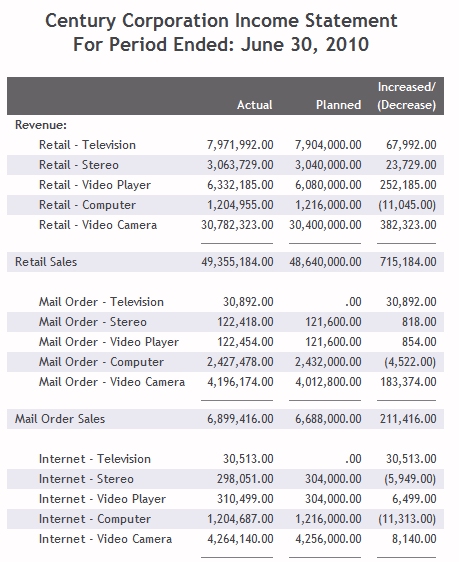
You will see that accounts 2100 through 2450 comprise the Revenue accounts in the hierarchy. Accounts 1000 (Profit Before Tax) and 2000 (Gross Margin) are "net" calculations based on the revenue accounts and, therefore, subject to the same sign conventions. Without the adjustment provided by FMLINFO, all of these accounts would generate negative numbers in the Actual and Planned columns, as illustrated in Displaying Revenues and Expenses Without Adjusting Positive and Negative Values.
So, you need to understand the structure of the accounts hierarchy with which you are working to apply the FMLINFO calculation to the correct accounts.
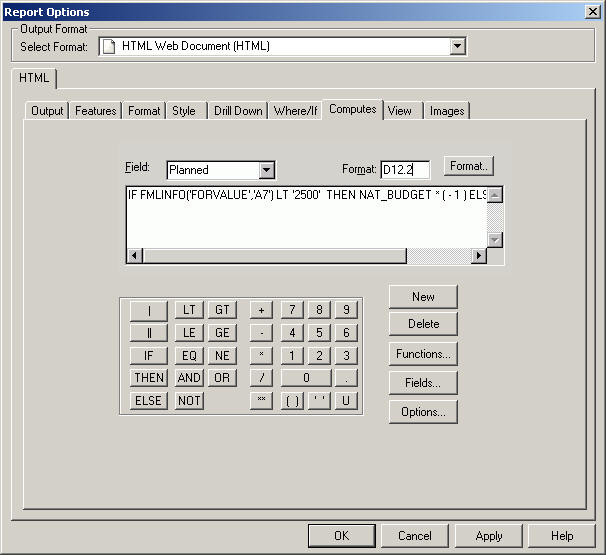
The Computes tab shows your previous expression. Since you will need to use a nearly identical expression to generate the Planned field, select the entire expression and press Ctrl + C (Copy).
Name the field Planned in the Fields box. Accept the default field format, D12.2.
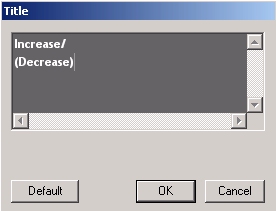
Create the third column, Variance, and rename it Increase/(Decrease).
The Title dialog box opens.
Increase/
(Decrease)
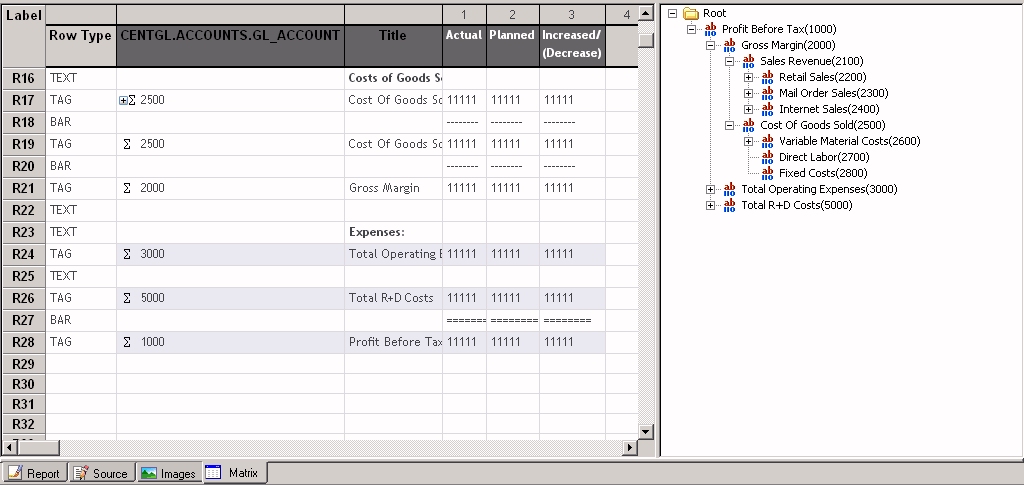
The matrix includes the three calculated columns and appears as follows:
Tip: If you would like to add these formatting touches, you can right-click Increase/Decrease and select Options. The Field Properties dialog box will open at the Style tab. Then follow the instructions beginning with step 11 from Create the Base Report in Report Painter. When you are done, you will return to the Financial Report Painter.
You have finished structuring the columns in the report and will start adding rows to the matrix.
Complete the Revenue section of the income statement.
The TEXT dialog box opens.
Revenue:
Revenue appears in the Title column on the matrix.
The Field Properties dialog box opens at the Style tab.
The Font dialog box opens.
Row R1 is identified as a TEXT row type, and Revenue is bold.
You are now going to begin to add data values from the Chart of Accounts. The first step is expanding a section of the hierarchy to expose the levels of values.
Tip: Some of these steps will seem very similar to those in the previous tutorial. Be on the alert for places where they are different. Remember that you will be explicitly consolidating data that was pre-consolidated in the data mart.
Notice that TAG is entered in the Row Type column.
The TAG dialog box opens.
Notice that Display children's caption is checked by default.
These selections indicate that you want to see values for the children of Retail Sales, (Retail - Television, Retail - Stereo, and so on), but not the value of Retail Sales itself.
In addition, the captions (descriptive titles) for the children will appear in the output in place of their tag values.
Notice that a plus (+) sign precedes 2200, indicating that it contains subordinate values that you can expand if you wish.
The BAR dialog box opens.
This will roll up the data for the children of Retail Sales and display the total in a single row.
Tip: In the data mart tutorial, you selected Show selected item at this point, since the data you were using was pre-consolidated.
You are going to repeat this process for Mail Order Sales and Internet Sales.
The TAG dialog box opens.
The TAG dialog box opens.
The TAG dialog box opens.
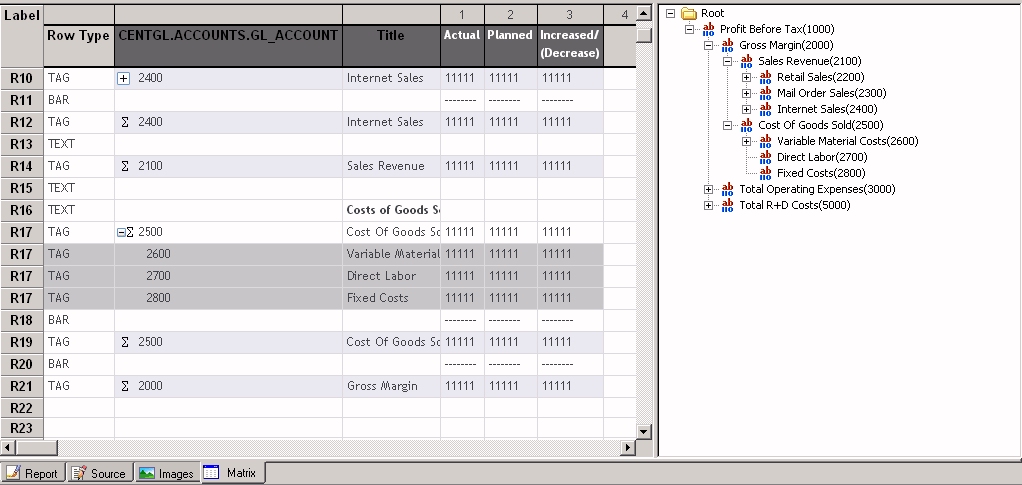
The Financial Report Painter appears as follows.
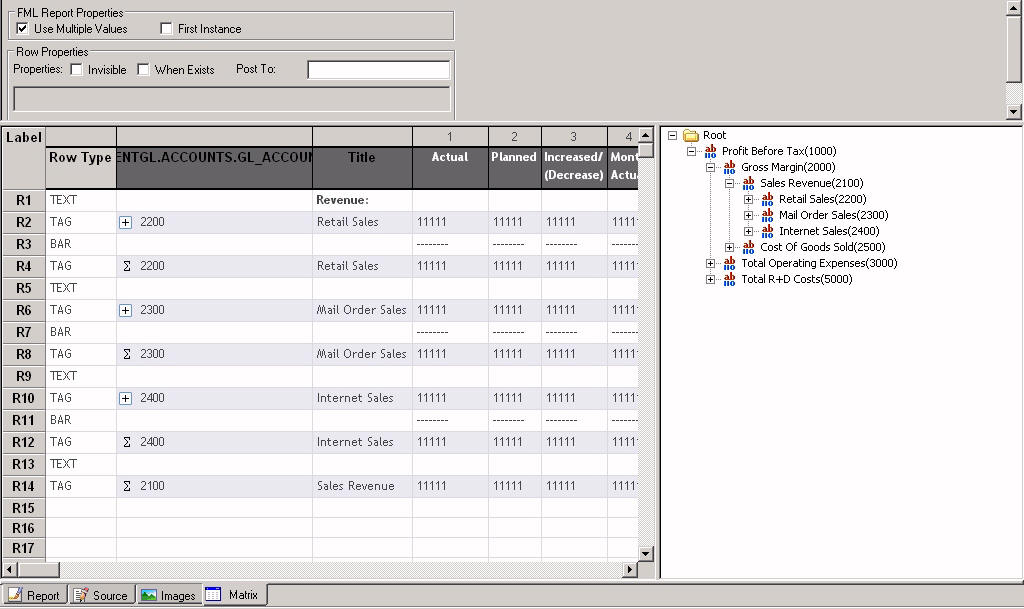
The plus signs (+) indicate the presence of children, which you can expose if you wish.
The sigma signs indicate consolidated data.
You have completed the Revenue section of the income statement.
Notice that revenues are represented as positive values in both the Actual and Planned columns.
Your next task is to add rows for Cost of Goods Sold and Gross Margin.
You are now going to add a row for Cost of Goods Sold and one for Gross Margin, which subtracts total Cost of Goods Sold from total Revenues.
Cost of Goods Sold:
The Field Properties dialog box opens at the Style tab.
The Font dialog box opens.
Notice that Variable Material Costs, one of the children of Cost of Goods Sold, has children of its own.
The TAG dialog box opens.
This indicates that you want to display only one level of the hierarchy. The children of Variable Material Costs will not be shown.
This ensures that although the children of Variable Material Costs will not be explicitly broken out in the report, the value on the Variable Material Costs line will reflect a roll up of the values of the children.
The TAG dialog box opens.
This will consolidate the Cost of Goods Sold data for all children (including those of Variable Material Costs) in a single row.
The TAG dialog box opens.
The matrix looks like the following image.
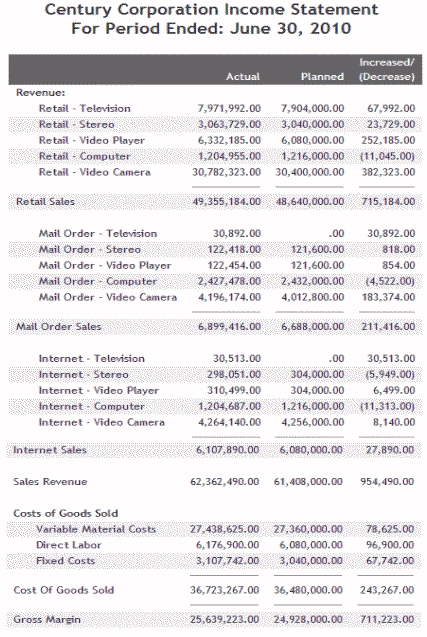
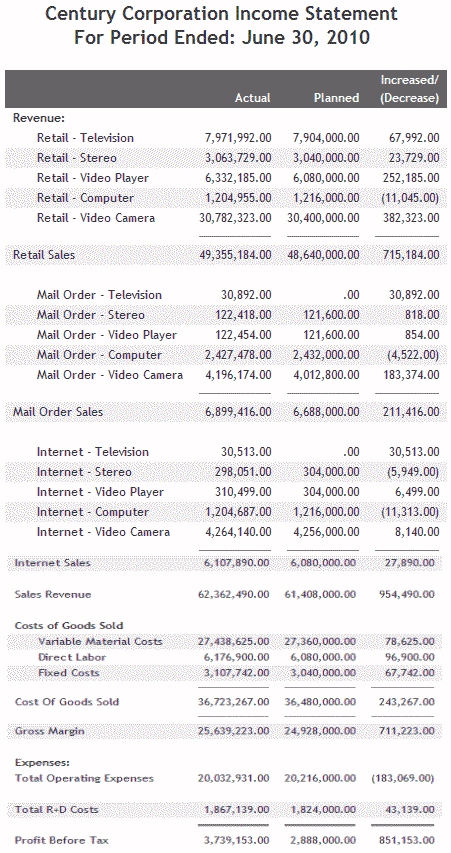
Notice that Century Corp has exceeded expectations in terms of keeping costs down and can report a healthy Gross Margin for the reporting period.
The last section of the income statement defines the expenses of Century Corp during this period and calculates profit before taxes (Profit= Gross Margin - Expenses).
Expenses:
The Field Properties dialog box opens at the Style tab.
The Font dialog box opens.
The TAG dialog box opens.
Profit will be calculated based on total expenses so you need to display consolidated data for each expense category.
The TAG dialog box opens.
Create a Bar in row R27, but this time select ===== in the BAR dialog box.
The TAG dialog box opens.
The lower section of the matrix looks like the following image.
The consolidated Century Corporation Income Statement shows an Actual Profit that significantly exceeds expectations.
| WebFOCUS |