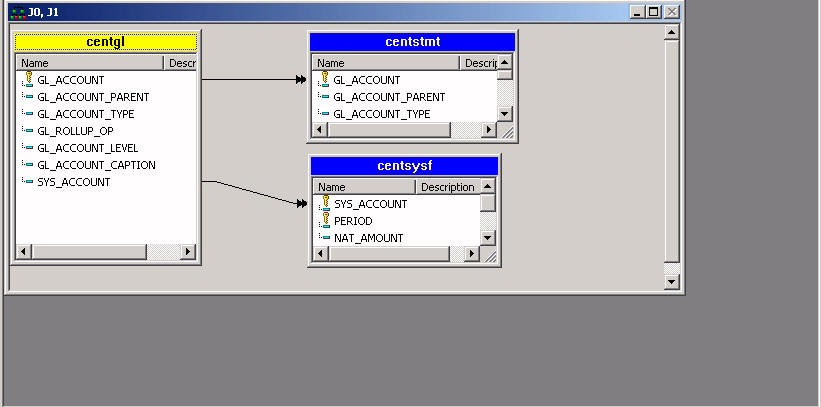
Notice that the data sources are automatically joined at their respective GL_ACCOUNT and SYS_ACCOUNT fields. (If you do not see the join arrow, resize each window.)
In this section: |
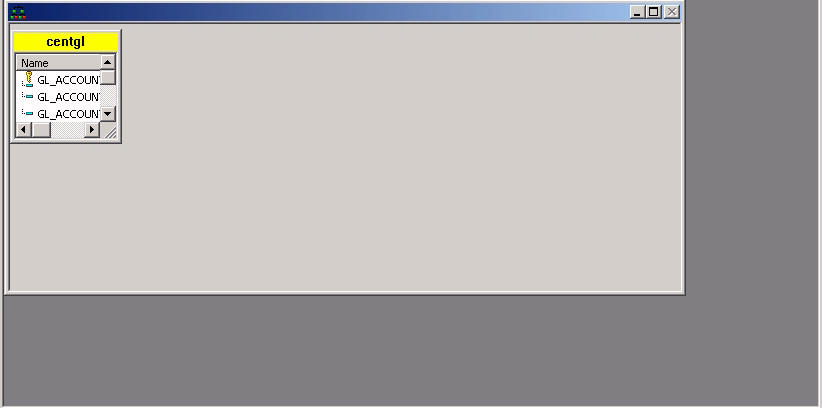
Join CENTGL, CENTSTMT, and CENTSYSF to make all of their fields available for reporting.
You must specify the chart of accounts as the first file to be joined. (This is sometimes referred to as the host file.)
Notice that the data sources are automatically joined at their respective GL_ACCOUNT and SYS_ACCOUNT fields. (If you do not see the join arrow, resize each window.)
Before you start to create the report, examine the data you will be using, along with some accounting concepts that will influence your work. Proceed to Data Detour: Working With Positive and Negative Values in Financial Data.
The CENTSYSF Master File, which you joined to CENTGL (described in Join the Data Sources), describes account transactions that contains unconsolidated detail-level financial data.
In most General Ledger systems, data is maintained internally as follows:
CENTSYSF.FOC (the data source described by CENTSYSF. MAS) complies with these conventions. Therefore, if you were to report directly against this raw data, you would see the negative values for revenue accounts in your report, as illustrated in the example Displaying Revenues and Expenses Without Adjusting Positive and Negative Values.
This is contrary to the expectations of accountants and other financial analysts since expenses are generally thought of as negative values (money going out) and revenues as positive values (money coming in).
In this exercise, you will learn a simple technique that uses a function called FMLINFO, which converts data to conform to user expectations in the report output, while complying with internal General Ledger system conventions.
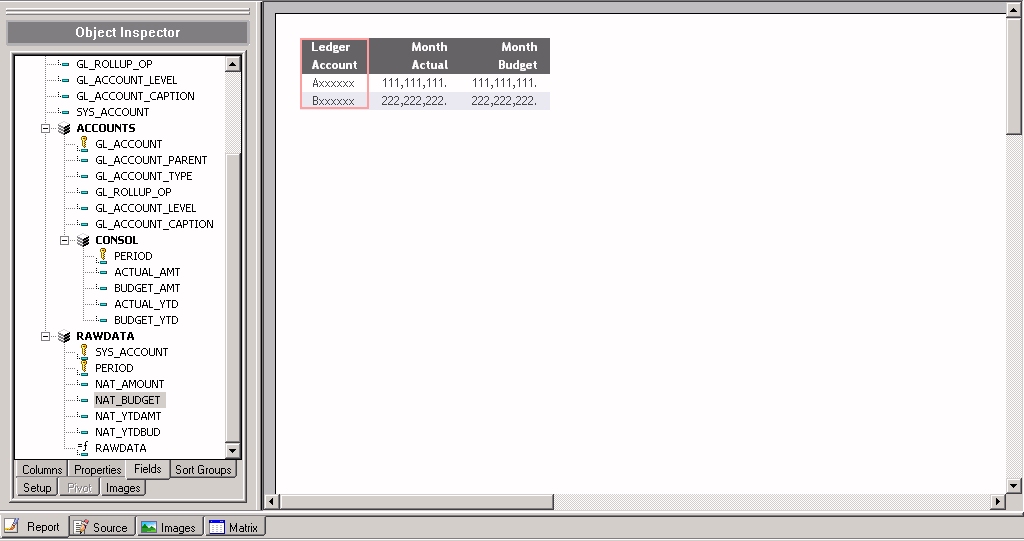
For the income statement in this exercise, you will be using fields from CENTGL and CENTSYSF: GL_ACCOUNT, the For field that will give you row-by-row control of account values, and NAT_AMOUNT (Actual) and NAT_BUDGET (Planned), each of which will require manipulation of the negative values to give you the results you need in your output.
The CENTGL Master File describes the Chart of Accounts hierarchy. The field GL_ACCOUNT_PARENT is the parent field in the hierarchy. The field GL_ACCOUNT is the hierarchy field. The field GL_ACCOUNT_CAPTION can be used as the descriptive caption for the hierarchy field. (The hierarchy will come into play when you begin to structure the income statement in the Financial Report Painter.)
FILE=CENTGL,SUFFIX=FOC
SEGNAME=ACCOUNTS,SEGTYPE=S01
FIELDNAME=GL_ACCOUNT, ALIAS=GLACCT, FORMAT=A7,
   TITLE='Ledger,Account', FIELDTYPE=I, $
FIELDNAME=GL_ACCOUNT_PARENT, ALIAS=GLPAR, FORMAT=A7,
   TITLE=Parent, PROPERTY=PARENT_OF, REFERENCE=GL_ACCOUNT, $
FIELDNAME=GL_ACCOUNT_TYPE, ALIAS=GLTYPE, FORMAT=A1, TITLE=Type,$
FIELDNAME=GL_ROLLUP_OP, ALIAS=GLROLL, FORMAT=A1, TITLE=Op, $
FIELDNAME=GL_ACCOUNT_LEVEL, ALIAS=GLLEVEL, FORMAT=I3, TITLE=Lev, $
FIELDNAME=GL_ACCOUNT_CAPTION,   ALIAS=GLCAP,   FORMAT=A30,
   TITLE=Caption, PROPERTY=CAPTION, REFERENCE=GL_ACCOUNT, $
FIELDNAME=SYS_ACCOUNT, ALIAS=ALINE, FORMAT=A6,
    TITLE='System,Account,Line', MISSING=ON, $
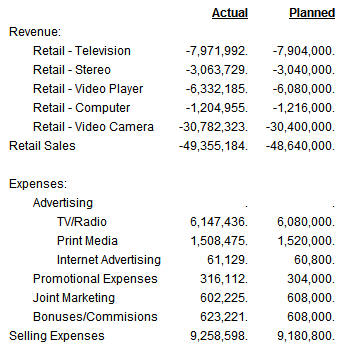
This example is not part of the tutorial. It is included to illustrate the problem you are about to solve.
The following report was produced from the joined data sources, CENTGL, CENTSTMT, and CENTSYSF.
You added three fields in Report Painter, GL_ACCOUNT, NAT_AMOUNT, and NAT_BUDGET.
In the Financial Report Painter, you added detail and summary rows to the matrix for one Revenue account, 2200 (Retail Sales), and one Expense account, 3100 (Selling Expenses).
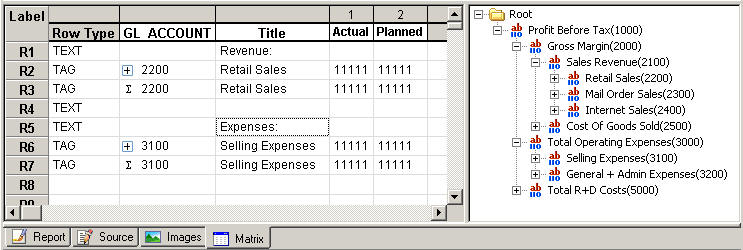
When you ran the report, Revenue (both the detail and summary rows) were preceded by minus (-) signs, while Expenses (both detail and summary rows) are shown as positive values.
| WebFOCUS |