axisname: {
  bodyLineStyle: {
    width: wnumber,
    color: 'cstring',
    dash: 'dstring'
  }
}
where:
- axisname
Can be:
- xaxisOrdinal
- xaxisNumeric
- yaxis
- y2axis
- zaxisOrdinal
- wnumber
Is a number that defines the width of the axis body line in pixels. The default value is 1.
- 'cstring'
Is a string that defines the color of the axis body using a color name or numeric specification string. The default value is 'transparent'.
For information about defining colors, see Colors and Gradients.
- 'dstring'
Is a string that defines the dash style. The default value is '' (which generates a solid line). Use a string of numbers that defines the width of a dash followed by the width of the gap between dashes (for example, dash: '1 1' draws a dotted line).
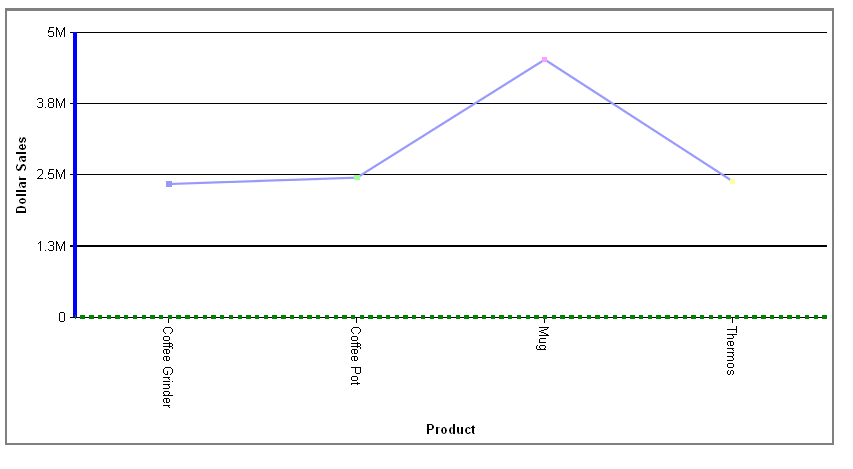
The following request against the GGSALES data source generates a vertical line chart with a y-axis body line and base line:
GRAPH FILE GGSALES
SUM DOLLARS
BY PRODUCT
WHERE CATEGORY EQ 'Gifts'
ON GRAPH PCHOLD FORMAT JSCHART
ON GRAPH SET LOOKGRAPH VLINE
ON GRAPH SET STYLE *
*GRAPH_JS
border: {width: 2, color: 'grey'},
yaxis: {
  majorGrid: {visible:true},
  intervalMode: 'count',
  intervalValue: 5,
   baseLineStyle: {width: 4, color: 'green', dash: '4 4'},
   bodyLineStyle: {width: 4, color: 'blue'}
}
*END
ENDSTYLE
END
On the output, the body line is the blue line that is perpendicular to the grid lines. The base line is the green dashed line below the grid lines:
