Gradients are transitions between colors. The transitions
can be applied linearly across the chart or radially from a central
point outward.
x
Syntax: How to Define Linear Gradient Properties as a String
color: 'linear-gradient(startX, startY, endX, endY,
 stopsOffset  stopsColor,...stopsOffset  stopsColor)'
where:
- startX, starty
Is the starting x-axis and y-axis position for the color
gradient.
The axis positions can be specified as numbers (for
example, 0) or as strings (for example, '5%'). Numbers are interpreted
as raw Scalable Vector Graphics (SVG) pixel coordinates. For example,
start: x:0, y:0 is the top-left corner of the object. Negative numbers
are not valid. Any number less than zero is treated as zero. Numeric
start and end coordinates are only useful for objects where you
can set the area dimensions (such as the chart background area).
For example, if the chart background area is set to 200 by 200 pixels,
and start x:0, y:0 and stop x:100, y:0 are used to define a linear gradient,
the gradient will be applied from the left edge to the center of
the rectangle. If the size of the object is calculated by the library
(for example, legend area, chart frame, risers), string percentages
are typically used.
- endX, endy
Applies to linear gradients only. Is the ending x-axis and
y-axis position for the color gradient.
The axis positions
can be specified as numbers (for example, 20) or as strings (for example,
'20%'). Numbers are interpreted as raw Scalable Vector Graphics
(SVG) pixel coordinates. For example, start: x:0, y:0 is the top-left
corner of the object. Negative numbers are not valid. Any number
less than zero is treated as zero. Numeric start and end coordinates
are only useful for objects where you can set the area dimensions (such
as the chart background area). For example, if the chart background
area is set to 200 by 200 pixels, and start x:0, y:0 and stop x:100,
y:0 are used to define a linear gradient, the gradient will be applied
from the left edge to the center of the rectangle. If the size of
the object is calculated by the library (for example, legend area,
chart frame, risers), string percentages are typically used.
- stopsOffset
Offset values define where the color changes. They can be
numbers, or they can be strings enclosed in single quotation marks
with a percent symbol (%). Only numbers between 0 and 1 are valid,
and are treated as percentages. A value 0.5 is the same as 50%.
Numbers less than zero are treated as zero, and numbers greater
than one are treated as 1.
- stopsColor
Specifies a color for the corresponding offset.
Example: Sample Linear Gradient String
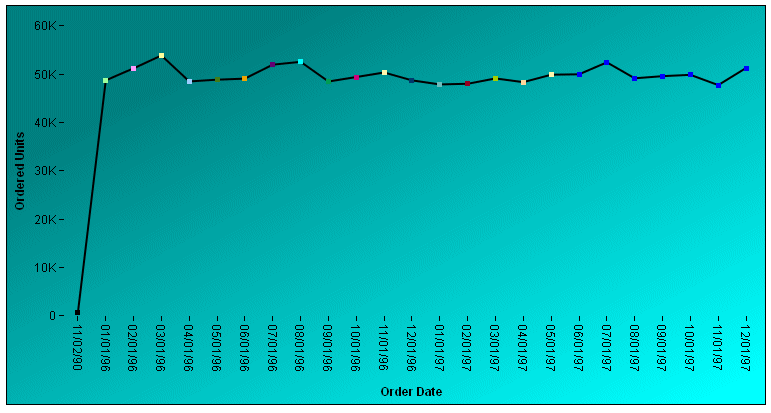
The following request against the GGORDER
data source specifies a linear gradient for the background of the
chart. The start and end coordinates describe the entire chart area, and
the gradient transitions from teal to cyan. The linear gradient
is specified as a string:
GRAPH FILE GGORDER
SUM QUANTITY
ACROSS ORDER_DATE
ON GRAPH PCHOLD FORMAT JSCHART
ON GRAPH SET LOOKGRAPH LINE
ON GRAPH SET STYLE *
 *GRAPH_JS
fill: {
   color: 'linear-gradient(0,0,100%,100%, 20% teal, 95% cyan)'
   },
series: [{series:0, color: 'black'}]
*END
ENDSTYLE
EN
The output is:

x
Syntax: How to Define Radial Gradient Properties as a String
color: 'radial-gradient(startX, startY, radius,
 stopsOffset, stopsColor,...stopsOffset stopsColor)'
where:
- startX, starty
Is the starting x-axis and y-axis position for the color
gradient.
The axis positions can be specified as numbers (for
example, 0) or as strings (for example, '5%'). Numbers are interpreted
as raw Scalable Vector Graphics (SVG) pixel coordinates. Numeric
start and end coordinates are only useful for objects where you can
set the area dimensions (such as the chart background area). If
the size of the object is calculated by the library (for example,
legend area, chart frame, risers), string percentages are typically
used. For radial gradients, start: x/y defines the center of the gradient
(for example, start: x: '50%', y: '50%' draws the gradient starting
from the center of the object).
- radius
Applies to radial gradients only. Defines the distance from
the center to the outermost edge of the gradient. The start x and
y coordinate defines the center of the gradient (for example, start:
x: '50%', y: '50%' draws the gradient in the center of the object).
Therefore, if an object is 200 by 200 pixels with a gradient start:
x:'50%', y:'50%' and radius: '100%', the outermost gradient edge
will be 100 pixels beyond the edges of the object. In this example,
100% of 200 pixels is 200 pixels, so the gradient is actually 400
pixels from extreme left to extreme right. For a radial gradient
that starts in the center (start: x:'50%'/y:'50%'), radius: '50%'
is normally used to draw the gradient from the center to the outermost
edges of the object.
- stopsOffset
Offset values define where the color changes. They can be
numbers, or they can be strings with a percent symbol (%). Only
numbers between 0 and 1 are valid, and are treated as percentages.
A value 0.5 is the same as 50%. Numbers less than zero are treated
as zero, and numbers greater than one are treated as 1.
- stopsColor
Specifies a color for the corresponding offset.
Example: Sample Radial Gradient String
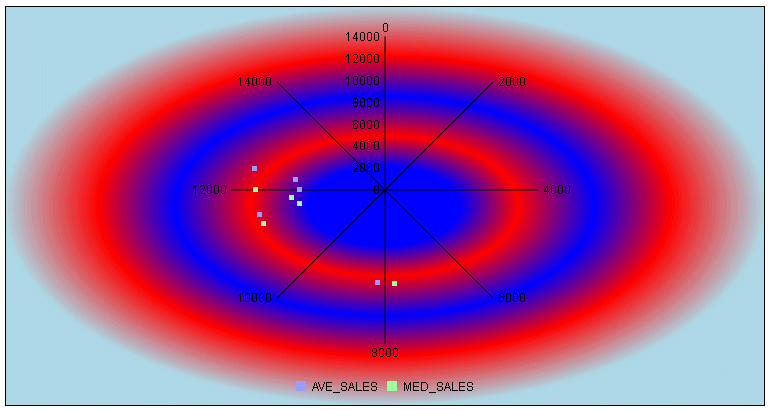
The following request against the GGSALES
data source specifies a radial gradient for the background of the
chart. The start position and radius describe the entire chart background.
From inside to outside, the colors transition from blue to red to
blue to red to lightblue. The gradient is specified as a string:
GRAPH FILE GGSALES
SUM DOLLARS NOPRINT AND COMPUTE
AVE_SALES = AVE.DOLLARS;
MED_SALES = MDN.DOLLARS;
ACROSS PRODUCT
ON GRAPH PCHOLD FORMAT JSCHART
ON GRAPH SET LOOKGRAPH POLAR
ON GRAPH SET STYLE *
*GRAPH_JS
fill: {
   color: 'radial-gradient(50%,50%,50%, 20% blue, 35% red, 55% blue, 75% red, 1 lightblue)'
   }
*END
END
The output is:

x
Syntax: How to Define Gradient Properties as a JSON Object
color: {
   type: 'tstring',
   start:{
      x: sx1,
      y: sy1   },
   end:{
      x: ex1,
      y: ey1   },
   radius: 'rstring',
   stops: [
         {
            offset: off1,
            color: 'color1'
         },
         ...
      ]
}
where:
- 'tstring'
Is a string that defines the type of gradient. Valid values
are 'linear' or 'radial'.
- start: x, start: y, end: x, end: y, radius
Specify the gradient coordinates in the chart.
- sx1
Specifies the starting x-coordinate in the chart. It can
be specified as a number or as a percent value enclosed in single
quotation marks and including the percent symbol.
Numbers
are interpreted as raw Scalable Vector Graphics (SVG) pixel coordinates. For
example, start: x:0, y:0 is the top-left corner of the object. Negative
numbers are not valid. Any number less than zero is treated as zero.
Percentage
coordinates are most useful when the size of an object is calculated by
the library or, for radial gradients, where 50% specifies the center
of the object.
- sy1
Specifies the starting y-coordinate in the chart. It can
be specified as a number or as a percent value enclosed in single
quotation marks and including the percent symbol.
Numbers
are interpreted as raw Scalable Vector Graphics (SVG) pixel coordinates. For
example, start: x:0, y:0 is the top-left corner of the object. Negative
numbers are not valid. Any number less than zero is treated as zero.
Percentage
coordinates are most useful when the size of an object is calculated by
the library or, for radial gradients, where 50% specifies the center
of the object.
- ex1
Applies to linear gradients only. Specifies the ending x-coordinate
in the chart. It can be specified as a number or as a percent value
enclosed in single quotation marks and including the percent symbol.
Numbers are interpreted as raw Scalable Vector Graphics
(SVG) pixel coordinates. Negative numbers are not valid. Any number
less than zero is treated as zero.
Percentage coordinates
are most useful when the size of an object is calculated by the
library or for radial gradients, where 50% specifies the center
of the object.
- ey1
Applies to linear gradients only. Specifies the ending y-coordinate
in the chart. It can be specified as a number or as a percent value
enclosed in single quotation marks and including the percent symbol.
Numbers
are interpreted as raw Scalable Vector Graphics (SVG) pixel coordinates. Negative
numbers are not valid. Any number less than zero is treated as zero.
Percentage
coordinates are most useful when the size of an object is calculated by
the library or for radial gradients, where 50% specifies the center
of the object.
The start: x/y and end:
x/y parameters can be specified as numbers (for example, 0/20) or
as strings (for example, '5%'/'20%'). Numbers are interpreted as
raw Scalable Vector Graphics (SVG) pixel coordinates. For example,
start: x:0/y:0 is the top-left corner of the object. Negative numbers
are not valid. Any number less than zero is treated as zero. Numeric
start/end coordinates are only useful for objects where you can
set the area dimensions (such as the chart background area). For
example, if the chart background/draw area is set to 200 by 200
pixels and start x:0/y:0 and stop x:100/y:0 is used to define a
linear gradient, the gradient will be applied from the left edge
to the center of the rectangle. If the size of an object is calculated
by the library (such as for the legend area, chart frame, or risers),
string percentages are typically used. For radial gradients, start:
x/y defines the center of the gradient (for example, start: x: '50%'/y:
'50%' draws the gradient in the center of the object).
- 'rstring'
Applies to radial gradients only. Defines the distance from
the center to the outermost edge of the gradient.
For example,
if an object is 200 by 200 pixels with a gradient start: x:'50%', y:'50%'
and radius: '100%', the outermost gradient edge will be 100 pixels
beyond the edges of the object. In this example, 100% of 200 pixels
is 200 pixels, so the gradient is actually 400 pixels from extreme
left to extreme right. For a radial gradient that starts in the
center (start: x:'50%', y:'50%'), radius: '50%' is normally used
to draw the gradient from the center to the outermost edges of the object.
- stops:
Is a comma-separated list of offset-color pairs. This array
can be any length, and can be a list of objects or arrays.
- off1
Is an offset expressed as a number or a percent.
If
expressed as a number, it must be between 0 and 1 and represents
a percentage of the gradient area at which the color changes. The
value 0.5 is the same as 50%. Numbers less than zero are treated
as zero, and numbers greater than one are treated as 1.
If
expressed as a percentage, it must be enclosed in single quotation
marks and include the percent symbol. It specifies a percentage
of the gradient area at which the color changes.
- 'color1'
Specifies the color for the corresponding offset.
Example: Sample Linear Gradient JSON Object
The following request against the GGORDER
data source specifies a linear gradient for the background of the
chart. The start and end coordinates describe the entire chart area, and
the gradient transitions from teal to cyan. The linear gradient
is specified as a JSON object:
GRAPH FILE GGORDER
SUM QUANTITY
ACROSS ORDER_DATE
ON GRAPH PCHOLD FORMAT JSCHART
ON GRAPH SET LOOKGRAPH LINE
ON GRAPH SET STYLE *
 *GRAPH_JS
fill: {color:
  {type: 'linear',
   start: {x: 0, y: 0},
   end: {x:'100%', y: '100%' },
   stops: [
         {offset: '20%', color: 'teal'},
         {offset: '95%', color: 'cyan'}
         ]
    }},
series: [{series:0, color: 'black'}]
*END
ENDSTYLE
END
The output is:

Example: Sample Radial Gradient JSON Object
The following request against the GGSALES
data source specifies a radial gradient for the background of the
chart. The start position and radius describe the entire chart background.
From inside to outside, the colors transition from blue to red to
blue to red to lightblue. The gradient is specified as a JSON object:
GRAPH FILE GGSALES
SUM DOLLARS NOPRINT AND COMPUTE
AVE_SALES = AVE.DOLLARS;
MED_SALES = MDN.DOLLARS;
ACROSS PRODUCT
ON GRAPH PCHOLD FORMAT JSCHART
ON GRAPH SET LOOKGRAPH POLAR
ON GRAPH SET STYLE *
*GRAPH_JS
fill: {
  color:
   {type: 'radial',
   start: {x: '50%', y: '50%'},
   end: {x:'50%', y: '50%' },
   stops: [
         {offset: '20%', color: 'blue'},
        {offset: '35%', color: 'red'},
        {offset: '55%', color: 'blue'},
        {offset: '75%', color: 'red'},
         {offset: 1, color: 'lightblue'}
         ]
    }}
*END
END
The output is:


