This section contains information on the available set
methods.
xsetAltFmtFrameNumColors()
This method sets the number of colors/sections to be
used for alternate formatting of an axis. Alternate formatting can
be used to assign different colors to individual sections of an
axis and axis labels. You may also define a text string label that
is shown with the alternate formatted section.
Syntax:
setAltFmtFrameNumColors (IdentObj idObj, int newValue);
where:
- idObj
Is the object ID of an alternate formatting axis object (for
example, getY1AltFmtFrame(), getO1AltFmtFrame(), and so on).
- newValue
For setAltFmtFrameNumColors(), number of colors/sections
to use for alternate formatting of the specified axis (idObj). It
can be a value in the range 1...100. Default value is 2.
This method returns the number of colors/sections that are used
for alternate formatting of the specified axis (idObj) for getAltFmtFrameNumColors()
as an integer.
Example:
setAltFmtFrameNumColors(getY1AltFmtFrame(),3);
setAltFmtFrameSeparator(getY1AltFmtFrame(0),300000.0);
setFillColor(getY1AltFmtFrame(0),new Color(251,255,181));
setAltFmtFrameSeparator(getY1AltFmtFrame(1),600000.0); setFillColor(getY1AltFmtFrame(1),new Color(164,255,255));
Note: The number of separator lines displayed in the graph
above is equal to the number of alternate formatting colors minus
one. Separators exist only where two alternate formatting colors
meet.
Also see Alternate Formatting.
xsetAltFmtFrameSeparator()
This method sets the location
on an axis where alternate formatting is applied.
Syntax:
setAltFmtFrameSearator(IdentObj idObj,double newValue);
where:
- idObj
Is the object ID of an alternate formatting axis object (for
example, getY1AltFmtFrame(), getO1AltFmtFrame(), and so on).
- newValue
For setAltFmtFrameSeparator(), the location on the axis where
alternate formatting will be applied. For a numeric axis, specify
a value that is within the range of values on the specified axis.
For the ordinal (O1) axis, specify a group number that is within
the range of groups on the ordinal axis.
This method returns a double value for getAltFmtFrameSeparator(),
the location on the axis where alternate formatting has been applied.
See Alternate Formatting.
x
This method sets a lightening or darkening factor for
shading groups of risers. It is used in conjunction with color mode
4 and setSeriesLooping. For information, see Risers and Markers.
Syntax:
void setAutoColorLerpFactor(double newValue);
where:
- newValue
Is a double-precision number between -1 and 1 that represents
the factor for lightening or darkening each successive group of
risers. A positive factor specifies that each successive group of
risers will be lighter than the previous group. A negative number
specifies that each successive group of risers will be darker than
the previous group. Zero indicates that each successive group of
risers will be shaded exactly the same as the previous group.
Return: void;
See Risers and Markers, ColorMode, setSeriesLooping().
x
This method sets or disables label skip for labels on
the O1 axis. If this method selects manual label skip (2), use setSkipBegin()
to define the first label to skip and setSkipCount() to define the
skip interval. If this method selects automatic skip mode (1), labels
will automatically be omitted/skipped when the graph size causes
the labels to be drawn in less than 8-point type. Automatic skip
mode may omit all but two labels if the graph is reduced to its
minimum size.
Syntax:
void setAutoSkip(IdentObj id, int newValue);
where:
- id
Is an object ID returned by a getObjectID() method (for example, getO1Label()).
- newValue
Can be one of the following values:
0 (no
label skipping)
1 (automatic label skipping)
2 (manual
skipping as defined by setSkipBegin() and setSkipCount())
Return: void;
Example:
setAutoSkip(getO1Label(),2);
setSkipBegin(getO1Label(),1);
setSkipCount(getO1Label(),1);
Note: If an object ID (id) is not specified, newValue
is assigned to the first item in the selection list (if applicable).
See setSkipBegin() and setSkipCount().
x
In multi-axis graphs, this method can be used to assign
individual series to the Y1, Y2, Y3, Y4, and Y5 axes.
Syntax:
void setAxisAssignment (IdentObj id, int newValue);
void setAxisAssignment (int seriesID, int newValue);
For merged multi-axis graphs:
void setAxisAssignment ([$]seriesID, newValue);
where:
- id
Is an object ID returned by a getObjectID() method (for example, getSeries(1)).
- seriesID
Is a series number.
- $seriesID
Automatically assigns an axis to each series by using the
number of measures as an increment that ensures that all series
related to the same measure use the same axis. This automatic series
increment is also available for setSeriesType().
- newValue
Can be one of the following values:
0 (Y1
axis)
1 (Y2 axis)
2 (Y3
axis)
3 (Y4 axis)
4 (Y5
axis)
Return: void;
Example:
setGraphType(21); setAxisAssignment(getSeries(1),0); setAxisAssignment(getSeries(0),1);
setAxisAssignment(getSeries(3),1); setAxisAssignment(getSeries(4),0);
Example for a Multi-Axis Merged Graph
The following request uses a bi-polar
bar chart with two measures (CURR_SAL and SALARY) and two sort fields
(BY DEPARTMENT and ACROSS LAST_NAME). This makes it a multi-axis
merged graph request:
GRAPH FILE EMPLOYEE
SUM EMPLOYEE.EMPINFO.CURR_SAL
EMPLOYEE.PAYINFO.SALARY
BY EMPLOYEE.EMPINFO.DEPARTMENT
ACROSS EMPLOYEE.EMPINFO.LAST_NAME
ON GRAPH SET LOOKGRAPH VBAR2AXS
ON GRAPH SET 3D OFF
ON GRAPH SET BARNUMB OFF
ON GRAPH SET GRID ON
ON GRAPH SET GRAPHEDIT OFF
ON GRAPH SET GRMERGE ON
ON GRAPH SET VZERO ON
ON GRAPH SET HTMLENCODE ON
ON GRAPH SET GRAPHSTYLE *  -* ***Axis Assignments***
 setAxisAssignment($0,0); setAxisAssignment($1,1);setSeriesType($0,2);
setSeriesType($1,1);
Since DEPARTMENT has two values and there are two measures, there
are four series in the graph request: CURR_SAL for the MIS department,
CURR_SAL for the PRODUCTION department, SALARY for the MIS department,
and SALARY for the PRODUCTION department
The axis assignments are setAxisAssignment($0,0);
and setAxisAssignment($1,1). These are translated to the following
API calls that make sure that series 0 and 2 (based on CURR_SAL)
are assigned to the Y1 (left axis) and that series 1 and 3 (based
on SALARY) are assigned to the Y2 (right) axis:
setAxisAssignment(0,0);
setAxisAssignment(2,0);
setAxisAssignment(1,1);
setAxisAssignment(3,1);
The output is:
See getAxisAssignment(), getAxisDescending(), setAxisDescending(), getAxisSide(), setAxisSide(), Y1AxisSide, Y2AxisSide.
x
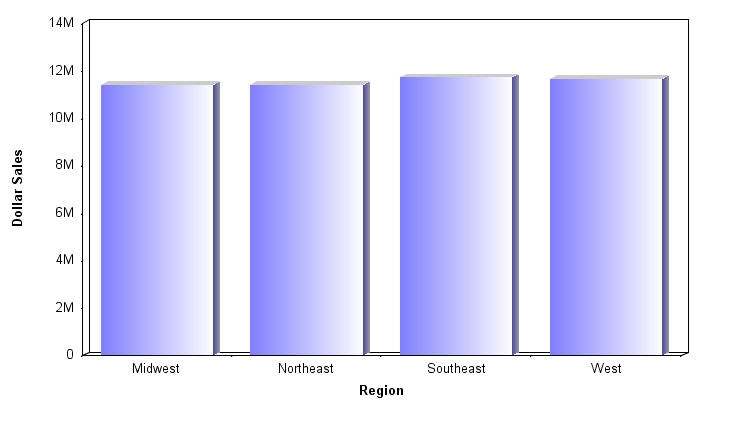
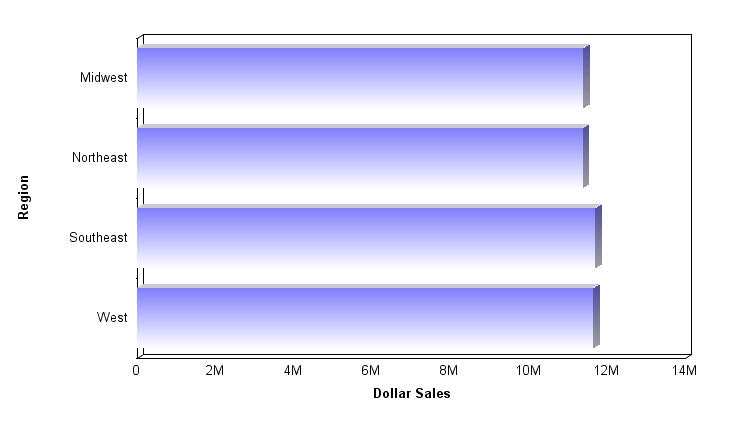
This method can be used to draw an axis in ascending
or descending order.
Syntax:
void setAxisDescending(IdentObj id, boolean newValue);
where:
- id
Is an object ID returned by a getObjectID() method (for example, getY1Axis()).
- newValue
Can be one of the following values:
true (descending)
false (ascending)
Return: void;
Example:
setDepthRadius(0);
setViewableGroups(4);
setViewableSeries(4);
setDataScrollerPresenceGroups(0);  setAxisDescending(getY1Axis(), true);
Note: You may also use one of the axis-specific properties
(for example, X1AxisDescending, Y1AxisDescending, and so on) to
set the descending attribute of an axis.
See getAxisAssignment(), setAxisAssignment(), getAxisSide(), setAxisSide(), X1AxisDescending, Y1AxisDescending, Y2AxisDescending.
x
In multi-Y graphs (3 or more Y-axes), axes can overlap.
This method and setAxisSize() can be used to create a more desirable
graph layout for multi-Y axes graphs. setAxisSize() sets the size
of the frame, this method sets the axis offset from the base of the
frame.
Syntax:
void setAxisOffset(int newValue)
void setAxisOffset(IdentObj id, int newValue)
where:
- newValue
Is the axis offset value 0...100 (0=automatic sizing).
- id
Is an object ID of a Y-axis returned by getY1Axis(), getY2Axis(),
getY3Axis(), getY4Axis(), or getY5Axis().
Return: void;
Example:
setAxisAssignment(getSeries(0), 0);
setAxisAssignment(getSeries(1), 1);
setAxisAssignment(getSeries(2), 2);
setAxisAssignment(getSeries(3), 2);  setAxisOffset(getY1Axis(), 0);  setAxisOffset(getY2Axis(), 20);  setAxisOffset(getY3Axis(), 75);
setAxisSize(getY1Axis(), 20);
setAxisSize(getY2Axis(), 55);
setAxisSize(getY3Axis(), 25);
setGraphType(103);
setY1TitleString("Y1 Axis");
setY2TitleString("Y2 Axis");
setTextString(getY3Title(), "Y3 Axis");
setDepthRadius(0);
Note:
- If an object
ID (id) is not specified, newValue is assigned to the first item
in the selection list (if applicable).
- If setAxisSize()
sets the size of the axis to zero (automatic), the axis offset will
also be automatically calculated regardless of the offset set by
this method.
See getAxisOffset() and getAxisSize().
x
This method defines the side of a graph where an axis
is imaged.
Syntax:
void setAxisSide(IdentObj id, int newValue);
where:
- id
Is an object ID returned by a getObjectID() method (for example, getY1Axis()).
- newValue
Can be a value of 0...2. If the value is:
0,
the axis is imaged on the left (or bottom for horizontal graphs).
1,
the axis is imaged on the right (or top for horizontal graphs).
2,
the axis is imaged on both sides of graph.
Return: void;
Example:
setAxisSide(getY1Axis(),1);
setAxisSide(getO1Axis(),2);
Note: You may also use one of the axis-specific properties
(for example, X1AxisSide, Y1AxisSide, and so on) to assign an axis
to a side.
See getAxisAssignment(), setAxisAssignment(), getAxisDescending(), setAxisDescending(), O1AxisSide, X1AxisSide, Y1AxisSide, Y2AxisSide.
x
In multi-Y graphs (3 or more Y-axes), axes can overlap.
This method and setAxisOffset() can be used to create a more desirable
graph layout for multi-Y axes graphs. This method sets the size
of the frame, setAxisOffset() sets the axis offset from the base of
the frame.
Syntax:
void setAxisSize(IdentObj id, int newValue)
where:
- newValue
Is the axis size 0...100 (0 = automatic).
- id
Is an object ID of a Y-axis returned by getY1Axis(), getY2Axis(),
getY3Axis(), getY4Axis(), or getY5Axis().
Return: void;
Example:
setAxisAssignment(getSeries(0), 0);
setAxisAssignment(getSeries(1), 1);
setAxisAssignment(getSeries(2), 2);
setAxisAssignment(getSeries(3), 2);
setAxisOffset(getY1Axis(), 0);
setAxisOffset(getY2Axis(), 20);
setAxisOffset(getY3Axis(), 75);  setAxisSize(getY1Axis(), 20);  setAxisSize(getY2Axis(), 55);  setAxisSize(getY3Axis(), 25);
setGraphType(103);
setDepthRadius(0);
setY1TitleString("Y1 Axis");
setY2TitleString("Y2 Axis");
setTextString(getY3Title(), "Y3 Axis");
Note: If you set the axis size to zero (automatic) with
this method, the axis offset will also be automatically calculated
regardless of the value set by setAxisOffset().
See getAxisSize().
x
This method draws a specified border on an annotation,
title box, subtitle box, or footnote box object. The default border
width is 200. Therefore, a border can be assigned without setting
a width.
Syntax:
void setBorder(
     IdentObj anObject,
     String aBorder
)
void setBorder(
IdentObj anObject,
String aBorder,
int aWidth
) where:
- anObject
Is an object ID returned by a getObject() method.
- aBorder
Is one of the following border types:
- EmptyBorder
- CompoundBorder
- BevelBorder
- ShadowBorder
- EtchedBorder
- LineBorder
- DoubleLineBorder
- aWidth
Is the width of the border in pixels.
Return: void;
Note:
- Currently supported
objects include: an annotation object (for example, getAnnotationBox(0)),
the title box object (that is, getTitleBox()), the subtitle box
object (that is, getSubtitleBox()), or the footnote box object (that
is, getFootnoteBox()).
- Borders supersede
Insets as the mechanism for creating a (decorated or plain) area
around the edge of an object.
See getBorder().
x
This method sets the border color of an object in a
graph.
Syntax:
void setBorderColor(new Color(newValue));
void setBorderColor(IdentObj id, new Color(newValue));
where:
- id
Is an object ID returned by a getObjectID() method (for example, getSeries(1)).
- newValue
Is the value of the border color, in one of the following
formats:
r, g, b is the desired intensity
of red, green, and blue, respectively. The values are on a scale
of 0 to 255, where 0 is the least intense and 255 is the most intense.
#hexcolor is the
hexadecimal color code, preceded by a pound sign (#).
Return: void;
Example:
setBorderColor(getSeries(4),new Color(255,0,0));
setFillColor(getSeries(4),new Color(0,255,255));
or, using hexadecimal color codes:
setBorderColor(getSeries(4),new Color(#FF0000));
setFillColor(getSeries(4),new Color(#00FFFF));
setBorderColor(getSeries(4),new Color(0,0,0));
setFillColor(getSeries(4),new Color(255,255,255));
or, using hexadecimal color codes:
setBorderColor(getSeries(4),new Color(#000000));
setFillColor(getSeries(4),new Color(#FFFFFF));
Note: If an object ID (id) is not specified, newValue
is assigned to the first item in the selection list (if applicable).
See getFillColor(), setFillColor(), getTransparentBorderColor(), setTransparentBorderColor(), setSeriesBorderColor(), ColorMode.
x
This method sets the border type for a specified object.
The default value is NONE.
Syntax:
setBorderType(IdentObj IdObj, int nBorderType);
where:
- idObj
Is the object ID returned by getAnnotationBox(), getBeveledLegend(), getBeveledLegendMarker(),
getFootnoteBox(), getSubtitleBox(), or getTitleBox().
- nBorderType
One of the following border types:
- BORDER_NONE
= 0;
- BORDER_BEVEL
= 1;
- BORDER_BEVEL_RAISED
= 2;
- BORDER_BEVEL_LOWERED
= 3;
- BORDER_LINE
= 4;
- BORDER_LINE_DOUBLE
= 5;
Return: void;
See Beveled Borders and getBorderType().
x
This method sets the width of a border that may be drawn
around an annotation, title box, subtitle box, or footnote box object.
It is not necessary to call setBorder() before defining the width
with this method. This is a convenience method that can also be
used from the scripting interface.
Syntax:
void setBorderWidth(
     IdentObj anObject,
     int borderWidth )
void setBorderWidth(
IdentObj anObject,
Insets theBorderInsets )where:
- anObject
Is an object ID returned by a getObject() method.
- borderWidth
Is a uniform border width for all sides of anObject.
- theBorderInsets
Is the uniform inset for all sides of anObject.
Return: void;
Note: Currently supported objects include: an annotation
object (for example, getAnnotationBox(0)), the title box object
(that is, getTitleBox()), the subtitle box object (that is, getSubtitleBox()),
or the footnote box object (that is, getFootnoteBox()).
See getBorderWidth(), setBorder().
x
This method applies a corner arc of a specified width
and height to an annotation title box, subtitle box, or footnote
box object.
Syntax:
void setCornerArc(
     IdentObj anObject,
     int aWidth,
     int aHeight )
where:
- anObject
Is an object ID returned by a getObject() method.
- aWidth
Is the width of the corner arc.
- aHeight
Is the height of the corner arc.
Return: void;
Note: Currently supported objects include: an annotation
object (for example, getAnnotationBox(0)), the title box object
(that is, getTitleBox()), the subtitle box object (that is, getSubtitleBox()),
or the footnote box object (that is, getFootnoteBox()).
See getCornerArcWidth/Height().
xsetCornerArcWidth/Height()
These methods set the width and height of the corner arc of a
border applied to an object. The default value is 5.
Syntax:
setCornerArcHeight (IdentObj idObj, int newValue);
setCornerArcWidth (IdentObj idObj, int newValue);
where:
- idObj
Is the object ID returned by getAnnotationBox(), getBeveledLegend(), getBeveledLegendMarker(),
getFootnoteBox(), getSubtitleBox(), or getTitleBox().
- newValue
Is the height or width of corner arc in virtual coordinates.
Return: void
Example:
setDepthRadius(0);
setGraphType(41);
setDisplay(getSubtitleBox(), true);
setBorderType(getSubtitleBox(), 3);
setTopInset(getSubtitleBox(), 250);
setLeftInset(getSubtitleBox(), 250);
setBottomInset(getSubtitleBox(), 250);
setRightInset(getSubtitleBox(), 250);
setFillColor(getSubtitleBox(), new Color(255,255,0));
setCornerArcWidth(getSubtitleBox(), 500);
setCornerArcHeight(getSubtitleBox(), 500);
x
This method sets the rotation
matrix of a 3D graph.
Syntax:
void setCubeRotationMatrix (double rx, double ry,
    double rq);
void setCubeRotationMatrix (tdg.model3d.Matrix3d m);
void setCubeRotationMatrix(double m00, double m01,
     double m02, double m10, double m11, double m12,
     double m20, double m21, double m22)
where:
- rx
Is the rotation in x direction.
- ry
Is the rotation in y direction.
- rz
Is the rotation in z direction.
Return: void;
Example:
setCubeFocusFactor(87.49999876279527);  setCubeRotationMatrix(0.9595622863061368,
    -0.4715354993437172,1.031956469611238,
    -0.03648998497747465,1.3380131050659487,
    0.6453131606305538,-1.1339966328478057,
    -.44205753827450966,0.8524531853183448);
setCubeViewerZ(80.8979539352483);
setGraphType(0);
Note: The default setting is
setCubeRotationMatrix (0.7071067811865474, 0.0, 0.7071067811865477,
-0.3535533905932738, 0.8660254037844387, 0.3535533905932736,
-0.6123724356957947,
-0.49999999999999994, 0.6123724356957945);
xsetCurveFitPolynomialOrder()
If the setCurveFit() method selects a polynomial fit
line across a series of risers (that is, setCurveFit(FIT_POLYNOMIAL)),
this method sets the order (the largest power to which x is raised)
for the polynomial fit. The default value is 3.
Syntax:
void setCurveFitPolynomialOrder(IdentObj id, int newValue)
void setCurveFitPolynomialOrder(int seriesID, int newValue)
where:
- newValue
Is the order for the polynomial fit (0...10).
- id
Is the object ID returned by a getObjectID() method (for
example, getSeries()).
- seriesID
Is the series number.
Return: void
Example:
setDepthRadius(0);
setCurveFitType(1,3);  setCurveFitPolynomialOrder(1,3);
Note: If an object ID (id) is not specified, newValue
is assigned to the first item in the selection list (if applicable).
See getCurveFitPolynomialOrder(), getCurveFitType(), setCurveFitType().
x
This method selects a curve fit line and draws the selected
curve type across one or more series of risers in a graph.
Syntax:
void setCurveFitType(IdentObj id, int newValue)
void setCurveFitType(int seriesID, int newValue)
where:
- newValue
Is the curve fit type (0...11) described
in the following table.
CurveFitType Constant | Value | Description |
FIT_NONE | 0 | None |
FIT_LINEAR | 1 | Linear regression curve fit line |
FIT_QUADRATIC | 2 | Quadratic curve fit line |
FIT_POLYNOMIAL | 3 | Polynomial fit line |
FIT_HYPERBOLIC | 4 | Hyperbolic curve fit line |
FIT_LOGARITHMIC | 5 | Logarithmic curve fit line |
FIT_MODHYPERBOLIC | 6 | Modified hyperbolic |
FIT_RATIONAL | 7 | Rational curve fit line |
FIT_EXPONENTIAL | 8 | Exponential curve fit line |
FIT_MODEXPONENTIAL | 9 | Modified exponential |
FIT_LOGQUADRATIC | 10 | Logarithmic/Quadratic curve fit line |
FIT_GEOMETRIC | 11 | Geometric curve fit line |
- id
Is the object ID returned by a getObjectID() method (for
example, getSeries()).
- seriesID
Is the series number.
Return: void
Example:
setDepthRadius(0); setCurveFitType(1,11);
Note: If an object ID (id) or series ID (seriesID) is
not specified, newValue is assigned to the first item in the selection
list (if applicable).
See getCurveFitType(), CurveFitEquationDisplay, CurveFitHighOrderFirst.
x
When data text is displayed with setDataTextDisplay(true),
the custom data text methods allow you to assign a different format
to each series in the graph. This method enables/disables custom
data text for a specified series. When enabled, the setCustomDataTextFormat()
and setCustomDataTextFormatPattern() methods can be used to assign
a different format to each series.
Syntax:
void setCustomDataText(
     IdentObj idSeries,
     boolean bNewValue)
where:
- idSeries
Is an object ID returned by a getObject() method (for example, getSeries(0)).
- bNewValue
Is a boolean where a value of:
true enables
custom data text for the specified series.
false disables
custom data text for the series.
Return: void
Example:
setDepthAngle(0);
setDepthRadius(0);
setGraphType(41);
setCustomDataText(getSeries(2), true);
setCustomDataText(getSeries(1), true);
setCustomDataText(getSeries(0), true);
setCustomDataTextFormat(getSeries(2), 5);
setCustomDataTextFormat(getSeries(1), 6);
setCustomDataTextFormat(getSeries(0), 2);
setDataTextDisplay(true);
setViewableSeries(3);
See setCustomDataTextFormat(), setCustomDataTextFormatPattern().
xsetCustomDataTextFormat()
This method assigns a data text format to a specified
series. Custom data text must be enabled for the series with setCustomDataText(getSeries(n), true);.
Syntax:
void setCustomDataTextFormat(
     IdentObj idSeries,
     int newValue)
where:
- idSeries
Is an object ID returned by a getObject() method (for example, getSeries(0)).
- newValue
Is a value between -1 and 21. -1 tells the graphing engine
that the format will be defined by setCustomDataTextFormatPattern().
0...21
selects one of the following formats:
0/1 =
# (for example, 123 = 123)
2 = #% (for example,
123 = 12,300%)
3 = #.#% (for example, 123
= 12,300.0%)
4 = #.##% (for example, 123
= 12,300.00%)
5 = $#.## (for example, 123
= $123.00)
6 = $# (for example, 123 = $123)
7 =
#K (Show K for values over 999) (for example, 1,234 = 1K)
8 =
$#K (Show K for values over 999) (for example, 1,234 = $1K)
9 =
#M (Show M for millions) (for example, 1,234,567 = 1M)
10 =
$#M (Show M for millions) (for example, 1,234,567 = $1M)
11 =
#B (Show B for billions) (for example, 1,234,567,891 = 1B)
12 =
$#B (Show B for billions) (for example, 1,234,567,891 = $1B)
13 =
#T (Show T for trillions) (for example, 1,234,567,891,234 = 1T)
14 =
$#T (Show T for trillions) (for example, 1,234,567,891,234 =
$1T)
15 = Number with thousands separators,
no decimal places (for example, 1,234 = 1K)
16 =
Number with thousands separators, two decimal places (for example,
1,234 = 1.23K)
17 = General currency format
for current Locale
18 = Short Date Format:
MM/DD/YY (for example, 10/01/03)
19 = Medium
Date Format: Mon. DD, YYYY (for example, Oct. 01, 2003)
20 =
Long Date Format: Month DD, YYYY (for example, October 01, 2003)
21 =
Full Date Format: Day, Month DD, YYYY (for example, Wednesday,
October 01, 2003)
Return: void;
See setCustomDataText().
xsetCustomDataTextFormatPattern()
When setCustomDataTextFormat() assigns -1 as the data
text format for a particular series, this method defines a data
text format pattern for the series.
Syntax:
void setCustomDataTextFormatPattern(
     IdentObj idSeries,
     String newValue)
where:
- idSeries
Is an object ID returned by a getObject() method (for example, getSeries(0)).
- newValue
Is a pattern string in the following format:
pattern:= subpattern{;subpattern}subpattern:= {prefix}integer{.fraction}{suffix}prefix:= '\\u0000'..'\\uFFFD' - specialCharacterssuffix:= '\\u0000'..'\\uFFFD' - specialCharactersinteger:= '#'* '0'* '0'fraction:= '0'* '#'*
Notation:
X* | 0 or more instances of X |
(X|Y) | either X or Y. |
X..Y | any character from X up to Y, inclusive. |
S - T | characters in S, except those in T |
The first subpattern is for positive numbers. The second (optional)
subpattern is for negative numbers. In both cases, a comma (,) can
occur inside the integer portion. Here are the special characters
used in the parts of the subpattern, with notes on their usage.
0 = a digit
# = a digit, zero shows as absent
. = a period (.) is a placeholder for decimal
separator
, = a comma (,) is a placeholder for grouping
separator
; = a semicolon (;) separates formats
- = a minus sign/dash (-) is the default negative
prefix
% = divide by 100 and show as percentage
x = any other characters can be used in the
prefix or suffix
' = a single quote (') is used to quote special
characters in a prefix or suffix
If there is no explicit negative subpattern, a minus sign (-)
is prefixed to the positive form (i.e, "0.00" alone is equivalent
to "0.00;-0.00"). Illegal formats, such as "#.#.#" or mixing '_'
and '*' in the same format, will cause a ParseException. The ParseException string
will show where the error occurred. The grouping separator is commonly
used for thousands, but in some countries for ten-thousands. The
interval is a constant number of digits between the grouping characters,
such as 100,000,000 or 1,0000,0000. If you supply a pattern with
multiple grouping characters, the interval between the last one
and the end of the integer is the one that is used. So "#,##,###,####"
== "######,####" == "##,####,####". This class only handles localized
digits where the 10 digits are contiguous in Unicode, from 0 to
9.
Return: void;
Example:
setDepthAngle(0);
setDepthRadius(0);
setGraphType(41);
setCustomDataText(getSeries(2), true);
setCustomDataText(getSeries(1), true);
setCustomDataText(getSeries(0), true);
setCustomDataTextFormat(getSeries(2), 5);
setCustomDataTextFormat(getSeries(1), 1);
setCustomDataTextFormat(getSeries(0), -1);
setCustomDataTextFormatPattern(getSeries(0), "?##");
setDataTextDisplay(true);
setViewableSeries(3);
Note: setCustomDataTextFormat() must assign -1 to the
specified series in order for this custom format pattern to be used.
See getCustomDataTextFormatPattern(), setCustomDataText(), setCustomDataTextFormat().
x
This method sets the data value
for a series/group intersection. This is the master method for setting
data in graphs. You may also specify whether or not the graph should
be repainted when the new value is assigned. You must use setDataRangeToExtent() or
setDataRange() after the last setData() in order to include the
data in the graph.
Syntax:
void setData (int row,int col,double fValue);
void setData(int row, int col, double fValue, boolean bRecalc);
setData(int row, int col, Object obj)
setData(int row, int col, Object obj, boolean bRecalc)
setData(int row, int col, int nMonth, int nDay, int nYear)
where:
- row
Is the row number.
- col
Is the column number.
- obj
Is the object ID.
- fValue
Is the data value to set at the row or column.
- bRecalc
Can be one of the following:
true (recalculate)
false (do
not recalculate)
Return: void;
Example:
setUseSampleData(false);  setData(0,0,.5);  setData(0,1,1);  setData(0,2,2);  setData(0,3,3);  setData(0,4,4);  setData(0,5,5);  setData(1,0,.5);  setData(1,1,1);  setData(1,2,2);  setData(1,3,3);  setData(1,4,4);  setData(1,5,5);
setDataRangeToExtent();
See setDataRange(), setDataRangeToExtent().
x
This method sets a label string at a specified series
(s) and group (g).
Syntax:
void setDataLabel (int s,int g, String newValue);
where:
- s
Is a series number.
- g
Is a group number.
- newValue
Is a data label string.
Return: void;
Example:
setDataLabel(0,0, "My New Group 0 Label");  setDataLabel(0,1, "My New Group 1 Label");
setGroupLabel(0, getDataLabel(0,0));
setGroupLabel(1, getDataLabel(0,1));
setDepthRadius(0);
setDataRange(0,0,3,1);
See getDataLabel(), getGroupLabel(), setGroupLabel(), getSeriesLabel(), setSeriesLabel().
x
This method is used to establish the range of data that
will be used in a graph.
Syntax:
void setDataRange(int rowStop,int colStop);
void setDataRange(int rowStart, int colStart,
    int rowStop, int colStop);
where:
- rowStop
Is the last row number.
- colStop
Is the last column number.
- rowStart
Is the first row number (0 if not specified).
- colStart
Is the first column number (0 if not specified).
Return: void;
Example:
setDataRange(1,1,2,2);
See setData(), setDataRangeToExtent().
x
This method sets the range of data to be used in the
graph according to the number of values identified by the setData()
method. It will override values that may be set by setDataRange().
Syntax:
void setDataRangeToExtent ();
Return: void;
Example:
setUseSampleData(false);
setDepthRadius(0);
setData(0,0,.5);/* Row 0/Col 0 */
setData(0,1,1); /* Row 0/Col 1 */
setData(0,2,2); /* Row 0/Col 2 */
setData(0,3,3); /* Row 0/Col 3 */
setData(0,4,4); /* Row 0/Col 4 */
setData(0,5,5); /* Row 0/Col 5 */
setData(1,0,.5); /* Row 1/Col 0 */
setData(1,1,1); /* Row 1/Col 1 */
setData(1,2,2); /* Row 1/Col 2 */
setData(1,3,3); /* Row 1/Col 3 */
setData(1,4,4); /* Row 1/Col 4 */
setData(1,5,5); /* Row 1/Col 5 */  setDataRangeToExtent();
See setData(), setDataRange().
x
Method sets the angle from center point that all/selected
data text is drawn from in graph.
Syntax:
void setDataTextAngle(IdentObj id,int newValue);
void setDataTextAngle(int seriesID,int newValue);
void setDataTextAngle(int seriesID,int groupID,int newValue);
where:
- id
Is an object ID returned by a getObjectID() method (for example, getDataText()).
- seriesID
Is a series number.
- groupID
Is a group number.
- newValue
Is a data text angle (0...360).
Return: void;
Example:
setViewableGroups(2);
setViewableSeries(2);
setDataScrollerPresenceGroups(0);
setDataTextDisplay(true);
setDataTextPosition(0);  setDataTextAngle(0,0,30);  setDataTextAngle(0,1,60);  setDataTextAngle(1,0,90);  setDataTextAngle(1,1,120);
setDepthRadius(0);

Note: DataTextPosition must be set to zero and DataTextDisplay
must be set to true in order for data text to be drawn in the graph.
See getDataTextAngle(), getDataTextRadius(), setDataTextRadius(), DataTextAngleDefault, DataTextDisplay, DataTextPosition.
x
These methods set the radius for the data text position.
Syntax:
void setDataTextRadius(IdentObj id,int newValue);
void setDataTextRadius(int seriesID,int newValue);
void setDataTextRadius(int seriesID,int groupID,
    int newValue);
where:
- id
Is an object ID returned by a getObjectID() method (for example, getDataText()).
- seriesID
Is a series number.
- groupID
Is a group number.
- newValue
Is a data text radius (0...100).
Return: void;
Example:
setViewableGroups(2);
setViewableSeries(2);
setDataScrollerPresenceGroups(0);
setDataTextDisplay(true);
setDataTextPosition(0);
 setDataTextRadius(0,0,0);
 setDataTextRadius(0,1,10);
 setDataTextRadius(1,0,20);
 setDataTextRadius(1,1,30);
setDepthRadius(0);
Note: The DataTextPosition property must be set to zero.
The DataTextDisplay property must be set to true in order for data
text to be drawn in the graph.
See getDataTextRadius(), getDataTextAngle(), setDataTextAngle(), DataTextRadiusDefault, DataTextDisplay, DataTextPosition.
x
This method sets a data value for a specific data object
(riser) in a graph.
Syntax:
void setDataValue(IdentObj id, double newValue);
where:
- id
Is an object ID returned by a getObjectID() method (for example, getSeriesGroup()).
- newValue
Is a data value to be assigned to the object.
Return: void;
Example:
setDataRange(1,1,2,2);
setDataTextDisplay(true);
setDataTextPosition(0);
setDataTextRadius(0,0,20);
setDataTextRadius(0,1,20);
setDataTextRadius(1,0,20);
setDataTextRadius(1,1,20);  setDataValue(getSeriesGroup(0,0),100);  setDataValue(getSeriesGroup(0,1),50);  setDataValue(getSeriesGroup(1,0),25);  setDataValue(getSeriesGroup(1,1),5);
setDepthRadius(0);
See getDataValue().
x
This method sets the display attribute of an object.
If an object is not identified by id or objectID, this method will
set the display attribute for the first item in the selection list.
Syntax:
void setDisplay(IdentObj id, boolean newValue);
where:
- id
Is an object ID returned by a getObjectID() method (for example, getY1Title()).
- newValue
Can be true or false. If the value is:
true,
the object is imaged.
false, the object is
not imaged.
Return: void;
Example:
setDisplay(getLegendArea(), false);
setY1TitleString("Y1 AXIS TITLE");  setDisplay(getY1Title(), true);  setDisplay(getSubtitle(), false);
setY2TitleString("Y2 AXIS TITLE");  setDisplay(getY2Title(), true);
See getDisplay(), DataTextDisplay, Display3DFloor, Display3DRightWall,
Display3DLeftWall, DualAxisLineDisplay, FootnoteDisplay, FrameDisplay, getStackConnectLine(),
and many other object specific display properties.
x
This method can be used to set
whether or not off scale data points are imaged in a graph.
Syntax:
void setDisplayOffscale(IdentObj id,boolean newValue);
where:
- id
Is an object ID returned by a getObjectID() method (for example, getY1Axis()).
- newValue
Is true or false. If the value is:
true,
the off scale values are imaged.
false, the
offscale values are not imaged.
Return: void;
Example:
setDepthRadius(0);
setDataValue(getSeriesGroup(0,0),100);
setDataRange(0,0,2,2);
setDataTextDisplay(true);  setDisplayOffScale(getY1Axis(),true);
Note: You may also use one of the object-specific properties
to set the off-scale attribute of a specific object (for example,
X1OffScaleDisplay(), Y1OffScaleDisplay(), and so on).
See getDisplayOffScale(), X1OffScaleDisplay, Y1OffScaleDisplay, Y2OffScaleDisplay.
xsetDrawTicksPerpendicular()
When a 2.5D depth affect is applied to a 2D graph with
the DepthAngle and DepthRadius properties and independent tick marks
(not grid lines) are drawn, this method can be used to force the
tick marks to be drawn perpendicular to the axis.
Syntax:
void setDrawTicksPerpendicular(
     IdentObj id,
     boolean newValue)
where:
- id
Is an object ID returned by a getObjectID() method. It must
be one of the tick mark objects (for example, getY1MajorTick()).
- newValue
Is a boolean where a value of
true draws
tick marks perpendicular to axis
false ticks
may be drawn on an angle consistent with the frame
Return: void;
Example:
setGraphType(41);
setY1MajorGridDisplay(false);
setY1MajorTickDisplay(true);
setTickLength(getY1MajorTick(), 2000);  setDrawTicksPerpendicular(getY1MajorTick(),false);
setDrawTicksPerpendicular(getY1MajorTick(),true);
See getDrawTicksPerpendicular().
x
This property can be used to specify an exceptional
riser. An exceptional riser can be manipulated separately (for example,
colored) from other risers in the series.
Syntax:
void setExceptionalRiser();
void setExceptionalRiser(int s, int g);
where:
- s
Is an optional series number.
- g
Is an optional group number.
Return: void;
Example:
setExceptionalRiser(2,1);
setFillType(getExceptionalRiser(2,1),1);
setFillColor(getExceptionalRiser(2,1),new Color(0,255,255));
setDepthRadius(0);
Note: If an object ID (id) is not specified, the exceptional
riser attribute is assigned to the first item in the selection list
(if applicable).
See setNoExceptionalRiser().
x
This method can be used to exclude the maximum label
from an ordinal or numeric axis. You may also use one of the axis-specific
properties to exclude the maximum label.
Syntax:
void setExcludeMaxLabel(IdentObj id,boolean newValue);
where:
- id
Is an object ID returned by a getObjectID() method (for example, getY1Label()).
- newValue
Is true or false. If the value is:
true,
the maximum label is excluded.
false, the
maximum label is included.
Return: void;
Example:
setDepthRadius(0);
setLegendDisplay(false);  setExcludeMaxLabel(getY1Label(),true);
See getExcludeMaxLabel(), getExcludeMinLabel(), setExcludeMinLabel(), O1ExcludeMaxLabel, O2ExcludeMaxLabel, X1ExcludeMaxLabel, Y1ExcludeMaxLabel, Y2ExcludeMaxLabel.
x
This method can be used to exclude the minimum label
on an ordinal or numeric axis.
Syntax:
void setExcludeMinLabel(IdentObj id, boolean newValue);
where:
- id
Is an object ID returned by a getObjectID() method (for example, getO1Label()).
- newValue
Is true or false. If the value is:
true,
the minimum label is excluded.
false, the
minimum label is included.
Return: void;
Example:
setDepthRadius(0);
setLegendDisplay(false);  setExcludeMinLabel(getY1Label(),true);
Note: You may also use one of the axis-specific properties
to exclude the minimum label.
See getExcludeMinLabel(), getExcludeMaxLabel(), setExcludeMaxLabel(), O1ExcludeMinLabel, O2ExcludeMinLabel, X1ExcludeMinLabel, Y1ExcludeMinLabel, Y2ExcludeMinLabel.
x
This method assigns a fill color to an area object.
Syntax:
void setFillColor(new Color (newValue));
void setFillColor(IdentObj id, new Color (newValue));
where:
- id
Is an object ID returned by a getObjectID() method (for example, getChartBackground()).
- newValue
Is the value of the fill color, in one of the following formats:
r,
g, b is the desired intensity of red, green, and blue,
respectively. The values are on a scale of 0 to 255, where 0 is
the least intense and 255 is the most intense.
#hexcolor is
the hexadecimal color code, preceded by a pound sign (#).
Return: void;
Example:
setViewableGroups(3);
setViewableSeries(3);
setDataScrollerPresenceGroups(0);
 setFillColor(getChartBackground(), new Color(255,255,174));
setDepthRadius(0);
or, using a hexadecimal color code:
setViewableGroups(3);
setViewableSeries(3);
setDataScrollerPresenceGroups(0);  setFillColor(getChartBackground(), new Color(#FFFFAE));
setDepthRadius(0);
Note:
- If an object
ID (id) is not specified, newValue is assigned to the first item
in the selection list (if applicable).
- The fill type
must be set to color with setFillType(1);
See getFillColor(), getBorderColor(), setBorderColor(), getFillType(), setFillType(), getTransparentFillColor(), setTransparentFillColor(), setSeriesFillColor().
x
This method assigns a fill type to an area object.
Syntax:
void setFillType(int newValue);
void setFillType(IdentObj id, int newValue);
where:
- id
Is the object ID returned by a getObjectID() method (for
example, getSeries()).
- newValue
Is one of the following fill types:
1 (color)
2 (gradient)
3 (texture)
Return: void;
Example:
setDepthRadius(0);
setGraphType(32);  setFillType(getSeries(0), 1);
setFillColor(getSeries(0), new Color(245,175,224));
setFillType(getSeries(1), 1);
setFillColor(getSeries(1), new Color(140,246,147));
setFillType(getSeries(3), 1);
setFillColor(getSeries(3), new Color(255,255,255));
Note:
- If an object
ID (id) is not specified, newValue is assigned to the first item
in the selection list (if applicable).
- If you select
fill type 2 (gradient), use the setGradientDirection(), setGradientNumPins(),
get/setGradientPinLeftColor(), GradientPinPosition(), setGradientPinRightColor().
If you select fill type 3 (textures), use setTextureURL() and setTextureDisplayMode()
methods to define the texture.
See setGradientDirection(), setGradientNumPins(), setGradientPinLeftColor(), setGradientPinPosition(), setGradientPinRightColor(), setTextureURL(), getTextureDisplayMode(), setTextureDisplayMode().
x
This method assigns a font name to a text object.
Syntax:
void setFontName(IdentObj id, String newValue);
where:
- id
Is an object ID returned by a getObjectID() method (for example, getFootnote()).
- newValue
Is a font name string.
Return: void;
Example:
setFontName(getFootnote(),"TimesRoman"); setFontName(getLegendText(),"Dialog"); setFontName(getSubtitle(),"DialogInput"); setFontName(getTitle(),"Courier");
See getFontName(), getFontSizeVC(), setFontSizeVC(), getFontStyle(), setFontStyle(), setFontSize().
x
This method assigns a font size to a text object. If
absolute font size is disabled for the object (that is, setFontSizeAbsolute(object,
false), you must use setFontSizeVC() to set the object's font size
in virtual coordinates. This method sets the font size in points.
Syntax:
void setFontSize (int newValue);
void setFontSize (IdentObj id, int newValue);
where:
- id
Is an object ID returned by a getObjectID() method (for example, getTitle()).
- newValue
Is a font size value (in points).
Return: void;
Example:
setFontName(getFootnote(),"TimesRoman");
setFontName(getLegendText(),"Dialog");
setFontName(getSubtitle(),"DialogInput");
setFontName(getTitle(),"Courier");  setFontSize(10);
Note:
- If an object
ID (id) is not specified, newValue is assigned to the
first item in the selection list (if applicable).
- This method
disables text autofitting.
- This method
has been replaced by setFontSizeInPoints() when setFontSizeAbsolute()
is set to true for a text object.
See setFontSizeAbsolute(), setFontSizeVC().
x
This method assigns absolute font sizing to a specific
text object. If newValue is set to true, use setFontSizeInPoints()
to set a text object's font size in points. If newValue is set to
false, use setFontSizeVC() to set a text object font size in virtual coordinates.
Note: When PDE is enabled with setPlace(true), add the
setPlaceResize(); command.
Syntax:
void setFontSizeAbsolute(IdentObj id, boolean newValue)
where:
- newValue
Is true or
false.
If the value is:
true, the font size
is absolute. Use setFontSizeInPoints() to set the font size in points.
false,
the font size is not absolute. Use setFontSizeVC() to set the font
size in virtual coordinates.
- id
Is the object ID returned by a getObjectID() method for a
text object (for example, getTitle()).
Return: void;
Example:
setFontSizeAbsolute(getTitle(), true);
setFontSizeInPoints(getTitle(), 14);  setFontSizeAbsolute(getSubtitle(), false);
setFontSizeVC(getSubtitle(), 2000);
setDepthRadius(0);
Note: If an object ID (id) is not specified, newValue
is assigned to the first item in the selection list (if applicable).
See setFontSizeInPoints(), setFontSizeVC(), setPlaceResize().
x
This method assigns a font size to a text object. If
absolute font size is disabled for the object (that is, setFontSizeAbsolute(object,
false), you must use setFontSizeVC() to set the object's font size
in virtual coordinates. This method sets the font size in points.
Syntax:
void setFontSizeInPoints(IdentObj id, int newValue);
where:
- id
Is an object ID returned by a getObjectID() method (for
example, getTitle())
- newValue
Is a font size value in points (1...128). The default value
is 12.
Return:void;
See setFontSizeAbsolute() for
an example.
Note:
- This method
disables text autofitting.
- This method
replaces setFontSize() when setFontSizeAbsolute() is true for a specified
object.
x
This method sets a text object's font size in virtual
coordinates. If font size absolute is enabled with setFontSizeAbsolute(object,
true), you must use setFontSize() to set the font size in points.
This method sets the font size in virtual coordinates.
Syntax:
void setFontSizeVC(IdentObj id, int newValue);
where:
- id
Is an object ID returned by a getObjectID() method (for example, getTitle()).
- newValue
Is the font size in virtual coordinates.
Return: void;
Example:
setAutofit(getFootnote(),false);
setAutofit(getLegendText(),false);
setAutofit(getSubtitle(),false);
setAutofit(getTitle(),false);  setFontSizeVC(getY1Label(),1391);  setFontSizeVC(getLegendText(),1159);  setFontSizeVC(getTitle(),2086);  setFontSizeVC(getO1Label(),927);  setFontSizeVC(getSubtitle(),2086);  setFontSizeVC(getFootnote(),1391);
Note: See Virtual Coordinate System if you need additional information about
the values that can be set by this method. If autofitting is enabled
for the text object, the font size setting will be ignored.
See setFontSizeAbsolute(), getFontSizeVC(), setFontSize().
x
This method assigns a font style
to a text object.
Syntax:
void setFontStyle(IdentObj id, int newValue);
where:
- id
Is an object ID returned by a getObjectID() method (for example, getTitle()).
- newValue
Is the font style (0...7). Values can be:
- 0 = Plain
- 1 = Italic
- 2 = Bold
- 3 = Italic/Bold
- 4 = Underline
- 5 = Italic/Underline
- 6 = Bold/Underline
- 7 = Bold/Italic/Underline
Return: void;
Example:
setViewableGroups(3);
setViewableSeries(3);
setDataScrollerPresenceGroups(0);  setFontStyle(getSubtitle(),2);  setFontStyle(getTitle(),7);
See getFontStyle(), getFontSizeVC(), setFontSizeVC(), getFontName(), setFontName(), setFontSize().
xsetGradientAutoDirectionMode()
This method controls whether gradient direction is automatically
rotated when a chart changes orientation. When enabled, the direction
of gradients are mapped into corresponding or complimentary directions
based on the orientation of the chart. For example, a down gradient
on a vertical bar chart would automatically become a right gradient on
a horizontal bar chart. When disabled, the original gradient direction
remains the same when chart is rotated.
Syntax:
void setGradientAutoDirectionMode(boolean);
where:
- boolean
Is true or false. If the value is:
true,
the gradient direction is automatically rotated.
false,
the gradient direction is retained and not rotated with the chart.
This is the default value.
Return: void;
Example:
setColorMode(1);
setFillType(getSeries(0), 2);
setGradientNumPins(getSeries(0), 2);
setGradientPinPosition(getSeries(0), 0.0,0);
setGradientPinPosition(getSeries(0), 1.0,1);
setGradientPinLeftColor(getSeries(0),new Color(128,128,255), 0);
setGradientPinRightColor(getSeries(0),new Color(128,128,255), 0);
setGradientPinLeftColor(getSeries(0),new Color(128,128,255), 2);
setGradientPinRightColor(getSeries(0),new Color(128,128,255), 2);  setGradientAutoDirectionMode(true);
setGradientDirection(getSeries(0),1);
The chart in the following image shows the same gradient direction
as the previous example, but rotated horizontally.
x
This method sets the direction of a gradient that is
applied to an object.
Syntax:
void setGradientDirection(int newValue);
void setGradientDirection(IdentObj id, int newValue);
where:
- id
Is an object ID returned by a getObjectID() method (for example, getSeries()).
- newValue
Is a gradient direction (1...13, 16, and 17). Values can
be:
1 = right | 9 = radial |
2 = left | 10 = radial/top/left |
3 = down | 11 = radial/top/right |
4 = up | 12 = radial/bottom/left |
5 = down/left | 13 = radial/bottom/right |
6 = up/left | 16 = radial pie |
7 = down/right | 17 = inverted radial pie |
8 = up/right | |
Return: void;
Note:
- If an object
ID (id) is not specified, newValue is assigned to the first item
in the selection list (if applicable).
- The fill type
for the selected object must be set to two with setFillType(2).
See getGradientDirection(), getFillType(), setFillType(), setGradientNumPins(),
setGradientPinLeftColor(),
setGradientPinRightColor(), setGradientPinPosition().
x
This method sets the number of pins in a gradient that
is applied to an object in a graph.
Syntax:
void setGradientNumPins(int newValue);
void setGradientNumPins(IdentObj id, int newValue);
where:
- id
Is an object ID returned by a getObjectID() method (for example, getSeries()).
- newValue
Is the number of pins in the gradient.
Return: void;
Example:
setGraphType(32);
setDepthRadius(0);
setFillType(getSeries(4),2);
setGradientDirection(getSeries(4),1);  setGradientNumPins(getSeries(4),2);
setGradientPinLeftColor(getSeries(4), new Color(0,0,0),1);
setGradientPinLeftColor(getSeries(4), new Color(0,255,255),0);
setGradientPinPosition(getSeries(4),1.0,1);
setGradientPinPosition(getSeries(4),0.0,0);
setGradientPinRightColor(getSeries(4), new Color(0,0,0),1);
setGradientPinRightColor(getSeries(4), new Color(0,255,255),0);
Note:
- If an object
ID (id) is not specified, newValue is assigned to the first item
in the selection list (if applicable).
- The fill type
for the selected object must be set to two with the method setFillType(2).
See getGradientNumPins(), setFillType(), setGradientDirection(), setGradientPinLeftColor(), setGradientPinRightColor(),
setGradientPinPosition().
xsetGradientPinLeftColor()
This method sets the color value of the left pin of
a gradient that is applied to an object in a graph.
Syntax:
void setGradientPinLeftColor(new Color (newValue),int nIndex);
void setGradientPinLeftColor(
     IdentObj id, new Color (newValue), int nIndex);
where:
- id
Is an object ID returned by a getObjectID() method (for example, getSeries()).
- nIndex
0...Number of pins in a gradient.
- newValue
Is the color value of the left pin
in a gradient in one of the following formats:
r,
g, b is the desired intensity of red, green, and blue,
respectively. The values are on a scale of 0 to 255, where 0 is
the least intense and 255 is the most intense.
#hexcolor is
the hexadecimal color code, preceded by a pound sign (#).
Return: void;
Example:
setGraphType(32);
setDepthRadius(0);
setFillType(getSeries(4),2);
setGradientDirection(getSeries(4),1);
setGradientNumPins(getSeries(4),2);  setGradientPinLeftColor(getSeries(4), new Color(0,0,0),1);  setGradientPinLeftColor(getSeries(4), new Color(0,255,255),0);
setGradientPinPosition(getSeries(4),1.0,1);
setGradientPinPosition(getSeries(4),0.0,0);
setGradientPinRightColor(getSeries(4), new Color(0,0,0),1);
setGradientPinRightColor(getSeries(4), new Color(0,255,255),0);
or, using hexadecimal color codes:
setGraphType(32);
setDepthRadius(0);
setFillType(getSeries(4),2);
setGradientDirection(getSeries(4),1);
setGradientNumPins(getSeries(4),2);  setGradientPinLeftColor(getSeries(4), new Color(#000000),1);  setGradientPinLeftColor(getSeries(4), new Color(#00FFFF),0);
setGradientPinPosition(getSeries(4),1.0,1);
setGradientPinPosition(getSeries(4),0.0,0);
setGradientPinRightColor(getSeries(4), new Color(#000000),1);
setGradientPinRightColor(getSeries(4), new Color(#00FFFF),0);
Note:
- If an object
ID (id) is not specified, newValue is assigned to the first item
in the selection list (if applicable).
- The fill type
for the selected object must be set to two with setFillType(2).
See getGradientPinLeftColor(), setFillType(), setGradientDirection(),
setGradientNumPins(),
setGradientPinRightColor(), setGradientPinPosition().
x
This method sets the pin position of a gradient that
is applied to an object in a graph.
Syntax:
void setGradientPinPosition(double newValue,int nIndex);
void setGradientPinPosition(IdentObj id,double newValue, int nIndex);
where:
- id
Is an object ID returned by a getObjectID() method (for example, getO1Label()).
- nIndex
0...Number of pins in gradient.
- newValue
Is the position in the gradient (0.0 to 1.0).
Return: void;
Example:
setFillType(getSeries(4),2);
setGradientDirection(getSeries(4),1);
setGradientNumPins(getSeries(4),2);
setGradientPinLeftColor(getSeries(4), new Color(0,0,0),1);
setGradientPinLeftColor(GetSeries(4), new Color(0,0,255),0);  setGradientPinPosition(getSeries(4),1.0,1);  setGradientPinPosition(getSeries(4),0.0,0);
setGradientPinRightColor(getSeries(4), new Color(0,0,0),1);
setGradientPinRightColor(getSeries(4), new Color(0,0,255),0);
Note:
- If an object
ID (id) is not specified, newValue is assigned to the first item
in the selection list (if applicable).
- The fill type
for the selected object must be set to two with setFillType(2).
See getGradientPinPosition(), setFillType(), setGradientDirection(), setGradientNumPins(),
setGradientPinRightColor(), setGradientPinLeftColor().
xsetGradientPinRightColor()
This method sets the color value of the right pin of
a gradient.
Syntax:
void setGradientPinRightColor(new Color (newValue),int nIndex);
void setGradientPinRightColor(IdentObj id, new Color (newValue), int nIndex);
where:
- id
Is an object ID returned by a getObjectID() method (for example, getSeries()).
- nIndex
0...Number of pins in gradient.
- newValue
Is the color value of the right pin
in a gradient in one of the following formats:
r,
g, b is the desired intensity of red, green, and blue,
respectively. The values are on a scale of 0 to 255, where 0 is
the least intense and 255 is the most intense.
#hexcolor is
the hexadecimal color code, preceded by a pound sign (#).
Return: void;
Example:
setFillType(getSeries(4),2);
setGradientDirection(getSeries(4),1);
setGradientNumPins(getSeries(4),2);
setGradientPinLeftColor(getSeries(4), new Color(0,0,0),1);
setGradientPinLeftColor(GetSeries(4), new Color(0,0,255),0);
setGradientPinPosition(getSeries(4),1.0,1);
setGradientPinPosition(getSeries(4),0.0,0);  setGradientPinRightColor(getSeries(4), new Color(0,0,0),1);  setGradientPinRightColor(getSeries(4), new Color(0,0,255),0);
or, using hexadecimal color codes:
setFillType(getSeries(4),2);
setGradientDirection(getSeries(4),1);
setGradientNumPins(getSeries(4),2);
setGradientPinLeftColor(getSeries(4), new Color(#000000),1);
setGradientPinLeftColor(GetSeries(4), new Color(#0000FF),0);
setGradientPinPosition(getSeries(4),1.0,1);
setGradientPinPosition(getSeries(4),0.0,0);  setGradientPinRightColor(getSeries(4), new Color(#000000),1);  setGradientPinRightColor(getSeries(4), new Color(#0000FF),0);
Note:
- If an object
ID (id) is not specified, newValue is assigned to the first item
in the selection list (if applicable).
- The fill type
for the selected object must be set to two with setFillType(2).
See getGradientPinRightColor(), setFillType(), setGradientDirection(), setGradientNumPins(),
setGradientPinPosition(), setGradientPinLeftColor().
x
This method can be used to set
the number of minor grid lines that will appear between major grid
lines.
Syntax:
void setGridCount(IdentObj id, int newValue);
where:
- id
Is an object ID returned by a getObjectID() method (for example, getO1MinorGrid()).
- newValue
Is the number of grid lines for the axis object.
Return: void;
Example:
setDepthRadius(0);
setDisplay(getO1MinorGrid(), true);
setGridStyle(getO1MinorGrid(), 4);  setGridCount(getO1MinorGrid(), 5);
Note: If an object ID (id) is not specified, newValue
is assigned to the first item in the selection list (if applicable).
See getGridCount(), O1MinorGridCount.
x
This method sets the number
of grid steps to image on a numeric axis.
Syntax:
void setGridStep(IdentObj id, double newValue);
where:
- id
Is an object ID returned by a getObjectID() method (for example, getY1MajorGrid()).
- newValue
Is the number of grid steps on an axis.
Return: void;
Example:
setGraphType(61);  setGridStep(getX1MajorGrid(),20.0);  setGridStep(getY1MajorGrid(),10.0);
setX1MinorGridStepAuto(true);
setX1MajorGridStepAuto(false);
Note:
- You may also
use one of the axis-specific properties to set the number of grid steps
assigned on an axis (for example, X1MajorGridStep, X1MinorGridStep, Y1MajorGridStep,
and so on).
- The value assigned
by this method will be ignored if setGridStepAuto() enables (true)
automatic calculation of grid steps on a particular axis.
See getGridStep(), getGridStepAuto(), setGridStepAuto(), X1MajorGridStep, X1MajorGridStepAuto, X1MinorGridStep, X1MinorGridStepAuto, Y2MajorGridStep, Y2MajorGridStepAuto, Y2MinorGridStep, Y2MinorGridStepAuto, Y1MajorGridStep, Y1MajorGridStepAuto, Y1MinorGridStepAuto.
x
This method enables/disables automatic calculation of
grid steps on a numeric axis.
Syntax:
void setGridStepAuto(IdentObj id, boolean newValue);
where:
- id
Is an object ID returned by a getObjectID() method (for example, getY1MajorGrid()).
- newValue
Is true or false. If the value is:
true,
grid steps are automatically calculated.
false,
grid steps are not automatically calculated.
Return: void;
Example:
setGraphType(61);
setX1MajorGridStep(20.0);
setY1MinorGridStep(5.0);
setY1MajorGridStep(10.0);  setGridStepAuto(getX1MinorGrid(),true);  setGridStepAuto(getY1MinorGrid(),false);  setGridStepAuto(getX1MajorGrid(),false);  setGridStepAuto(getY1MajorGrid(),true);

Note:
- You may also
use one of the axis-specific properties to set whether or not grid steps
are automatically calculated on an axis (for example, X1MajorGridStepAuto, X1MinorGridStepAuto,
Y1MajorGridStepAuto, and so on).
- If this method
sets a value of true, any value assigned by setGridStep() will be ignored.
See getGridStepAuto(), getGridStep(), setGridStep(), X1MajorGridStepAuto, X1MinorGridStepAuto, Y2MajorGridStepAuto, Y2MinorGridStepAuto, Y1MajorGridStepAuto, Y1MinorGridStepAuto.
x
This method selects the style of grids on an axis.
Syntax:
void setGridStyle(IdentObj id,int newValue);
where:
- id
Is an object ID returned by a getObjectID() method (for example, getX1MajorGrid()).
- newValue
Is a grid style (0...5). Values can be:
- 0 = No Grid
- 1 = Normal Grid
- 2 = Grid and
Ticks
- 3 = Inner Ticks
- 4 = Outer Ticks
- 5 = Spanned
Ticks
Return: void;
Example:
setY1MinorGridDisplay(true);
setGraphType(61);
setX1MajorGridStep(20.0);
setY1MinorGridStep(5.0);
setY1MajorGridStep(10.0);
setY1MinorGridStepAuto(false);
setX1MajorGridStepAuto(false);  setGridStyle(getX1MinorGrid(),0);  setGridStyle(getX1MajorGrid(),1);  setGridStyle(getY1MinorGrid(),2);  setGridStyle(getY1MajorGrid(),4);
See getGridStyle(), O1MajorGridStyle, O1MinorGridStyle, X1MajorGridStyle, X1MinorGridStyle, Y1MajorGridStyle, Y1MinorGridStyle, Y2MajorGridStyle, Y2MinorGridStyle.
x
This method can be used to define group labels.
Syntax:
void setGroupLabel(IdentObj id, String newValue);
void setGroupLabel(int g, String newValue);
where:
- id
Is an object ID returned by a getObjectID() method (for example, getGroup(0)).
- g
Is a group number.
- newValue
Is a group label string.
Return: void;
Example:
setDepthRadius(0);  setGroupLabel(0,"Fish");  setGroupLabel(1,"Birds");  setGroupLabel(2,"Cats");  setGroupLabel(3,"Puppies");  setGroupLabel(4,"Parrots");  setGroupLabel(5,"Spiders");
setTitleString("Jake's Pet Store");
See getDataLabel(), setDataLabel(), getSeriesLabel(), setSeriesLabel().
x
This method can be used to ignore (do not draw) a particular
series in a graph.
Syntax:
void setIgnoreSeries(IdentObj id, boolean newValue);
void setIgnoreSeries(int seriesID, boolean newValue);
where:
- id
Is an object ID returned by a getObjectID() method (for example, getSeries(1)).
- seriesID
Is a series number.
- newValue
Is true or false. If the value is:
true,
the identified series (s) is ignored (not drawn).
false,
the identifed series (s) is restored (drawn).
Return: void;
Example:
setDepthRadius(0); setIgnoreSeries(2,true);
setIgnoreSeries(2,false);
x
This method defines the inset
of an annotation, title box, subtitle box, or footnote box object.
Syntax:
void setInset(IdentObj anObject, int theInsets)
void setInset(IdentObj anObject, Insets theInsets)
where:
- anObject
Is an Object ID returned by a getObject() method.
- theInset
Is a uniform inset for all sides of an object.
Return: void;
Note: Currently supported objects include: an annotation
object (for example, getAnnotationBox(0)), the title box object
(that is, getTitleBox()), the subtitle box object (that is, getSubtitleBox()),
or the footnote box object (that is, getFootnoteBox()).
See getInsets().
x
These methods set the top/bottom and right/left insets
of borders of a specified object. The default value is 1 (which
is essentially off).
Syntax:
setBottomInset(IdentObj idObj, int newValue);
setLeftInset(IdentObj idObj, int newValue);
setRightInset(IdentObj idObj, int newValue);
setTopInset(IdentObj idObj, int newValue);
where:
- idObj
Is the object ID returned by getAnnotationBox(), getBeveledLegend(), getBeveledLegendMarker(),
getBeveledRiser(), getFootnoteBox(), getSubtitleBox(), or getTitleBox().
- newValue
Is the inset of the border in virtual coordinates.
Return: void;
Example:
setDepthRadius(0);
setGraphType(41);
setDisplay(getFootnoteBox(), true);
setBorderType(getFootnoteBox(), 2);
setTopInset(getFootnoteBox(), 250);
setLeftInset(getFootnoteBox(), 250);
setBottomInset(getFootnoteBox(), 250);
setRightInset(getFootnoteBox(), 250);
setFillColor(getFootnoteBox(), new Color(255,255,0));
See Beveled Borders.
x
This method enables/disables staggered labels on an axis.
Syntax:
void setLabelStagger(IdentObj id, boolean newValue);
where:
- id
Is an object ID returned by a getObjectID() method (for example, getO1Label()).
- newValue
Is true or false. If the value is:
true ,
labels are staggered.
false, labels are not staggered.
Return: void;
Example:
setDepthRadius(0);
setGroupLabel(0,"Fish");
setGroupLabel(1,"Birds");
setGroupLabel(2,"Cats");
setGroupLabel(3,"Puppies");
setGroupLabel(4,"Parrots");
setGroupLabel(5,"Spiders");  setLabelStagger(getO1Label(),true);
setTitleString("Jake's Pet Store");
Note:
- If an object
ID (id) is not specified, newValue is assigned to the first item
in the selection list (if applicable).
- You may also
use one of the axis-specific properties to set whether or not labels are
staggered on a particular axis (for example, X1LabelStagger, Y1LabelStagger, Y2LabelStagger,
and so on).
See getLabelStagger(), O1LabelStagger, X1LabelStagger, Y1LabelStagger, Y2LabelStagger.
x
You can select the position of the legend on your graph
using setLegendPosition.
The code has been written so that additional presets can be
added later if desired (for example place the legend inside the
chart in the upper right corner). These positions are independent
of Place Default Elements (PDE).
PDE should fix positioning issues. The user can define the legend
rectangle by calling setLegendAutomatic(false) which instructs the
legend engine to leave it alone. Similarly, calling setLegendPosition(-1)
tells the legend engine to leave the legend's position alone.
Syntax:
setLegendPosition (value);
where:
- value
Is one of the following:
- FREE FLOAT =
-1;
- AUTO = 0;
- BOTTOM = 1;
- RIGHT = 2;
- LEFT = 3;
- TOP = 4;
- RIGHT TOP =
5;
- RIGHT BOTTOM
= 6;
- LEFT TOP = 7;
- LEFT BOTTOM
= 8;
- BOTTOM LEFT
= 9;
- BOTTOM RIGHT
= 10;
- TOP LEFT = 11;
- TOP RIGHT =
12;
See Setting the Legend Position for examples of all the legend positions.
x
This method sets the size and location of the legend
rectangle. This rectangle is the area in the graph where legend
markers and labels are drawn.
Syntax:
void setLegendRect(Rectangle newValue);
void setLegendRect(Rectangle newValue,boolean bSetRecalc);
where:
- newValue
Is the location/size of the legend area.
- bSetRecalc
Is true or false. If the value is:
true,
the entire graph is recalculated based on the new legend rectangle.
false ,
the graph is not recalculated.
Return: void;
Example:
setGraphType(69); setLegendRect(new Rectangle(-15340,-3478,4948,18550));
See getLegendRect(), LegendAutomatic, LegendDisplay, LegendMarkerPosition, LegendReverse.
x
When a Time Scale Axis is defined, this method applies
a border color to a specified level.
Syntax:
void setLevelBorderColor(int level, Color color)
void setLevelBorderColor(IdentObj id, Color color)
where:
- level
Is an integer between 0 and 2.
- id
Is the object ID of a time scale axis level (that is, getTimeScaleLevel(n);)
- color
Is the border color to be assigned to the specified level
(for example, new Color (255,0,0)).
Return: void;
setLevelBorderColor(getTimeScaleLevel(1), new Color (255,0,0));
setLevelBorderColor(getTimeScaleLevel(0), new Color (0,255,0));
setLevelBorderColor(getTimeScaleLevel(2), new Color (0,0,255));
Note:
- A time scale
axis can only be defined in clustered bar, stacked bar, line, and scatter
graphs.
- See UseTimeScaleAxis
for the data that was used to create the example graph.
See Time Scale Axis Graphs.
x
When a Time Scale Axis is defined and setLevelTextFormat()
assigns FORMAT_RAW (3) to a level, this method defines a date format
string to be used on a specified level.
Syntax:
void setLevelDateFormat(int level, String format)
void setLevelDateFormat(IdentObj id, String format)
where:
- level
Is an integer between 0 and 3.
- id
Is the object ID of a time scale axis level (that is, getTimeScaleLevel(n);).
- format
Is a string of standard Java SimpleDateFormat codes which
is described in the following table.
Format | Description |
|---|
G = | Era Designation (for example, AD) |
y = | Year (for example, 2004, 04) |
M = | Month in year (e.g, March, Mar., 03) |
w = | Week in year (for example,1...52) |
W = | Week in month (for example, 2) |
D = | Day in year (for example, 1...365) |
d = | Day in month (for example, 10) |
F = | Day of week in month (for example, 2) |
E = | Day in week (for example, Tuesday, Tue) |
a = | AM/PM Marker (for example, PM) |
H = | Zero-Based Hour in day (for example, 0...23) |
k = | Hour in day (for example, 1...24) |
K = | Zero-Based Hour in AM/PM (for example, 0...11) |
h = | Hour in AM/PM (for example, 1...11) |
m = | Minute in hour (for example, 30) |
s = | Second in minute (for example, 55) |
S = | Millisecond (for example, 978) |
z = | General Time Zone (for example, Pacific
Standard Time, PST, GMT-08:00 |
Z = | RFC 822 Time Zone (for example, -0800) |
Return: void;
Note: A time scale axis can only be defined in clustered
bar, stacked bar, line, and scatter graphs.
See getLevelDateFormat() and Time Scale Axis Graphs.
x
When a Time Scale Axis is defined, this method assigns
a fill color to a specified level.
Syntax:
void setLevelFillColor(IdentObj id, Color color)
void setLevelFillColor(int level, Color color)
where:
- id
Is the object ID of a time scale axis level (that is, getTimeScaleLevel(n);)
- level
Is an integer between 0 and 2.
- color
Is the fill color to be assigned to the specified level (for
example, new Color (255,0,0)).
Return: void;
Note: A time scale axis can only be defined in clustered
bar, stacked bar, line, and scatter graphs.
See getLevelFillColor() and Time Scale Axis Graphs.
x
When a Time Scale Axis is defined, this method assign
a height to a specified level.
Syntax:
void setLevelHeight(int level, int height)
void setLevelHeight(IdentObj id, int height)
where:
- level
Is an integer between 0 and 2.
- id
Is the object ID of a time scale axis level (that is, getTimeScaleLevel(n);).
- height
Is the level height in virtual coordinates.
Return: void;
Note: A time scale axis can only be defined in clustered
bar, stacked bar, line, and scatter graphs.
See getLevelHeight() and Time Scale Axis Graphs.
x
When a Time Scale Axis is defined, this method assigns
an interval to a specified level. The level intervals must be set
in decreasing order. The level zero interval must be less than level
one, and level one must be less than level two.
Syntax:
void setLevelInterval(int level, int interval)
void setLevelInterval(IdentObj id, int interval)
where:
- level
Is an integer between 0 and 2.
- id
Is the object ID of a time scale axis level (that is, getTimeScaleLevel(n);).
- interval
Is an integer between 0 and 8.
TIME_INTERVAL_UNDEFINED = 0
TIME_INTERVAL_SECONDS = 1
TIME_INTERVAL_MINUTES = 2
TIME_INTERVAL_HOURS = 3
TIME_INTERVAL_DAYS = 4
TIME_INTERVAL_WEEKS = 5
TIME_INTERVAL_MONTHS = 6
TIME_INTERVAL_QUARTERS = 7
TIME_INTERVAL_YEARS = 8
Return: void;
Note: A time scale axis can only be defined in clustered
bar, stacked bar, line, and scatter graphs.
See getLevelInterval() and Time Scale Axis Graphs.
x
When a Time Scale Axis is defined, this method assigns
a color to the text objects at a specified level.
Syntax:
void setLevelTextColor(int level, Color color)
void setLevelTextColor(IdentObj id, Color color)
where:
- level
Is an integer between 0 and 2.
- id
Is the object ID of a time scale axis level (that is, getTimeScaleLevel(n);).
- color
Is the text color to be assigned to the specified level (for
example, new Color (255,0,0)).
Return: void;
Example:
setLevelBorderColor(getTimeScaleLevel(1), new Color (255,0,0));
setLevelBorderColor(getTimeScaleLevel(0), new Color(0,255,0));
setLevelBorderColor(getTimeScaleLevel(2), new Color(0,0,255));
setLevelTextColor(getTimeScaleLevel(1),new Color (255,0,0));
setLevelTextColor(getTimeScaleLevel(0),new Color(0,255,0));
setLevelTextColor(getTimeScaleLevel(2),new Color(0,0,255));
Note:
- A time scale
axis can only be defined in clustered bar, stacked bar, line, and scatter
graphs.
- See UseTimeScaleAxis
for the data that was used to create the example graph.
See Time Scale Axis Graphs.
x
This method defines the format of text that is drawn
to a specified level on a time scale axis.
Syntax:
void setLevelTextFormat(int level, int format)
void setLevelTextFormat(IdentObj id, int format)
where:
- level
Is an integer between 0 and 2.
- id
Is the object ID of a time scale axis level (that is, getTimeScaleLevel(n);).
- format
Is an integer between 0 and 2.
IIntervalScale.FORMAT_SHORT
= 0IIntervalScale.FORMAT_MEDIUM = 1IIntervalScale.FORMAT_LONG =
2IIntervalScale.FORMAT_RAW = 3
The format in which text is drawn depends on the level interval
set by setLevelInterval(). The following table shows how each text
format is represented for each level:
If FORMAT_RAW (setLevelTextFormat(getTimeScaleLevel(1), 3)) is
used, you can specifically define how date and time text is formatted
using setLevelDateFormat() and the standard Java SimpleDateFormat
codes.
Return: void;
Note: A time scale axis can only be defined in clustered
bar, stacked bar, line, and scatter graphs.
See getLevelTextFormat(), setLevelDateFormat(),
and Time Scale Axis Graphs.
x
This method defines which BasicStroke to create using
Java2D BasicStroke constructors.
Syntax:
void setLineBasicStrokeType(IdentObj id, int newValue)
where:
- id
Is the object ID of a line object returned by a getObject()
method (that is, getY1MajorGrid()).
- newValue
Can be one of the following values:
0 = Do not use
Java2D. Draw line with regular JDK 1.1.8 code.
1 = Use Java2D
BasicStroke() which constructs a new BasicStroke with defaults for
all attributes.
2 = Use Java2D BasicStroke(float width) which
constructs a solid BasicStroke with the specified line width and
default values for the cap and join styles.
3 = Use Java2D
BasicStroke(float width, int cap, int join) which constructs a solid BasicStroke
with the specified attributes.
4 = Use Java2D BasicStroke(float
width, int cap, int join, float miterlimit) which constructs a solid
BasicStroke with the specified attributes.
5 = Use Java2D
BasicStroke(float width, int cap, int join, float miterlimit, float[] dash,
float dash_phase) which constructs a new BasicStroke with the specified attributes.
See setLineCap() and setLineJoin() for examples.
Also see getLineBasicStrokeType(),
setLineDash(), setLineDashPhase(), setLineMiterLimit().
x
When setLineBasicStrokeType() is set to a value greater
than zero to use the Java2D BasicStroke object, this method assigns
an end cap style to a specified line object.
Syntax:
void setLineCap(IdentObj id, int newValue)
where:
- id
Is the object ID of a line object returned by a getObject()
method (that is, getY1MajorGrid()).
- newValue
Defines the decoration to be applied to the ends of unclosed
subpaths and dash segments of a specified line as defined by the
Java 2D BasicStroke object (for example, CAP_BUTT, CAP_ROUND or
CAP_SQUARE).
Return: void;
Example:
setLineBasicStrokeType(getO1MajorGrid(), 5);
setLineWidth(getO1MajorGrid(), 3);  setLineCap(getO1MajorGrid(), BasicStroke.CAP_SQUARE);
Note: See the java.awt.BasicStroke constructors for constants
that can be specified in NewValue.
See getLineCap(), setLineBasicStrokeType().
x
When setLineBasicStrokeType() is set to a value greater
than zero to use the Java2D BasicStroke object, this method applies
a dash pattern to a specified line object. Use setLineDashPhase()
to specify the offset to start the dashing pattern.
Syntax:
void setLineDash(IdentObj id, Vector vectDashFloat)
where:
- id
Is the object ID of a line object returned by a getObject()
method (that is, getY1MajorGrid()).
- Vector
Is a vector (java.lang.Float) of floating point numbers that
defines the dash pattern.
Return: void;
See getLineDash(), setLineBasicStrokeType(), setLineDashPhase().
x
When setLineBasicStrokeType() is set to a value greater
than zero to use the Java2D BasicStroke object and a line dashing
pattern has been specified with setLineDash(), this method defines
the offset to start the dashing pattern for a specified line object.
Syntax:
void setLineDashPhase(IdentObj id, float fNewValue)
where:
- id
Is the object ID of a line object returned by a getObject()
method (that is, getY1MajorGrid()).
- fNewValue
Is the offset to start the dashing pattern.
Return: void;
See getLineDashPhase(), setLineBasicStrokeType(), setLineDash().
x
When setLineBasicStrokeType() is set to a value greater
than zero to use the Java2D BasicStroke object, this method defines
the decoration to be applied to the line object where line path
segments meet.
Syntax:
void setLineJoin(IdentObj id, int newValue)
where:
- id
Is the object ID of a line object returned by a getObject()
method (that is, getY1MajorGrid()).
- NewValue
Is the decoration applied where path segments meet (for example, JOIN_ROUND,
JOIN_BEVEL, or JOIN_MITER).
Return: void;
Example:
setLineBasicStrokeType(getO1MajorGrid(), 3);
setLineWidth(getO1MajorGrid(), 3);
setLineCap(getO1MajorGrid(), BasicStroke.CAP_ROUND);   setLineJoin(getO1MajorGrid(), BasicStroke.JOIN_BEVEL);
Note: See the java.awt.BasicStroke constructors for constants
that can be specified in NewValue.
See getLineJoin(), setLineBasicStrokeType().
x
When setLineJoin() applies JOIN_MITER to a line object,
this method defines the limit to trim the miter join.
Syntax:
void setLineMiterLimit(IdentObj id, float fNewValue)
where:
- id
Is the object ID of a line object returned by a getObject()
method (that is, getY1MajorGrid()).
- fNewValue
Is the limit to trim the miter join. The miterlimit must
be greater than or equal to 1.0f.
Return: void;
Example:
setLineBasicStrokeType(getO1MajorGrid(), 4);
setLineBasicStrokeType(getO1MajorGrid(), 3);
setLineWidth(getO1MajorGrid(), 3);
setLineCap(getO1MajorGrid(), BasicStroke.CAP_ROUND);
setLineJoin(getO1MajorGrid(), BasicStroke.JOIN_MITER);  setLineMiterLimit(getO1MajorGrid(), 10.0f);
See getLineMiterLimit(), setLineJoin().
xsetLineStyleLegendMarkers()
This method sets Line Style to the Legend Marker. When
creating a line chart using the various marker shapes (square, circle,
star, and so on), these marker shapes are now represented in corresponding
legend markers. This is helpful in visually mapping the line segment
to the legend entry.
Syntax:
setLineStyleLegendMarkers(value);
where:
- value
Can be one of the following values:
0 =
No Line Style Markers. This value is the default.
1 =
Line Style Markers.
2 = Line Style and Markers.
3 =
Automatic Marker Style.
Examples:
setLineStyleLegendMarkers(1);
setMarkerShape(getSeries(0),1);
setMarkerShape(getSeries(1),2);
setLineStyleLegendMarkers(2);
setMarkerShape(getSeries(0),1);
setMarkerShape(getSeries(1),2);
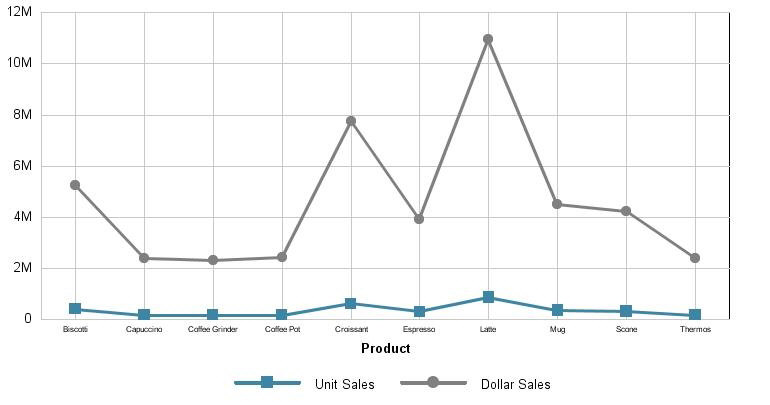
setLineStyleLegendMarkers(3);
setNullLegendMarkerShapesAsSquares(false);
setMarkerShape(getSeries(0),1);
setMarkerShape(getSeries(1),0);
Note: setNullLegendMarkerShapesAsSquares(false); must
be used with this setting in order for it to work properly.
See NullLegendMarkerShapesAsSquares.
x
This method defines the thickness (in pixels) of a line
object.
Syntax:
void setLineWidth(IdentObj id,int newValue);
void setLineWidth(int newValue);
where:
- id
Is an object ID returned by a getObjectID() method (for example,
getSeries ()).
- newValue
Is the line width in pixels.
Return: void;
Example:
setGraphType(67); setLineWidth(getSeries(3),10); setLineWidth(getSeries(1),10);
Note: If an object ID (id) is not specified, newValue
is assigned to the first item in the selection list (if applicable).
See getLineWidth(), setLineWidthAllSeries().
x
This method assigns equal line widths for all series
in a graph.
Syntax:
void setLineWidthAllSeries(int newValue)
where:
- newValue
Is the line width in pixels.
Return: void;
Example:
setDepthAngle(0);
setDepthRadius(0);
setLineWidthAllSeries(10);
setGraphType(41);
x
This method selects logarithmic or linear scale on an
axis.
Syntax:
void setLogScale(IdentObj id,boolean newValue);
where:
- id
Is an object ID returned by a getObjectID() method (for example, getY1Axis()).
- newValue
Is true or false. If the value is:
true,
a logarithmic scale is used.
false, a linear
scale is used.
Return: void;
Example:
setDepthRadius(0);
setY1MinorGridStep(0.5);
setY1MajorGridStep(1.0);
setY1MinorGridStepAuto(true);
setY1MajorGridStepAuto(true);  setLogScale(getY1Axis(),true);
setY1ScaleMaxAuto(true);
setY1ScaleMinAuto(true);
setY1MustIncludeZero(false);
Note: You may also use one of the axis-specific properties
to select a logarithmic or linear scale (for example, X1LogScale,
Y1LogScale, Y2LogScale, and so on).
See setLogScaleBase(), X1LogScale, Y1LogScale, Y2LogScale.
x
When logarithmic scaling is used on a numeric axis,
this method sets the lowest/base value drawn on the axis.
Syntax:
void setLogScaleBase(IdentObj id, double newValue)
where:
- newValue
Is a log scale base value.
- id
Is an object ID returned by a getObjectID() method (for example, getY1Axis()).
Return: void;
Example:
setDepthAngle(0);
setDepthRadius(0);
setY1LogScale(true);  setLogScaleBase(getY1Axis(), 40);
See getLogScale(), getLogScaleBase(), setLogScale().
x
This method sets the shape of a marker.
Syntax:
void setMarkerShape(int integerMarkerShape);
void setMarkerShape(IdentObj id,int integerMarkerShape);
where:
- id
Is an object ID returned by a getObjectID() method (for example, getSeries(1)).
- integerMarkerShape
Is a value from 0...18, producing one of the following shapes:
1 | 2 | 3 | 4 | 5 | 6 | 7 | 8 | 9 |

| 
| 
| 
| 
| 
| 
| 
| 
|
10 | 11 | 12 | 13 | 14 | 15 | 16 | 17 | 18 |

| 
| 
| 
| 
| 
| 
| 
| 
|
Note: The value 0 is for no marker shape.
Return: void;
Example:
setDepthRadius(0);
setDepthAngle(0);
setGraphType(61);
setMarkerSizeDefault(60);  setMarkerShape(getSeries(0), 6);
Note: If an object ID (id) is not specified, newValue
is assigned to the first item in the selection list (if applicable).
See getMarkerShape(), getMarkerSize(), setMarkerSize(), getMarkerTemplate(), MarkerDisplay, MarkerSizeDefault.
x
This method sets the size of markers in a graph.
Syntax:
void setMarkerSize(int newValue);
void setMarkerSize(IdentObj id, int newValue);
void setMarkerSize(int seriesID,int newValue);
void setMarkerSize(int seriesID,int groupID,int newValue);
where:
- seriesID
Is a series number.
- groupID
Is a group number.
- id
Is an object ID returned by a getObjectID() method (for example, getSeries(1)).
- newValue
Is a value (0...100) that represents the size of a marker.
Return: void;
Example:
setGraphType(61);  setMarkerSize(0,60);
setMarkerShape(0,6);  setMarkerSize(1,60);
setMarkerShape(1,5);  setMarkerSize(2,60);
setMarkerShape(2,4);  setMarkerSize(3,60);
setMarkerShape(3,3);  setMarkerSize(4,60);
setMarkerShape(4,2);  setMarkerSize(5,60);
setMarkerShape(5,1);
Note: If an object ID (id), series number (seriesID),
or group number (groupID) is not specified, newValue is assigned
to the first item in the selection list (if applicable).
See getMarkerSize(), getMarkerShape(), setMarkerShape(), MarkerDisplay, MarkerSizeDefault.
x
The following method can be used to set the maximum
number of annotations.
Syntax:
void setMaxNumAnnotations(int newValue);
where:
- newValue
Is a value in the range 0...999.
For annotations in excess of the default (30), the setTransparentFillColor()
and setTransparentBorderColor() methods should be used to set transparent
fill and border colors for the associated annotation box as desired:
- setTransparentFillColor(getAnnotationBox(nnn),
true | false);
- setTransparentBorderColor(getAnnotationBox(nnn),
true | false);
x
This method can be used to prohibit the use of exceptional
risers in a graph.
Syntax:
void setNoExceptionalRiser();
Return: void;
See setExceptionalRiser().
x
This method enables/disables a non-zero baseline on
a numeric axis in a graph. You must use setNonZeroBaselineValue()
to define the location of the non-zero baseline. When this method
enables (true) the non-zero baseline and a baseline value is defined,
risers with values greater than the baseline value draw up from
the baseline; risers with values less than the baseline value draw
down from the baseline.
Syntax:
void setNonZeroBaseline(IdentObj id, boolean newValue)
where:
- newValue
Is true or false. If the value is:
true,
the baseline is non-zero.
false, the baseline
is the default (0).
- id
Is an object ID of a numeric axis returned by a getObjectID()
method (for example, getY1Axis()).
Return: void;
Example:
setDepthAngle(0);
setDepthRadius(0);  setNonZeroBaseline(getY1Axis(),true);
setNonZeroBaselineValue(getY1Axis(),10);
See getNonzeroBaselineValue(), getNonZeroBaseline(), setNonZeroBaselineValue().
xsetNonZeroBaselineValue()
When setNonZeroBaseline() enables a non-zero baseline,
this method defines the location of the non-zero baseline. When
a non-zero baseline value is defined with this method, risers with
values greater than the baseline value draw up from the baseline; risers
with values less than the baseline value draw down from the baseline.
Syntax:
void setNonZeroBaselineValue(IdentObj id, double fValue)
where:
- id
Is an object ID of a numeric axis returned by a getObjectID()
method (for example, getY1Axis()).
- fValue
Is a new non-zero value.
Return: void;
Example:
setDepthAngle(0);
setDepthRadius(0);
setNonZeroBaseline(getY1Axis(),true);  setNonZeroBaselineValue(getY1Axis(),20);
See getNonZeroBaseline(), setNonZeroBaseline(), getNonzeroBaselineValue().
x
This method deselects all objects in the selection list.
Syntax:
void setNoSelection()
Return: void;
x
This method enables the pie breakout mode. Pie slices
that are equal to or greater than a specific user assigned percentage
are grouped together in one slice. The group is then displayed in
a stacked bar associated with that slice. This mode is useful when the
focus is on pie slices with larger values.
Syntax:
void setPieBreakoutMode(boolean);
where:
- true
Enables the pie breakout mode.
- false
Disables the pie breakout mode. This value is the default.
Return: void;
See setPieBreakoutPercentage().
xsetPieBreakoutPercentage()
This method is used to allow a certain percentage of
a pie to be grouped and shown in detail using a bar.
Syntax:
void setPieBreakoutPercentage(n);
where:
n is a value between 0 to 100 that sets
the percentage that is used as the threshold. The default value
is 5 (5%).
Slices that represent a percentage that is below the set threshold
get aggregated into one slice referred to as OTHER. Slices that
represent a percentage that is equal to or above the set threshold
get aggregated into a second slice, referred to as a breakout slice,
and are also shown in detail in the accompanying legend.
Example:
setPieBreakoutMode(true);  setPieBreakoutPercentage(9);
setFillColor(getSeries(-2),new Color(0,119,227));
setFillColor(getSeries(-1),new Color(179,255,191));
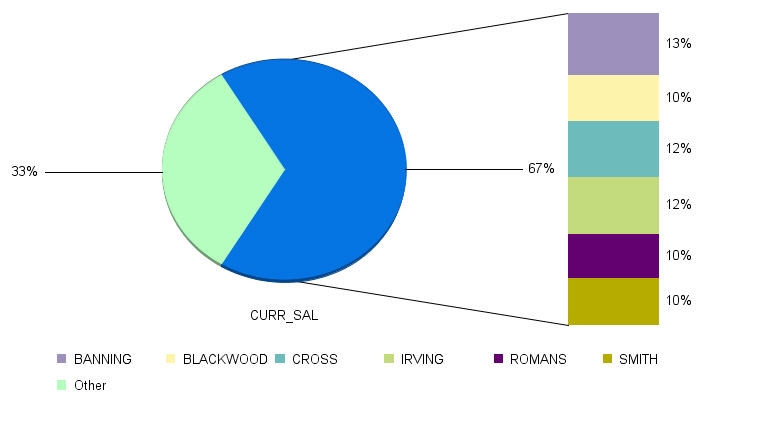
See setPieBreakoutMode() and setFillColor().
x
This method can be used to delete a slice from a pie graph.
Syntax:
void setPieSliceDelete(IdentObj id, boolean newValue);
void setPieSliceDelete(int seriesID, boolean newValue);
void setPieSliceDelete(int seriesID,
int groupID,boolean newValue);
where:
- id
Is object ID returned by a getObjectID() method (for example,
getSlice ()).
- seriesID
Is a series number.
- groupID
Is a group number.
- newValue
Is true or false. If the value is:
true,
the slice is deleted.
false, the slice is
not deleted.
Return: void;
Example:
setPieSliceDelete(getSeries(3),true);  setPieSliceDelete(getSeriesGroup(3,0),true);  setPieSliceDelete(getSeries(0),false);  setPieSliceDelete(getSeriesGroup(0,0),false);
setPieSliceDetach(getSeries(0),100);
setPieSliceDetach(getSeriesGroup(0,0),100);
See getPieSliceDelete(), getPieSliceDetach(), setPieSliceDetach(), restoreAllSlices().
x
This method detaches a slice from a pie graph by a specified
distance.
Syntax:
void setPieSliceDetach(IdentObj id, boolean newValue);
void setPieSliceDetach(int seriesID, boolean newValue);
void setPieSliceDetach(int seriesID, int groupID, int newValue);
where:
- seriesID
Is a series number.
- groupID
Is a group number.
- newValue
Is a distance (0...100) to detach slice.
Return: void;
Example:
setPieSliceDelete(getSeries(3),true);
setPieSliceDelete(getSeriesGroup(3,0),true);
setPieSliceDelete(getSeries(0),false);
setPieSliceDelete(getSeriesGroup(0,0),false);  setPieSliceDetach(getSeries(0),100);  setPieSliceDetach(getSeriesGroup(0,0),100);
x
When the automatic graph layout manager is enabled with
setPlace(true), this method defines whether or not horizontal alignment
of a specified graph object is allowed. The default value is 1 (allow
horizontal alignment of all graph objects).
Syntax:
void setPlaceAlign(IdentObj id, int newValue)
where:
- id
Is an object ID of a text object returned by a getObjectID()
method (for example, getTitle(), getO1Label(), etc.).
- newValue
Is one of the following values:
0,
do not allow horizontal alignment of the specified graph object.
1,
allow horizontal alignment of the specified graph object.
Return: void;
Note:
- All getPlace...()
and setPlace...() methods are only valid when the automatic graph
layout manager has been enabled with setPlace(true).
- The value assigned
to the specified object will only be used if the automatic graph layout
manager determines that realignment is needed to produce a better
graph layout.
See Place, getPlaceAlign().
x
When the automatic graph layout manager is enabled with
setPlace(true), this function will add a margin around the entire
graph as defined by the rectangle parameter. The default is new
Rectangle (-15500, -15500, 24000, 31000).
Syntax:
void setPlaceMargin(Rectangle newValue)
where:
- newValue
Is 4 values specifying x, y, width, & height of rectangle
in virtual coordinates (e.g, new Rectangle (-15500, -15500, 24000,
31000).
Return:void;
Note: All getPlace...() and setPlace...() methods are
only valid when the automatic graph layout manager has been enabled
with setPlace(true).
See Place, getPlaceMargin().
xsetPlaceMaxNumWordWrapLines()
When the automatic graph layout manager is enabled with
setPlace(true) and word wrapping is enabled with setPlaceWordWrap(1),
this method defines the maximum number of lines that can be used
when a specified label object is word wrapped.
Syntax:
void setPlaceMaxNumWordWrapLines(IdentObj id, int newValue)
where:
- id
Is the object ID of a text object returned by a getObjectID()
method like get O1Label()).
- newValue
Is the maximum number of lines to use for word wrapping.
Return: void;
Note:
- All getPlace...()
and setPlace...() methods are only valid when the automatic graph
layout manager has been enabled with setPlace(true).
- The value assigned
to the specified object will only be used if the automatic graph layout
manager determines that word wrapping is needed to produce a better
graph layout.
See Place, getPlaceMaxNumWordWrapLines(), setPlaceWordWrap().
x
When the automatic graph layout manager is enabled with
setPlace(true) and resizing of an object is enabled with setPlaceResize(1),
this method defines the minimum font size (in points) that can be
used to resize a specified text object.
Syntax:
void setPlaceMinFontSize(IdentObj id, int newValue)
where:
- id
Is an object ID returned by a getObjectID() method for a
text object (for example, getFootnote(), getO1Label(), etc.).
- newValue
Is the minimum font size in points (4...96). The default
value is 4.
Return: void;
Example:
restoreDefaults();
setGroupLabel(getGroup(0), "Long group0 label");
setGroupLabel(getGroup(1), "Longer group1 label");
setGroupLabel(getGroup(2), "Longer, Longer group2 label");
setGroupLabel(getGroup(3), "Longer, Longer,
     Longer group3 label");
setGroupLabel(getGroup(4), "Longer, Longer,
     Longer, Longer, group4 label");
setDisplay(getY1Title(),true);
setDisplay(getO1Title(),true);
setTextString(getY1Title(),"Y1");
setTextString(getO1Title(),"O1");
setPlaceSkip(getO1Label(),0);
setFontSizeAbsolute(getO1Label(), true);
setFontSize(getO1Label(),10);
 setPlaceMinFontSize(getO1Label(), 10);
setPlaceRect(getPlaceVertO1LabelsTitle(),
     new Rectangle(-14000, -15500, 29000, 24000));
setPlaceRotate(getO1Label(),1);
setTextJustVert(getO1Label(),0);
setDataRange(0,0,1,4);
setPlace(true);
setDepthRadius(0);
setFootnoteDisplay(false);
Note:
- All getPlace...()
and setPlace...() methods are only valid when the automatic graph
layout manager has been enabled with setPlace(true).
- The value assigned
to the specified object will only be used if the automatic graph layout
manager determines that font resizing is needed to produce a better
graph layout.
See Place, getPlaceMinFontSize().
x
When the automatic graph layout manager is enabled with
setPlace(true), this method sets up an initial rectangle to be used
for initial placement of objects in a graph. In the current implementation,
only object IDs return by getPlaceVertO1LabelsTitle() or getPlaceHorzO1LabelsTitle()
can be used.
Syntax:
void setPlaceRect(IdentObj id, Rectangle newValue)
where:
- id
Is an object ID returned by getPlaceVertO1LabelsTitle() or getPlaceHorzO1LabelsTitle().
- newValue
Are the values that specify the X-axis, Y-axis, width, and
height of the rectangle in virtual coordinates. 4 values specifying
x, y, width, & height of rectangle in virtual coordinates (for
example, new Rectangle (-15500, -15500, 24000, 31000).
Return: void;
Note: All getPlace...() and setPlace...() methods are
only valid when the automatic graph layout manager has been enabled
with setPlace(true).
See setPlaceMinFontSize() for
an example. Also see Place, getPlaceRect().
x
When the automatic graph layout manager is enabled with
setPlace(true), this method defines whether or not an object can
be moved or resized. The default value is 1 (allow resizing of all
graph objects).
Syntax:
void setPlaceResize(IdentObj id, int newValue)
where:
- id
Is the object ID of a graph object returned by a getObjectID()
method (for example, getFrame()).
- newValue
Is one of the following values:
0 does
not allow the specified object to be moved or resized.
1 allows
the specified object to be moved or resized.
Return: void;
Example:
setDepthRadius(0);  setPlaceResize(getFrame(),1);
setPlace(true);
setDepthRadius(0);  setPlaceResize(getFrame(),0);
setPlace(true);
Note:
- All getPlace...()
and setPlace...() methods are only valid when the automatic graph
layout manager has been enabled with setPlace(true).
- The value assigned
to the specified object will only be used if the automatic graph layout
manager determines that resizing is needed to produce a better graph layout.
See Place, getPlaceResize().
x
When the automatic graph layout manager is enabled with
setPlace(true), this method disables (0) / enables (1) label skipping
on the primary ordinal axis. The default value is 1 (allow skipping
for all axis labels).
Syntax:
void setPlaceSkip(IdentObj id, int newValue)
where:
- id
Is the object ID of primary ordinal axis labels (for example, getO1Label()).
- newValue
Is one of the following values:
0 disables
label skipping.
1 enables label skipping
Return: void;
Note:
- All getPlace...()
and setPlace...() methods are only valid when the automatic graph
layout manager has been enabled with setPlace(true).
- The value assigned
to the specified object will only be used if the automatic graph layout
manager determines that label skipping is needed to produce a better
graph layout.
See Place, getPlaceSkip().
x
When the automatic graph layout manager is enabled with
setPlace(true), this method can be used to specify the maximum number
of characters allowed for a text object. When a text object is longer
than the specified number of characters ellipses (...) will be appended
to the truncated text to indicate the text has been truncated. The
ellipses count for 3 characters. In the example below, group labels
"Group 0", "Group 1", etc., are truncated to "Gro..." because the
maximum label character count is 6.
Syntax:
void setPlaceTruncateCount(IdentObj id, int newValue)
where:
- id
Is the object ID of a text object returned by a getObjectID()
method (for example, getO1Label()).
- newValue
Is the maximum number of characters allowed.
Return: void;
Example:
setDepthAngle(0);
setDepthRadius(0);
setFillColor(getO1Label(), new Color(255,0,0));
setPlace(true);  setPlaceTruncateCount(getO1Label(), 6);
Note:
- All getPlace...()
and setPlace...() methods are only valid when the automatic graph
layout manager has been enabled with setPlace(true).
- The value assigned
to the specified object will only be used if the automatic graph layout
manager determines that truncation is needed to produce a better
graph layout.
- Data is truncated
permanently in the Perspective for Java data manager when this method
sets a truncate count.
See Place, getPlaceTruncateCount().
x
When the automatic graph layout
manager is enabled with setPlace(true), this method defines whether
or not long text objects can be word wrapped. The default value is
1 (allow word wrap for all text objects).
Syntax:
void setPlaceWordWrap(IdentObj id, int newValue)
where:
- id
Is an object
ID of a text object returned by a getObjectID() method (for example,
getO1Label()).
- newValue
Is one of the following values:
0 disables
word wrap.
1 enables word wrap.
Return: void;
Example:
setDepthRadius(0);
setGroupLabel(getGroup(0), "This is a very long group label0");
setGroupLabel(getGroup(1), "This is a very long group label1");
setGroupLabel(getGroup(2), "This is a very long group label2");
setGroupLabel(getGroup(3), "This is a very long group label3");
setGroupLabel(getGroup(4), "This is a very long group label4");  setPlaceWordWrap(getO1Label(), 0);
setPlace(true);
setDepthRadius(0);
setGroupLabel(getGroup(0), "This is a very long group label0");
setGroupLabel(getGroup(1), "This is a very long group label1");
setGroupLabel(getGroup(2), "This is a very long group label2");
setGroupLabel(getGroup(3), "This is a very long group label3");
setGroupLabel(getGroup(4), "This is a very long group label4");
setPlaceWordWrap(getO1Label(), 1);
setPlace(true);
Note:
- All getPlace...()
and setPlace...() methods are only valid when the automatic graph
layout manager has been enabled with setPlace(true).
- The value assigned
to the specified object will only be used if the automatic graph layout
manager determines that word wrapping is needed to produce a better
graph layout.
See Place, getPlaceWordWrap().
x
This method sets the scale value at which to place the
vertical quadrant line number nIndex.
Syntax:
void setQuadrantLineValueX(int nIndex,
double newValue);
where:
- nIndex
Is the quadrant line number (0...number of quadrant lines
in the graph).
- newValue
Is the scale value. NO_LINEVALUE enables automatic scaling.
Return: void;
Example:
setGraphType(89); setQuadrantLineValueX(0,50);
setQuadrantLineValueX(0,20);
x
This method sets the scale value at which to place the
horizontal quadrant line number nIndex.
Syntax:
void setQuadrantLineValueY(int nIndex, double newValue);
where:
- nIndex
Is the quadrant line number (0...number of quadrant lines
in the graph).
- newValue
Is the scale value. NO_LINEVALUE enables automatic scaling.
Return: void;
Example:
setGraphType(89); setQuadrantLineValueY(10);
setQuadrantLineValueY(60);
x
This method sets the bounding rectangle for a user-movable
object in virtual coordinates (x, y, width, height). See Virtual Coordinate System.
Syntax:
void setRect(IdentObj id, Rectangle newValue);
where:
- id
Is an object ID returned by a getObjectID() method (for example, getFrame()).
- newValue
Is the bounding rectangle for a user-movable object in virtual
coordinates (x, y, width, height).
Return: void;
Example:
setRect(getTitle(),
    new Rectangle(-15175,10550,29850,1800));
See getRect(), getFrameRect(), getLegendRect(), setLegendRect().
x
This method defines a reference line to be drawn in
the graph.
Syntax:
void setReferenceLine(IdentObj axisObj, int nIndex, double nPosition)
where:
- axisObj
Is an object ID of an axis object returned by a getObjectID()
method (for example, getY1Axis()).
- nIndex
Is the reference line index number (0...2).
- nPosition
Is the reference line position.
Return: void;
Example:
setDepthAngle(0);
setDepthRadius(0);
setReferenceLine(getY1Axis(),0,50);
setLineWidth(getReferenceLine(getY1Axis(),0),3);
setFillColor(getReferenceLine(getY1Axis(),0), new Color(255,0,0));
See getReferenceLineValue(),
and Reference Lines.
x
This method sets the value at which the reference line
displays.
Syntax:
void setReferenceLineValue(IdentOBJ id), value)
where:
- id
Is the object ID of a reference line returned by a getReferenceLineaxis()
method (for example, getReferenceLIneY1()).
- value
Is the value at which the reference line is drawn.
Return: void;
See getReferenceLineY1().
xsetReferenceLineXYRatio()
This method sets a XY reference line on a graph based
on a ratio. To use this method, the setUseReferenceLineXYRatio()
method must be set to true.
Syntax:
void setReferenceLineXYRatio(IdentObj IDObj, value);
where:
- IDObj
Can only be getReferenceLineXY().
- value
Can be one of the following:
True. When
setReferencePercentageMode is set to True it will use the percent
value of the top frame (0...100).
False. When
setReferencePercentageMode is set to False it will use the real
value.
Example:
setBorderColor(getReferenceLineXY(0),new Color(255,0,0));
setDisplay(getReferenceLineXY(0),true);
setFillColor(getReferenceLineXY(0),new Color(255,0,0));
setLineWidth(getReferenceLineXY(0),3);  setReferenceLineXYRatio(getReferenceLineXY(0),15);
setUseReferenceLineXYRatio(getReferenceLineXY(0),true);
setReferencePercentageMode(getReferenceLineXY(0),true);
setDisplay(getReferenceLineXYText(0), true);
setReferenceTextPosition(getReferenceLineXYText(0), 0);
setTextString(getReferenceLineXYText(0), "XY Ratio =15%");
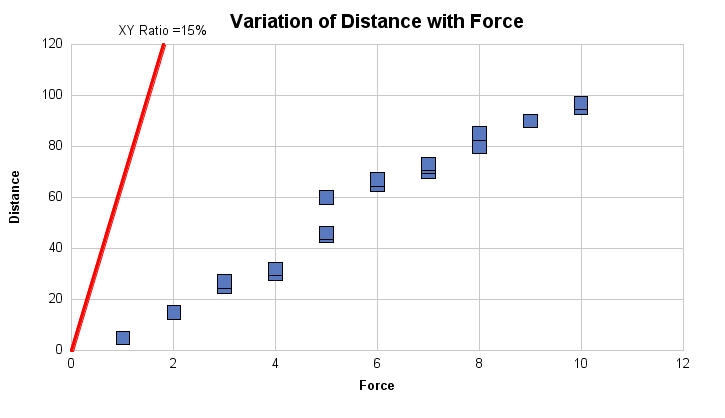
setBorderColor(getReferenceLineXY(0),new Color(255,0,0));
setDisplay(getReferenceLineXY(0),true);
setFillColor(getReferenceLineXY(0),new Color(255,0,0));
setLineWidth(getReferenceLineXY(0),3);  setReferenceLineXYRatio(getReferenceLineXY(0),100);
setUseReferenceLineXYRatio(getReferenceLineXY(0),true);
setReferencePercentageMode(getReferenceLineXY(0),false);
setDisplay(getReferenceLineXYText(0), true);
setReferenceTextPosition(getReferenceLineXYText(0), 0);
setTextString(getReferenceLineXYText(0), "XY Ratio =100");
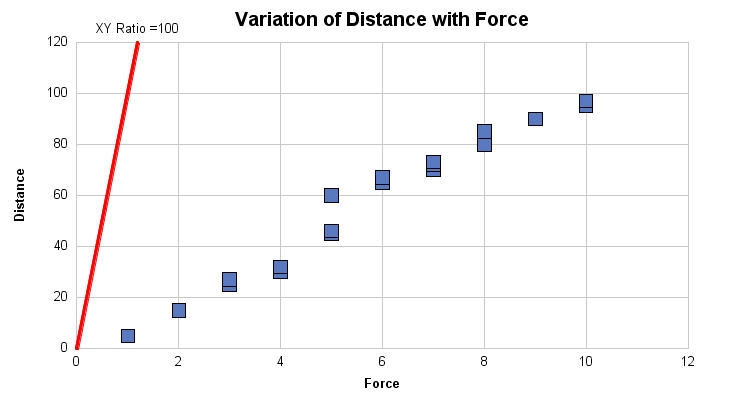
See setBorderColor(), getReferenceLineXY(), setDisplay(), setFillColor(), setLineWidth(), ReferencePercentageMode, ReferenceTextPosition, setTextString(), setUseReferenceLineXYRatio()
x
This method sets the maximum scale value assigned to
a numeric axis.
Syntax:
void setScaleMax(IdentObj id, double newValue);
where:
- id
Is an object ID returned by a getObjectID() method (for example, getX1Axis()).
- newValue
Is a value identifying the maximum scale value on an axis.
Return: void;
Example:
setDepthRadius(0);
setY1MajorGridStep(10.0);
setY1LogScale(false);  setScaleMax(getY1Axis(),50.0);
setY1ScaleMaxAuto(false);
setY1ScaleMinAuto(true);
setY1MustIncludeZero(false);
Note:
- You may also
use one of the axis-specific properties to set the maximum scale
on a particular axis (for example, X1ScaleMax(), Y1ScaleMax(), Y2ScaleMax(), and
so on).
- If setScaleMaxAuto()
sets autoscaling to true, the value set by setScaleMax() is ignored.
See getScaleMax(), setScaleMaxAuto(), setScaleMin(), setScaleMinAuto().
x
This method sets automatic calculation of the maximum
scale value for a numeric axis.
Syntax:
void setScaleMaxAuto(IdentObj id,boolean newValue);
where:
- id
Is an object ID returned by a getObjectID() method (for example, getX1Axis()).
- newValue
Is true or false. If the value is:
true,
the maximum value is automatically calculated on the axis.
false,
the value set by setScaleMax() is used.
Return: void;
Example:
setDepthRadius(0);
setY1MajorGridStep(10.0);
setY1LogScale(false);
setY1ScaleMax(50.0);  setScaleMaxAuto(getY1Axis(),false);
setY1ScaleMinAuto(true);
setY1MustIncludeZero(false);
Note:
- You may also
use one of the axis-specific properties to set automatic scaling on
a particular axis (for example, X1ScaleMaxAuto(), Y1ScaleMaxAuto(), Y2ScaleMaxAuto(),
and so on).
- If this method
sets a value of true, any value set by setScaleMax() is ignored.
See getScaleMaxAuto(), setScaleMax(), setScaleMin(), setScaleMinAuto().
x
This method sets the minimum scale value assigned to
a numeric axis in a graph.
Syntax:
void setScaleMin(IdentObj id, double newValue);
where:
- id
Is an object ID returned by a getObjectID() method (for example, getX1Axis()).
- newValue
Is the minimum scaling value that can be used on an axis.
Return: void;
Example:
setDepthRadius(0);
setY1MajorGridStep(5.0);
setY1LogScale(false);
setY1ScaleMax(65.0);
setY1ScaleMaxAuto(true);  setScaleMin(getY1Axis(),20.0);
setY1ScaleMinAuto(false);
setY1MustIncludeZero(false);
Note:
- You may also
use one of the axis-specific properties to set the minimum scale on
a particular axis (for example, X1ScaleMin(), Y1ScaleMin(), Y2ScaleMin(),
and so on).
- If setScaleMinAuto()
sets autoscaling to true, the value set by setScaleMin() is ignored.
See getScaleMin(), setScaleMax(), setScaleMaxAuto(), setScaleMinAuto().
x
This method sets automatic calculation of the maximum
scale value for a numeric axis.
Syntax:
void setScaleMinAuto(IdentObj id,boolean newValue);
where:
- id
Is an object ID returned by a getObjectID() method (for example,
getSlice ()).
- newValue
Is true or false. If the value is:
true,
the minimum value is automatically calculated.
false,
the value set by setScaleMin() is used.
Return: void;
Example:
setDepthRadius(0);
setY1MajorGridStep(5.0);
setY1LogScale(false);
setY1ScaleMax(65.0);
setY1ScaleMaxAuto(true);
setY1ScaleMin(20.0);  setScaleMinAuto(getY1Axis(),false);
setY1MustIncludeZero(false);
Note:
- You may also
use one of the axis-specific properties to set automatic scaling on
a particular axis (for example, X1ScaleMinAuto(), Y1ScaleMinAuto(), Y2ScaleMinAuto(),
and so on).
- If this method
sets a value of true, any value set by setScaleMin() is ignored.
See getScaleMinAuto(), setScaleMin(), setScaleMax(), setScaleMaxAuto().
xsetScaleMustIncludeZero()
This method defines whether or not a given axis must
include a zero value.
Syntax:
void setScaleMustIncludeZero(IdentObj id, boolean newValue);
where:
- id
Is an object ID returned by a getObjectID() method (for example, getX1Axis()).
- newValue
Is true or false. If the value is:
true,
the axis must include zero.
false, zero is
not required on the axis.
Return: void;
Example:
setDepthRadius(0);
setY1MajorGridStep(5.0);
setY1LogScale(false);
setY1ScaleMax(65.0);
setY1ScaleMaxAuto(true);
setY1ScaleMin(20.0);
setY1ScaleMinAuto(false);  setScaleMustIncludeZero(getY1Axis(),false);
Note:
- You may also
use one of the axis-specific properties to set a mandatory zero on
a particular axis (for example, X1MustIncludeZero(), Y1MustIncludeZero(), Y2MustIncludeZero
(), and so on).
See getScaleMustIncludeZero().
x
This method can be used to store series values and rows
or columns and to swap the order of series and group labels. In
the normal default configuration (setSeriesAreRows(false, false)),
each row/column value defines a series/group. When setSeriesAreRows(true,
true|false) is used, each row/column value defines a group/series data
point.
Syntax:
void setSeriesAreRows(
    boolean newValue,
    boolean swapLabels)
where:
- newValue
Is true or false. If the value is:
true,
series are stored as rows. This is the default value.
false,
series are stored as columns (the reverse order).
- swapLabels
Is true or false. If the value is:
true,
series and group labels are swapped.
false,
series and group labels are not swapped.
Note: The
swapLabels value is only applicable when newValue is set to false.
Return: void;
Example:
setUseSampleData(false);
setDepthRadius(0);
setData(0,0,.5); // Row 0/Column 0
setData(0,1,1);  // Row 0/Column 1
setData(0,2,2);  // Row 0/Column 2
setData(0,3,3);  // Row 0/Column 3
setData(1,0,10); // Row 1/Column 0
setData(1,1,11); // Row 1/Column 1
setData(1,2,12); // Row 1/Column 2
setData(1,3,13); // Row 1/Column 3
setDataRangeToExtent();
setSeriesLabel(0,"Series 0");
setSeriesLabel(1,"Series 1");
setGroupLabel(0,"Group 0");
setGroupLabel(1,"Group 1");
setGroupLabel(2,"Group 2");
setGroupLabel(3,"Group 3");  setSeriesAreRows(true,true);
setSeriesAreRows(false,true);
setSeriesAreRows(false,false);
x
This method can be used to set the border color of risers
for a specified series in a graph.
Syntax:
void setSeriesBorderColor(int s, Color newValue);
where:
- s
Is a series number.
- newValue
Is an RGB color value.
Return: void;
Example:
setSeriesBorderColor(4,new Color(0,0,0));
setDepthRadius(0);
setSeriesFillColor(4,new Color(255,255,255));  setSeriesBorderColor(3,new Color(0,0,0));
setSeriesFillColor(3,new Color(255,255,255));  setSeriesBorderColor(2,new Color(0,0,0));
setSeriesFillColor(2,new Color(255,255,255));  setSeriesBorderColor(1,new Color(0,0,0));
setSeriesFillColor(1,new Color(255,255,255));  setSeriesBorderColor(0,new Color(0,0,0));
setSeriesFillColor(0,new Color(255,255,255));
See getBorderColor(), setBorderColor(), getTransparentBorderColor(),
setTransparentBorderColor(), setSeriesFillColor().
xsetSeriesDataTextDisplay()
This method can be used to enable and/or disable data
text for a specified series. Data text must be enabled for all series
using the DataTextDisplay property or setDisplay(getDataText(),
true).
Syntax:
void setSeriesDataTextDisplay(
     IdentObj idSeries,
     boolean bNewValue)
where:
- idSeries
The object ID returned by a getObject() method for a series
(for example, getSeries(1));
- bNewValue
Is a boolean where a value of:
true shows
data text for idSeries.
false does not show
data text for idSeries.
Return: void;
Example:
setGraphType(41);
setDepthAngle(0);
setDepthRadius(0);
setDataTextDisplay(true);  setSeriesDataTextDisplay(getSeries(4), false);  setSeriesDataTextDisplay(getSeries(0), false);  setSeriesDataTextDisplay(getSeries(2), false);
See setCustomDataText(), setCustomDataTextFormat(), and setCustomDataTextFormatPattern() to
enable and customize the format of data text displayed for individual
series.
x
This method sets the fill color of risers for a specified
series in a graph.
Syntax:
void setSeriesFillColor(int s, new Color (newValue));
where:
- s
Is a series number.
- newValue
Is a color value in one of the following
formats:
r, g, b is the desired intensity
of red, green, and blue, respectively. The values are on a scale
of 0 to 255, where 0 is the least intense and 255 is the most intense.
#hexcolor is the
hexadecimal color code, preceded by a pound sign (#).
Return: void;
Example:
setSeriesBorderColor(4,new Color(0,0,0));
setDepthRadius(0);  setSeriesFillColor(4,new Color(255,255,255));
setSeriesBorderColor(3,new Color(0,0,0));  setSeriesFillColor(3,new Color(255,255,255));
setSeriesBorderColor(2,new Color(0,0,0));  setSeriesFillColor(2,new Color(255,255,255));
setSeriesBorderColor(1,new Color(0,0,0));  setSeriesFillColor(1,new Color(255,255,255));
setSeriesBorderColor(0,new Color(0,0,0));  setSeriesFillColor(0,new Color(255,255,255));
or, using hexadecimal color codes:
setSeriesBorderColor(4,new Color(#000000));
setDepthRadius(0);  setSeriesFillColor(4,new Color(#FFFFFF));
setSeriesBorderColor(3,new Color(#000000));  setSeriesFillColor(3,new Color(#FFFFFF));
setSeriesBorderColor(2,new Color(#000000));  setSeriesFillColor(2,new Color(#FFFFFF));
setSeriesBorderColor(1,new Color(#000000));  setSeriesFillColor(1,new Color(#FFFFFF));
setSeriesBorderColor(0,new Color(#000000));  setSeriesFillColor(0,new Color(#FFFFFF));
See getFillColor(), setFillColor(), getTransparentFillColor(), setTransparentFillColor(), setSeriesBorderColor().
x
This method defines a label string associated with a
series in a graph.
Syntax:
void setSeriesLabel(IdentObj id, String newValue);
void setSeriesLabel(int seriesID, String newValue);
where:
- id
Is an object ID returned by a getObjectID() method (for example, getSeries()).
- seriesID
Is a series number.
- newValue
Is a series label string.
Return: void;
Example:
setUseSampleData(false);
setDepthRadius(0);
setData(0,0,.5); // Row 0/Column 0
setData(0,1,1);  // Row 0/Column 1
setData(0,2,2);  // Row 0/Column 2
setData(0,3,3);  // Row 0/Column 3
setData(1,0,10); // Row 1/Column 0
setData(1,1,11); // Row 1/Column 1
setData(1,2,12); // Row 1/Column 2
setData(1,3,13); // Row 1/Column 3
setDataRangeToExtent();  setSeriesLabel(0,"Series 0");  setSeriesLabel(1,"Series 1");
setGroupLabel(0,"Group 0");
setGroupLabel(1,"Group 1");
setGroupLabel(2,"Group 2");
setGroupLabel(3,"Group 3");
setSeriesAreRows(true,true);
See getSeriesLabel().
x
This method sets an index for the number of risers in
a group. You can automatically shade successive groups of risers
by lightening or darkening the colors used for the risers in the
previous group. This type of shading is implemented using color
mode 4, a looping index, and a factor for lightening or darkening
the colors. For more information, see Risers and Markers
.
Syntax:
void setSeriesLooping(int newValue);
where:
- newValue
Identifies the number of risers in each group on the graph.
Return: void;
See Risers and Markers, ColorMode, setAutoColorLerpFactor().
x
This method sets the series type for a specific object,
series number, or the first item in the selection list.
Syntax:
void setSeriesType(IdentObj id, int newValue);
void setSeriesType(int seriesID, int newValue);
For a multi-axis merged graph:
void setSeriesType(int [$]seriesID, int newValue);
where:
- id
Is an object ID returned by a getObjectID() method (for example, getSeries()).
- seriesID
Is an object number.
- $seriesID
Automatically assigns a type to each series by using the
number of measures as an increment that ensures that all series
related to the same measure use the same series type. This automatic
series increment is also available for setAxisAssignment().
- newValue
Is a series type. Values can be:
0,
riser unspecified
1, riser bar
2,
riser marker
3, riser area
Return: void;
Example:
setDataRange(0,0,2,2);
setDepthRadius(0);  setSeriesType(0,1);  setSeriesType(1,2);  setSeriesType(2,3);
See getSeriesType().
Example for a Multi-Axis Merged Graph
The following request uses a bi-polar
bar chart with two measures (CURR_SAL and SALARY) and two sort fields
(BY DEPARTMENT and ACROSS LAST_NAME). This makes it a multi-axis
merged graph request:
GRAPH FILE EMPLOYEE
SUM EMPLOYEE.EMPINFO.CURR_SAL
EMPLOYEE.PAYINFO.SALARY
BY EMPLOYEE.EMPINFO.DEPARTMENT
ACROSS EMPLOYEE.EMPINFO.LAST_NAME
ON GRAPH SET LOOKGRAPH VBAR2AXS
ON GRAPH SET 3D OFF
ON GRAPH SET BARNUMB OFF
ON GRAPH SET GRID ON
ON GRAPH SET GRAPHEDIT OFF
ON GRAPH SET GRMERGE ON
ON GRAPH SET VZERO ON
ON GRAPH SET HTMLENCODE ON
ON GRAPH SET GRAPHSTYLE *  -* ***Series Assignments***
 setSeriesType($0,2); setSeriesType($1,1);
setAxisAssignment($0,0);
setAxisAssignment($1,1);
Since DEPARTMENT has two values and there are two measures, there
are four series in the graph request: CURR_SAL for the MIS department,
CURR_SAL for the PRODUCTION department, SALARY for the MIS department,
and SALARY for the PRODUCTION department
The series type assignments are setSeriesType($0,2);
and setSeriesType($1,1). These are translated to the following API
calls that make sure that series 0 and 2 (based on CURR_SAL) are
represented by lines and that series 1 and 3 (based on SALARY) are represented
by bars:
setSeriesType(0,2);
setSeriesType(2,2);
setSeriesType(1,1);
setSeriesType(3,1);
The output is:
x
This method sets the color value of a drop shadow.
Syntax:
void setShadowColor(IdentObj id, new Color (newValue));
where:
- id
Is an object ID returned by a getObjectID() method.
- newValue
Is the value of the color to be applied
to the drop shadow ID in one of the following formats:
r,
g, b is the desired intensity of red, green, and blue,
respectively. The values are on a scale of 0 to 255, where 0 is
the least intense and 255 is the most intense.
#hexcolor is
the hexadecimal color code, preceded by a pound sign (#).
Return: void;
Example:
setDepthAngle(0);
setDepthRadius(0);
setShadowDisplay(getFrame(), true);
setShadowXOffset(getFrame(), 10);
setShadowYOffset(getFrame(), 10);  setShadowColor(getFrame(), new Color (0,255,255));
or, using a hexadecimal color code:
setDepthAngle(0);
setDepthRadius(0);
setShadowDisplay(getFrame(), true);
setShadowXOffset(getFrame(), 10);
setShadowYOffset(getFrame(), 10);  setShadowColor(getFrame(), new Color (#0000FF));
See getShadowColor(), getShadowDisplay(), setShadowDisplay(), getShadowXOffset(), setShadowXOffset(), getShadowYOffset(), setShadowYOffset().
x
This method applies a drop shadow to an object.
Syntax:
void setShadowDisplay(IdentObj id,boolean newValue);
where:
- id
Is an object ID returned by a getObjectID() method (for example, getTitle()).
- newValue
Is true or false. If the value is:
true,
the drop shadow appears.
false, the drop
shadow does not appear.
Return: void;
See setShadowColor() for
an example. Also see getShadowColor(), getShadowXOffset(), setShadowXOffset(), getShadowYOffset(), setShadowYOffset(), ShadowXOffsetDefault, ShadowYOffsetDefault
x
When shadow is enabled for a specified text object (for
example, setShadowDisplay(getTitle(), true)), this method assigns
a shadow fill type to the object. The default value is 1 (FILL_COLOR).
If FILL_GRADIENT_LEFTTORIGHT (2) is used, use setShadowGradientStartColor()
and setShadowGradientEndColor() to specified the starting and ending
colors of the gradient. If FILL_TEXTURE (3) is used, use setShadowTextureURL() to
define the texture file.
Syntax:
void setShadowFillType(IdentObj id, int newValue)
where:
- id
object ID returned by a getObject() method (for example, getTitle())
- newValue
1...3. FILL_COLOR (1), FILL_GRADIENT_LEFTTORIGHT (2), FILL_TEXTURE (3)
Return: void;
See setShadowGradientStartColor() and setShadowTextureURL() for
examples. Also see getShadowFillType(), setShadowDisplay(), setShadowGradientEndColor().
xsetShadowGradientEndColor()
When setShadowFillType() assigns a gradient (FILL_GRADIENT_LEFTTORIGHT
(2)) to a text object, this method defines the ending color of a
gradient for a specified object. The default value is green.
Syntax:
void setShadowGradientEndColor(IdentObj idObj, Color col)
where:
- id
Is the object ID of a Java2D text object returned by a getObject() method
(for example, getTitle()).
- col
Is the color specification (for example, new Color (255,0,0)
// red).
Return: void;
See setShadowGradientStartColor() for
an example. Also see getShadowGradientEndColor(), setShadowFillType().
xsetShadowGradientStartColor()
When setShadowFillType() assigns a gradient (FILL_GRADIENT_LEFTTORIGHT
(2)) to a text object, this method defines the starting color of
a gradient for a specified object. The default value is blue.
Syntax:
void setShadowGradientStartColor(
     IdentObj idObj,
     Color col)
where:
- idObj
Is the object ID of a Java2D text object returned by a getObject() method
(for example, getTitle()).
- col
Is the color specification (for example, new Color (255,0,0)
// red).
Return:void;
Example:
// Gradient on the title
setFillType(getTitle(),2);
setGradientDirection(getTitle(),1);
setGradientNumPins(getTitle(),2);
setGradientPinLeftColor(getTitle(),new Color(0,255,0),1);
setGradientPinLeftColor(getTitle(),new Color(0,0,255),0);
setGradientPinPosition(getTitle(),1.0,1);
setGradientPinPosition(getTitle(),0.0,0);
setGradientPinRightColor(getTitle(),new Color(0,255,0),1);
setGradientPinRightColor(getTitle(),new Color(0,0,255),0);
// Gradient on the drop shadow
setShadowDisplay(getTitle(),true);
setShadowFillType(getTitle(),
Java2DTextLowLevel.FILL_GRADIENT_LEFTTORIGHT);
setShadowTextureURL(getTitle(),"file:/C:/JavaChart/pfjFull/tiles/Azul_Gra
nite.gif");   setShadowGradientStartColor(getTitle(),new Color(0,255,0));
setShadowGradientEndColor(getTitle(),new Color(255,0,0));

See getShadowGradientStartColor(), setShadowFillType(), setShadowGradientEndColor().
x
When setShadowFillType() assigns a texture (FILL_TEXTURE
(3)) to a text object, this method defines the texture file to be
applied to the object. This method is identical to setTextureURL()
except it only applies to Java 2D Text.
Syntax:
void setShadowTextureURL(IdentObj id, String szURL)
where:
- id
Is the object ID of a text object returned by a getObject() method.
- szURL
Is the URL specification string that identifies a texture file.
Return:void;
Example:
// Texture on the front
setFillType(getTitle(),3);
setTextureDisplayMode(getTitle(),0);
setTextureURL(getTitle(),"/images/tdg/Purple_Pink_Granite.gif");
// Texture on the drop shadow
setShadowDisplay(getTitle(),true);
setShadowFillType(getTitle(),3);  setShadowTextureURL(getTitle(),"/images/tdg/Azul_Granite.gif");
See setShadowFillType().
x
This method resizes the graph to the specified height
and width in pixels.
Syntax:
void setSize(Dimension d)
void setSize(int width, int height)
where:
- d
Is the dimension of the object.
- width
Is the width, in pixels.
- height
Is the height, in pixels.
Return: void;
Example:
setDepthAngle(0);
setDepthRadius(0);
setShadowDisplay(getFrame(), true);
setShadowXOffset(getFrame(), 10);
setShadowYOffset(getFrame(), 5);
setShadowColor(getFrame(), new Color (0,0,255));  setSize(200,200);
x
When setAutoSkip() selects manual skip mode, this method
selects the first label to skip on the O1 axis.
Syntax:
void setSkipBegin(IdentObj id, int newValue);
where:
- id
Is an object ID returned by a getObjectID() method (for example,
getO1Label ()).
- newValue
0...Number of groups in the graph.
Return: void;
Example:
setAutoSkip(getO1Label(),2);  setSkipBegin(getO1Label(),1);
setSkipCount(getO1Label(),1);
Note: If an object ID (id) is not specified, newValue
is assigned to the first item in the selection list (if applicable).
See setAutoSkip(), setSkipCount().
x
When setAutoSkip() selects manual skip mode, this method
selects the interval of labels to skip after setSkipBegin().
Syntax:
void setSkipCount(IdentObj id, int newValue);
where:
- id
Is an object ID returned by a getObjectID() method (for example, getO1Label()).
- newValue
Is the number (0...Number) of groups in the graph.
Return: void;
Example:
setAutoSkip(getO1Label(),2);
setSkipBegin(getO1Label(),1);  setSkipCount(getO1Label(),1);
Note: If an object ID (id) is not specified, newValue
is assigned to the first item in the selection list (if applicable).
See setAutoSkip(), setSkipBegin().
x
When setUseTextBackgroundColor() enables (true) drawing
of a background color behind a text object, this method assigns
the background color.
Syntax:
void setTextBackgroundColor(IdentObj idObj, Color col)
where:
- idObj
Is the object ID returned by a getObjectID() method (for
example, getY1Label()).
- col
Is a color specification.
Return: void;
Example:
setUseTextBackgroundColor(getSubtitle(), true); setTextBackgroundColor(getSubtitle(), new Color(128,128,255));
See setUseTextBackgroundColor().
x
This method assigns a standard Java number format pattern
to numeric data text or a numeric label object.
Syntax:
void setTextFormatPattern(IdentObj id, String newValue);
where:
- id
Is an object ID returned by a getObjectID() method (for example, getY1Label()).
- newValue
Is a pattern string in the following format:
pattern:= subpattern{;subpattern}subpattern:= {prefix}integer{.fraction}{suffix}prefix:= '\\u0000'..'\\uFFFD' - specialCharacterssuffix:= '\\u0000'..'\\uFFFD' - specialCharactersinteger:= '#'* '0'* '0'fraction:= '0'* '#'*
Return: void;
Example:
setDepthRadius(0);
setDataRange(1,1,2,2);
setDataTextDisplay(true);
setTextFormatPreset(getY1Label(),-1);  setTextFormatPattern(getY1Label(),"$##");
See getTextFormatPattern(), getTextFormatPreset(), setTextFormatPreset(), DataTextFormat, PieFeelerTextFormat, PieRingTotalFormat, X1LabelFormat, Y1LabelFormat, Y2LabelFormat.
x
This method assigns a number format to a numeric text
object.
Syntax:
void setTextFormatPreset(IdentObj id,int newValue);
where:
- id
Is an object ID returned by a getObjectID() method (for example, getY1Label()).
- newValue
Is one of the following values:
-2 uses
the format defined by setTextFormatPattern(), divided by 100.
-1 uses
the format defined by setTextFormatPattern().
0...21,
24...30 selects one of the preset formats. See Preset Number Formats.
Return: void;
Example:
setDepthRadius(0); setDepthAngle(0); setTextFormatPreset(getY1Label(), 6);
See getTextFormatPreset(), getTextFormatPattern(), setTextFormatPattern(), DataTextFormat, PieFeelerTextFormat, PieRingTotalFormat, X1LabelFormat.
x
This method selects the horizontal alignment of a text
object within its bounding box.
Syntax:
void setTextJustHoriz(IdentObj id, int newValue);
where:
- id
Is an object ID returned by a getObjectID() method (for example, getFootnote()).
- newValue
Is the text justification. Values can be:
0 (left)
1 (center)
2 (tight)
Return: void;
Example:
setDepthAngle(0);
setDepthRadius(0);
setDisplay(getTitleBox(), true);
setFillColor(getTitleBox(), new Color(255,255,255));
setSubtitleString("");
setTextJustVert(getTitle(), 1);  setTextJustHoriz(getTitle(), 0);
setTextJustHoriz(getTitle(), 1);
setTextJustHoriz(getTitle(), 2);
See getTextJustHoriz(), getTextJustVert(), setTextJustVert().
x
This method selects the vertical alignment of a text
object within its bounding box.
Syntax:
void setTextJustVert(IdentObj id,int newValue);
where:
- id
Is an object ID returned by a getObjectID() method (for example, getTitle()).
- newValue
Is the vertical justification. Values can be:
0 (top)
1 (center)
2 (bottom)
Return: void;
Example:
setDepthAngle(0);
setDepthRadius(0);
setDisplay(getTitleBox(), true);
setFillColor(getTitleBox(), new Color(255,255,255));
setSubtitleString("");  setTextJustVert(getTitle(), 0);
setDepthAngle(0);
setDepthRadius(0);
setDisplay(getTitleBox(), true);
setFillColor(getTitleBox(), new Color(255,255,255));
setSubtitleString("");  setTextJustVert(getTitle(), 1);
setDepthAngle(0);
setDepthRadius(0);
setDisplay(getTitleBox(), true);
setFillColor(getTitleBox(), new Color(255,255,255));
setSubtitleString("");setTextJustVert(getTitle(), 2);
See getTextJustVert(), getTextJustHoriz(), setTextJustHoriz().
x
This method selects the rotation angle of a text object.
Syntax:
void setTextRotation(IdentObj id,int newValue);
where:
- id
Is an object ID returned by a getObjectID() method (for example, getY1Label()).
- newValue
Is the text rotation. Values can be:
0 (none)
1 (90
degrees)
2 (270 degrees)
3 (45
degrees)
Return: void;
Example:
setDepthRadius(0);
setUseSampleData(false);
setData(0,0,20);
setData(0,1,36);
setData(1,0,33);
setData(1,1,39);
setDataRangeToExtent();
setTextJustHoriz(getTitle(),0);
setTextJustHoriz(getSubtitle(),1);
setTextJustHoriz(getFootnote(),2);  setTextRotation(getY1Label(),1);
See getTextRotation(), O1LabelRotate, O2LabelRotate, X1LabelRotate, Y1LabelRotate, Y2LabelRotate.
x
This method enables (true) / disables (false) strike-through
mode on a text object.
Syntax:
void setTextStrikethrough(
     IdentObj idObj,
     boolean newValue
)
where:
- idObj
Is the object ID returned by a getObjectID() method (for
example, getTitle()).
- newValue
Can be one of the following values:
true enables
strike-through.
false disables strike-through.
Return: void;
Example:
setUseTextBackgroundColor(getSubtitle(), true);
setTextBackgroundColor(getSubtitle(), new Color(128,128,255));  setTextStrikethrough(getSubtitle(), true);
x
This method defines a text string to be assigned to
a text object.
Syntax:
void setTextString(IdentObj id,String newValue);
where:
- id
Is an object ID returned by a getObjectID() method (for example, getTitle()).
- newValue
Is the string assigned to a text object.
Return: void;
Example:
setDepthRadius(0);
setUseSampleData(false);
setData(0,0,20);
setData(0,1,36);
setData(1,0,33);
setData(1,1,39);
setDataRangeToExtent();  setTextString(getFootnote(), "THE CHART FOOTNOTE");
See getTextString(), FootnoteString, O1TitleString, O2TitleString, SubtitleString, TitleString, X1TitleString, Y1TitleString, Y2TitleString.
x
This method can be used to assign an underline style/type
to a text object. The default value is UNDERLINE_LOW_TWO_PIXEL.
The setFontStyle() method must be used to enable an underline font
style.
Syntax:
void setTextUnderlineType(IdentObj id, int newValue)
where:
- id
Is the object ID returned by a getObjectID() method (for
example, getTitle()).
- newValue
Can be one of the following:
1 = UNDERLINE_LOW_ONE_PIXEL
2
= UNDERLINE_LOW_TWO_PIXEL
3 = UNDERLINE_LOW_DOTTED
4
= UNDERLINE_LOW_GRAY
5 = UNDERLINE_LOW_DASHED
Return:void;
Example:
// Turn underline on by setting one of the Font Styles
setFontStyle(getSubtitle(),4);
// For UNDERLINE_LOW_DASHED
setTextUnderlineType(getSubtitle(), 5);
See getTextUnderlineType(), setFontStyle().
x
This method assigns a background color to a texture
for a specified object.
Syntax:
void setTextureBGColor(IdentObj id, Color newValue)
void setTextureBGColor(int seriesID, Color newValue)
void setTextureBGColor(
     int seriesID,
     int groupID,
     Color newValue)
where:
- newValue
Is a color (for example, new Color (255,0,0)) to be applied
to the background of a texture for a specified object.
- id
Is the object ID returned by a getObjectID() method.
- seriesID
Is a series number.
- groupID
Is a group number.
Return: void;
See getTextureBGColor().
x
This method sets the texture display mode.
Syntax:
void setTextureDisplayMode(int newValue);
void setTextureDisplayMode(IdentObj id, int newValue);
where:
- id
Is the object ID returned by a getObjectID() method (for
example, getSeries()).
- newValue
Is a texture display mode:
0 is stretched.
1 is
tiles.
Return: void;
Example:
setFillType(getSeries(3),3);
setFillType(getSeries(0),3);
setFillType(getSeries(2),3);
setFillType(getSeries(4),3);
setFillType(getSeries(1),3);
setGraphType(32);  setTextureDisplayMode(getSeries(3),0);  setTextureDisplayMode(getSeries(0),0);  setTextureDisplayMode(getSeries(2),0);  setTextureDisplayMode(getSeries(4),0);  setTextureDisplayMode(getSeries(1),0);
setTextureURL(getSeries(3),"/images/tdg/Soft_Blue_Marble.gif");
setTextureURL(getSeries(0),"/images/tdg/Soft_Blue_Marble.gif");
setTextureURL(getSeries(2),"/images/tdg/Oil.gif");
setTextureURL(getSeries(4),"/images/tdg/Yellow.gif");
setTextureURL(getSeries(1),"/images/tdg/Azul_Granite.gif");
Note: If an object ID (id) is not specified, newValue
is assigned to the first item in the selection list (if applicable).
See setFillType(), setTextureURL().
x
This method can be used to change the direction in which
a texture is drawn for a selected object.
Syntax:
void setTextureFlipMode(int newValue)
void setTextureFlipMode(IdentObj id, int newValue)
where:
- id
Is an object ID returned by a getObject() method (for example, getSeries()).
- newValue
Is the flip mode. Values can be:
0 (no
flipping)
1 (flip vertical)
2 (flip
horizontal)
3 (flip vertical and horizontal)
Return: void;
Note: If an object ID (id) is not specified, newValue
is assigned to the first item in the selection list (if applicable).
See getTexture(), getTextureDisplayMode(), getTextureFlipMode(), setTextureDisplayMode(), setTextureResource(), setTextureURL().
x
This method can be used to load a texture image from
a URL/file and assign it to object(s) in the graph. Note that the
setFillType() method be used to select a texture fill type.
Syntax:
void setTextureURL(String szURL)
void setTextureURL(IdentObj id, String szURL)
void setTextureURL(String szURL, Image theImage)
void setTextureURL(IdentObj id, String szURL, Image theImage)
where:
- id
Is an object ID returned by a getObjectID() method (for example, getSeries()).
- theImage
Is a URL/file name where the texture image resides.
- szURL
Is the size of the URL.
Return: void;
Example:
setFillType(getSeries(3),3);
setFillType(getSeries(0),3);
setFillType(getSeries(2),3);
setFillType(getSeries(4),3);
setFillType(getSeries(1),3);
setGraphType(32);
setTextureDisplayMode(getSeries(3),0);
setTextureDisplayMode(getSeries(0),0);
setTextureDisplayMode(getSeries(2),0);
setTextureDisplayMode(getSeries(4),0);
setTextureDisplayMode(getSeries(1),0);  setTextureURL(getSeries(3),"/images/tdg/Soft_Blue_Marble.gif");  setTextureURL(getSeries(0),"/images/tdg/Soft_Blue_Marble.gif");  setTextureURL(getSeries(2),"/images/tdg/Oil.gif");  setTextureURL(getSeries(4),"/images/tdg/Yellow.gif");  setTextureURL(getSeries(1),”/images/tdg/Azul_Granite.gif");
See setFillType(), getTextureDisplayMode(), setTextureDisplayMode().
x
This method enables/disables line wrapping for a text
object. When text wrapping is enabled, the graphing engine will
look for space characters in the text string and draw the text on
multiple lines at space character boundaries. When text wrapping
is disabled, the text string will always be drawn on a single line.
Syntax:
void setTextWrap(IdentObj id,boolean newValue);
where:
- id
Is an object ID returned by a getObjectID() method (for example, getO1Label()).
- boolean
Can be one of the following values:
true enables
text wrapping.
false disables text wrapping.
Return: void;
Example:
setAutofit(getSubtitle(),false);
setFontSizeVC(getSubtitle(),1855);
setRect(getSubtitle(),
    new Rectangle(-13278,10471,25806,3710));
setTextString(getSubtitle(),
    "This is a very long Chart SubTitle that
    should be wrapped");  setTextWrap(getSubtitle(), true);
setDepthRadius(0);
Note If a "\n" is encountered in the label string, the
string will be wrapped even if this method is disabled (for example,
setTextWrap(getO2Label(), false);).
See getTextWrap(), O1LabelWrap, O2LabelWrap.
x
This method can be used to set the number of minor tick
marks that will appear between major tick marks on an ordinal axis.
Syntax:
void setTickCount(IdentObj id, int newValue)
where:
- newValue
Is the number of minor tick marks between major tick marks.
- id
Is the object ID returned by a getObject() method
for ordinal axis tick marks (for example, getO1MinorTick()).
Return: void;
Example:
setDepthAngle(0);
setDepthRadius(0);
setGraphType(41);
setO1MajorGridDisplay(false);
setO1MajorTickDisplay(true);
setTickLength(getO1MajorTick(), 1000);
setO1MinorTickDisplay(true);
setO1MinorTickStepAuto(false);
setTickCount(getO1MinorTick(), 5);
setY1MajorGridDisplay(false);
setY1MinorTickDisplay(true);
setY1MajorTickDisplay(true);
See getTickCount().
x
The method sets the length of tick marks to be drawn
on a specified axis.
Syntax:
void setTickLength(IdentObj id, int newValue)
where:
- newValue
Is the length of tick marks in virtual coordinates.
- id
Is the object ID returned by a getObject() method
for axis tick marks (for example, getY1MajorTick()).
Return: void;
See setTickCount() for
an example. Also see getTickLength().
x
When automatic calculation of tick steps is disabled
with setTickStepAuto(axis, false), this method sets the interval
at which to draw tick marks on an axis.
Syntax:
void setTickStep(IdentObj id, double newValue)
where:
- newValue
Is the interval at which to draw ticks on an axis.
- id
Is the object ID returned by a getObject() method
for axis tick marks (for example, getY1MajorTick()).
Return: void;
Note: The axis-specific properties may also be used to
enable/disable automatic calculation of tick steps or define a number
tick steps (for example, Y1MinorTickStepAuto).
See setTickStepAuto() for
an example. Also see getTickStep().
x
Syntax:
void setTickStepAuto(IdentObj id, boolean newValue)
where:
- newValue
Is the interval at which to draw ticks on an axis.
- id
Is the object ID returned by a getObject() method
for axis tick marks (for example, getY1MajorTick()).
Return: void;
Example:
setDepthAngle(0);
setDepthRadius(0);
setGraphType(41);
setTickLength(getY1MajorTick(), 1000);
setY1MajorGridDisplay(false);
setY1MinorTickDisplay(false);
setY1MajorTickDisplay(true);
setTickStep(getY1MajorTick(), 5);  setTickStepAuto(getY1MajorTick(), false);
Note: The axis-specific properties may also be used to
enable/disable automatic calculation of tick steps or define a number
tick steps (for example, Y1MinorTickStepAuto).
See getTickStepAuto().
x
The method sets the style of tick marks to be drawn
on a particular axis.
Syntax:
void setTickStyle(IdentObj id, int newValue)
where:
- newValue
Can be one of the following:
0 for
small tick marks from frame edge outward.
1 for
small tick marks from frame edge outward.
2 for
small tick marks from frame edge inward.
3 for
small tick marks from frame edge outward.
4 for
small tick marks span across the frame edge.
- id
Is the object ID returned by a getObject() method
for axis tick marks (for example, getY1MajorTick()).
Return: void;
See getTickStyle().
x
The method sets the width of tick marks to be drawn
on a particular axis.
Syntax:
void setTickWidth(IdentObj id, int newValue)
where:
- newValue
Is the width of ticks in device coordinates.
- id
Is the object ID returned by a getObject() method
for axis tick marks (for example, getY1MajorTick()).
Return: void;
See getTickWidth().
xsetToolTipBackdropColor()
When tool tips are enabled with
setToolTipDisplay(true), this method can be used to assign a backdrop
(shadow) color to the tool tip.
Syntax:
void setToolTipBackdropColor(Color colorBackdrop)
where:
- colorBackdrop
Is the tool tip backdrop color.
Return: void;
Example:
setDepthAngle(0);
setDepthRadius(0);
setToolTipDisplay(true);  setToolTipBackdropColor(new Color(255,0,0));
setDepthAngle(0);
setDepthRadius(0);
setToolTipDisplay(true);  setToolTipBackdropColor(new Color(0,255,0));
See setToolTipBackdropSize().
x
When tool tips are enabled with
setToolTipDisplay(true), this method can be used to define the size
of a backdrop (shadow).
Syntax:
void setToolTipBackdropSize(int nBackdropSize)
where:
- nBackdropSize
Is the tool tip backdrop size.
Return: void;
Example:
setDepthAngle(0); setDepthRadius(0);
setToolTipDisplay(true); setToolTipBackdropColor(new Color(255,0,0));setToolTipBackdropSize(10);
setDepthAngle(0); setDepthRadius(0);
setToolTipDisplay(true); setToolTipBackdropColor(new Color(255,0,0));setToolTipBackdropSize(20);
See setToolTipBackdropColor().
xsetToolTipBackgroundColor()
This method can be used to define the color of background
behind the tool tip text.
Syntax:
void setToolTipBackgroundColor(Color colorBackground)
where:
- colorBackground
Is the tool tip background color.
Return: void;
Example:
setDepthAngle(0);
setDepthRadius(0);
setToolTipDisplay(true);  setToolTipBackgroundColor(new Color (0,255,0));
setToolTipBackdropColor(new Color(255,0,0));
setToolTipBackdropSize(10);
See setToolTipBackdropColor(), setToolTipBackdropSize(), setToolTipColor().
x
This method can be used to define the color of tool
tip text.
Syntax:
void setToolTipColor(Color colorToolTip)
where:
- colorToolTip
Is the tool tip text color.
Return: void;
Example:
setDepthAngle(0);
setDepthRadius(0);
setToolTipDisplay(true);
setToolTipBackgroundColor(new Color (0,255,0));
setToolTipBackdropColor(new Color(0,0,255));  setToolTipColor(new Color(255,0,0));
setToolTipBackdropSize(10);
See setToolTipBackdropColor(), setToolTipBackdropSize(), setToolTipBackgroundColor(), setToolTipFontName(), setToolTipFontSize(), setToolTipFontStyle().
x
This method assigns the font type value for a tool tip.
Syntax:
void setToolTipFontName(String strFontName)
where:
- strFontName
Is the name of the font (for example, Arial, Courier New,
Times New Roman).
Return: void;
Example:
setDepthAngle(0);
setDepthRadius(0);
setToolTipDisplay(true);
setToolTipBackgroundColor(new Color (0,255,0));
setToolTipBackdropColor(new Color(0,0,255));
setToolTipColor(new Color(255,0,0));
setToolTipBackdropSize(10);  setToolTipFontName("Courier New");
setDepthAngle(0);
setDepthRadius(0);
setToolTipDisplay(true);
setToolTipBackgroundColor(new Color (0,255,0));
setToolTipBackdropColor(new Color(0,0,255));
setToolTipColor(new Color(255,0,0));
setToolTipBackdropSize(10);  setToolTipFontName("Times New Roman");
See setToolTipColor(), setToolTipFontSize(), setToolTipFontStyle().
x
This method assigns a font size
(in points) to tool tip strings.
Syntax:
void setToolTipFontSize(int nFontSize)
where:
- nFontSize
Is the font size in points.
Return: void;
Example:
setDepthAngle(0);
setDepthRadius(0);
setToolTipDisplay(true);
setToolTipBackgroundColor(new Color (0,255,0));
setToolTipBackdropColor(new Color(0,0,255));
setToolTipColor(new Color(255,0,0));
setToolTipBackdropSize(10);
setToolTipFontName("Times New Roman");  setToolTipFontSize(18);
setToolTipDelay(1);
See setToolTipColor(), setToolTipFontName(), setToolTipFontStyle().
x
This method assigns a font style
to tool tip strings (for example, bold, italic, underline).
Syntax:
void setToolTipFontStyle(int nFontStyle)
where:
- nFontStyle
Is the font style. Values can be:
- 0 = Plain
- 1 = Italic
- 2 = Bold
- 3 = Italic/Bold
- 4 = Underline
- 5 = Italic/Underline
- 6 = Bold/Underline .
- 7 = Bold/Italic/Underline
Return: void;
Example:
setDepthAngle(0);
setDepthRadius(0);
setToolTipDisplay(true);
setToolTipBackgroundColor(new Color (0,255,0));
setToolTipBackdropColor(new Color(0,0,255));
setToolTipColor(new Color(255,0,0));
setToolTipBackdropSize(10);
setToolTipFontName("Times New Roman");
setToolTipFontSize(18);  setToolTipFontStyle(2);
setToolTipDelay(1);
See setToolTipColor(), setToolTipFontName(), setToolTipFontSize().
x
This method turns off the generation of events for tool
tips until a triggering event such as dwelling over some other object
generates a new tool tip event.
Syntax:
void setToolTipOff();
Return: void;
x
This method turns on the generation
of events for tool tips.
Syntax:
void setToolTipOn();
Return: void;
See setToolTipOff().
xsetTransparentBorderColor()
This method applies a transparent border color to an
object.
Syntax:
void setTransparentBorderColor(boolean newValue);
void setTransparentBorderColor(IdentObj id,
    boolean newValue);
where:
- id
Is an object ID returned by a getObjectID() method.
- newValue
TRUE applies transparent border color.
FALSE draws
the border in black (the default) or the specified color.
Return: void;
Note: If an object ID (id) is not specified, newValue
is assigned to the first item in the selection list (if applicable).
See getTransparentBorderColor(), getBorderColor(), setBorderColor(),
setSeriesBorderColor().
xsetTransparentFillColor()
This method applies a transparent fill color to an object.
Syntax:
void setTransparentFillColor(boolean newValue);
void setTransparentFillColor(IdentObj id,
    boolean newValue);
where:
- id
Is an object ID returned by a getObjectID() method.
- newValue
Can be one of the following values:
true,
applies transparent fill color to the object.
false,
does not apply transparent fill color to the object.
Return: void;
Note: If an object ID (id) is not specified, newValue
is assigned to the first item in the selection list (if applicable).
See getTransparentFillColor(), getFillColor(), setFillColor(), setSeriesFillColor().
xsetUseReferenceLineXYRatio()
This method enables/disables the use of the setReferenceLineXYRatio() method.
Syntax:
void setUseReferenceLineXYRatio(IdentObj id, boolean);
where:
- id
The id is getReferenceLineXY().
- boolean
Can be one of the following:
True enables
the use of setReferenceLineXYRatio().
False disables
the use of setReferenceLineXYRatio(). This is the default value.
x
When the ToolTipDisplay property is enabled (true) and
the ToolTipMode property selects user information mode (0), the
setUserToolTip() method can be used to define a custom tool tip
string that will be displayed when the user positions the mouse pointer
over a selectable object in a graph.
Syntax:
void setUserToolTip (String CustomToolTip);
where:
- CustomToolTip
Is any string of characters which may or may not include
the following macros:
Example: [ON] is ([OID]) [R] Instance # [OIN]
Return: void;
See ToolTipDisplay, ToolTipMode.
x
The setUserToolTipDefault() method selects the default
user tool tip strings that are provided with the application. When
ToolTipMode selects developer information, the default tool tip
string consists of the following: series number, group number, and
value.
Example:
Series: 3Group: 4Value: 60.0
Syntax:
void setUserToolTipDefault( );
Return: void;
Example:
setGraphType(32);
setToolTipDisplay(true);  setUserToolTipDefault();
setDataRange(0,0,2,2);
See ToolTipDisplay, ToolTipMode.
xsetUseTextBackgroundColor()
This method can be used to enable (true) / disable (false),
the background color for a text object that can be set by setTextBackgroundColor().
When disabled (false), the background color of a text object is
ignored. When enabled (true), the background color of a specified
text object is applied.
Syntax:
void setUseTextBackgroundColor(
     IdentObj idObj,
     boolean newValue);
where:
- idObj
Is the object ID returned by a getObjectID() method (for
example, getTitle())
- newValue
Can be one of the following values:
true applies
background color
false does not apply background color
Return: void;
Example:
setUseTextBackgroundColor(getTitle(), false);  setUseTextBackgroundColor(getSubtitle(), true);
setTextBackgroundColor(getSubtitle(), new Color(255,255,0));
See setTextBackgroundColor().
x
This assigns the waterfall mode (normal, subtotal, total
or extra) to a specified group in a waterfall graph.
Syntax:
void setWaterfallGroupMode(int nGroup, int nGroupMode)
where:
- nGroup
Is a group number.
- nGroupMode
Is a group mode. Values can be:
- WATERFALLGROUPMODE_NORMAL
= 0 Normal
- WATERFALLGROUPMODE_SUBTOTAL
= 1 Subtotal
- WATERFALLGROUPMODE_TOTAL
= 2 Total
- WATERFALLGROUPMODE_EXTRA
= 3 Extra
Return: void;
Example:
setGraphType(100);
setUseSampleData(false);
setDepthRadius(0);
setDepthAngle(0);
setData(0, 0, 10);
setData(1, 0, 20);
setData(2, 0, 30);
setGroupLabel(0,"Grp0");
setData(0, 1, 40);
setData(1, 1, 50);
setData(2, 1, 60);
setGroupLabel(1,"Grp1");
setData(0, 2, 0);
setData(1, 2, 0);
setData(2, 2, 0);  setWaterfallGroupMode(2, 1);
setGroupLabel(getGroup(2), "Subtot1");
setData(0, 3, 10);
setData(1, 3, 20);
setData(2, 3, 30);
setGroupLabel(3, "Grp3");
setData(0, 4, 0);
setData(1, 4, 0);
setData(2, 4, 0);  setWaterfallGroupMode(4, 2);
setGroupLabel(getGroup(4), "Total");
setData(0, 5, 10);
setData(1, 5, 20);
setData(2, 5, 30);  setWaterfallGroupMode(5, 3);
setGroupLabel(getGroup(5), "Extra");
setStackedDataValueSum(true);
setDataTextDisplay(true);
setTextJustHoriz(getDataText(),1);
setFontSizeAbsolute(getDataText(),true);
setFontSize(getDataText(),10);
setFontSizeAbsolute(getO1Label(0),true);
setFontSize(getO1Label(0),12);
setDataRangeToExtent();
setSeriesLabel(0, "Series 0");
setSeriesLabel(1, "Series 1");
setSeriesLabel(2, "Series 2");
setTitleString("Waterfall Chart");
Note: For a Normal group, series risers are stacked on
top of each other and each successive series represents the value
of its series/group plus any preceding series/group. For a subtotal
or total group, the data for the group is ignored and the cumulative
total up to this point will be shown for this group. Only one group
in a graph can designated as a total. An extra group is not used
when performing any waterfall cumulative sums. It will appear just
as stacked data. When used, it should be defined as the last group in
the graph.
x
This method defines the custom X1 coordinate based on
the reference object.
Syntax:
void setX1(IdentObj IDobj, value);
where:
- IDobj
Is the object ID of a reference object. The reference objects
are getReferenceLineXY(), getReferenceRect(), and getReferenceMarker().
- value
Can be one of the following:
(0…1) when setReferencePercentageMode()
is set to true.
The real value of the X-axis when setReferencePercentageMode()
is set to false. This is the default value.
See getReferenceLineXY(), getReferenceRect() , getReferenceMarker().
x
This method defines the custom X2 coordinate based on
the reference object.
Syntax:
void setX2(IdentObj IDobj, value);
where:
- IDobj
Is the object ID of a reference object. The reference objects
are getReferenceLineXY() and getReferenceRect().
- value
Can be one of the following:
(0…1) when setReferencePercentageMode()
is set to true.
The real value of the X-axis when setReferencePercentageMode()
is set to false. This is the default value.
See getReferenceLineXY(), getReferenceRect() .
x
This method defines the custom Y1 coordinate based on
the reference object.
Syntax:
void setY1(IdentObj IDobj, value);
where:
- IDobj
Is the object ID of a reference object. The reference objects
are getReferenceLineXY(), getReferenceRect(), and getReferenceMarker().
- value
Can be one of the following:
(0…1) when setReferencePercentageMode()
is set to true.
The real value of the Y-axis when setReferencePercentageMode()
is set to false. This is the default value.
See getReferenceLineXY(), getReferenceRect() , getReferenceMarker().
x
This method defines the custom Y2 coordinate based on
the reference object.
Syntax:
void setY2(IdentObj IDobj, value);
where:
- IDobj
Is the object ID of a reference object. The reference objects
are getReferenceLineXY() and getReferenceRect().
- value
Can be one of the following:
(0…1) when setReferencePercentageMode()
is set to true.
The real value of the Y-axis when setReferencePercentageMode()
is set to false. This is the default value.
See getReferenceLineXY(), getReferenceRect() .
x
This function sets the value of the current zoom state.
When data zooming is enabled with the zoom properties/methods
or via the user interface (setSelectionEnable(5)), a zoom index
is maintained that keeps track of the number of times a graph has
been zoomed in and the state of zooming. As an example, assume ZoomPercentage
is set to 10%, and the user clicks once. The graph is now zoomed to
90% of its original value, and the zoom index is now 1. Now the
user clicks a second time. The graph is now zoomed to 80% of its
original value, and the zoom index now is 2. Or, actually, the zoom
index now has two entries: one for the first, 90% state, and a second
for the second, 80% state.
You can keep adding to the zoom index
as the user continues to click. Continuing with the example and
the same values, assume the user has clicked eight consecutive times. The
zoom index now contains eight items:
- First Level: Zoom Factor 90%
- Second Level:
Zoom Factor 80%
- Third Level:
Zoom Factor 70%
- Fourth Level:
Zoom Factor 60%
- Fifth Level:
Zoom Factor 50%
- Sixth Level:
Zoom Factor 40%
- Seventh Level:
Zoom Factor 30%
- Eighth Level:
Zoom Factor 20%
Your application can go back and forth in this list. For example,
assume you want to switch from the current level (the last level
the user clicked, the eighth zoom level which currently shows 20%
of the original state). You could use setZoomIndex(4) to immediately switch
to the fourth level which had a zoom factor of 60%. You can use
setZoomIndex() to switch back and forth between any zoom level set.
Syntax:
void setZoomIndex(int index);
where:
- index
Is the new zoom index value.
Return: void;