In this section: |
The Format tab contains different options for selecting output formats and other reporting features, depending on whether you are creating a report or a chart.
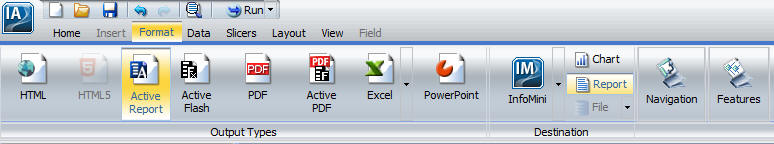
For reports, the Format tab provides access to the Output Types, Destination, Navigation, and Features groups. It is shown in the following image.
For charts, the Format tab provides access to the Output Types, Destination, Chart Types, Features, and Labels groups, as shown in the following image.

In this section: |
The Output Types group contains commands to create output in any of the supported formats listed in the following table. When you run a report, the output is created in the format that is currently selected. You can also set output format options by going to the Home tab, and in the Format group, selecting from the menu of output options. In addition, you can select an output from the output format button in the status bar. For more information on the additional Excel formats available for reports, see Report Outputs.
|
Format |
Reports |
Charts |
Dashboards and Documents |
|---|---|---|---|
|
HTML |
Available (default)
|
Available (default)
|
Available |
|
HTML5 |
Not Available |
Available |
Not Available |
|
active Report |
Available |
Available |
Available (dashboard default)
|
|
active Flash |
Available |
Available |
Available |
|
|
Available |
Available |
Available (document default)
|
|
active PDF (requires Adobe® Reader® 9.0 or later)
|
Available |
Available |
Available |
|
Excel formats |
Not Available |
Available |
Available |
|
PowerPoint |
Available |
Available |
Available |
|
PDF/GIF (must be set to display in InfoAssist Properties)
|
Not Available |
Available |
Not Available |
|
Visual Discovery AE |
Available |
Not Available |
Not Available |
|
PNG (must be set to display in InfoAssist Properties)
|
Not Available |
Available |
Not Available |
|
GIF (must be set to display in InfoAssist Properties)
|
Not Available |
Available |
Not Available |
|
JPEG (must be set to display in InfoAssist Properties)
|
Not Available |
Available |
Not Available |
|
SVG (must be set to display in InfoAssist Properties)
|
Not Available |
Available |
Not Available |
The HTML5 output format allows you to render a chart in the browser using a built-in JavaScript engine. Charts with this output format utilize the very latest capabilities of the HTML5 web standard, including animation, high-quality vector output and attractive alpha-channel and gradient effects.
The output types of PNG, GIF, JPEG and SVG do not appear in the Output Types group by default. You can enable them by opening the WebFOCUS Administration Console, selecting Utilities, and then InfoAssist Properties.
If these formats are not enabled and you try to open an existing procedure with PNG, then HTML becomes the output. In addition, the following warning messages could open:
When you run a report, the output is created in the format that is currently selected. You can also set output format options from the output format button in the status bar.
The Destination group contains commands to create an InfoMini application, an image file for a chart, a data file for a report, or a HOLD file.
When a chart is selected, clicking the File button or selecting Select a location and format from the File drop-down menu, opens the Select a location and format dialog box, as shown in the following image.
Note: The label Temporary appears at the top of the dialog box. When you select a folder, the label changes to Select a location and format, as shown in the following image.

In the Select a location and format dialog box, you are able to name the file and select the output type. The available output types are PNG, GIF, SVG, and JPEG. In order to create the image file, you need to execute the procedure.
Note: The File button is not available in InfoAssist Basic.
Note: InfoMini is not available in InfoAssist Basic.
Note: The Report to Chart, or Chart to Report conversion options are not available in InfoAssist Basic.
Note: The Report to Chart or Chart to Report conversion options are not available in InfoAssist Basic.
The Navigation group contains commands to customize output display and navigation.
Note: You can only choose one option from this group.
The commands are:
You can also select options to view the entire report or remove the table of contents. For more information, see How to Create Table of Contents Reports.
Note: The Table of Contents option is activated only when HTML, active report, Excel, or PowerPoint output format is selected.
Note: You cannot use the Table of Contents option with the Accordion feature. For more information, see How to Create Accordion Reports.
The Features group for reports contains commands to select specialized reporting features.
The commands are:
Note: You cannot use the Table of Contents with the Accordion feature. For more information, see Navigation Group (Reports Only).
The following table lists the output for which each feature is available. Yes means the output is available for the feature. No means that the output is not available for the feature.
|
HTML |
HTML5 |
active report |
active Flash |
|
active PDF |
Excel |
PowerPoint | |
|---|---|---|---|---|---|---|---|---|
|
Title Popup |
yes |
no |
no |
no |
no |
no |
no |
no |
|
Accordion |
yes |
no |
yes |
no |
no |
no |
no |
no |
|
Repeat Sort Values |
yes |
yes |
yes |
yes |
yes |
yes |
yes |
yes |
|
Stack Measures |
yes |
no |
no |
no |
no |
no |
no |
no |
|
active report options |
no |
no |
yes |
yes |
no |
yes |
no |
no |
|
Accessibility (reports, charts) |
yes |
no |
no |
no |
yes |
no |
no |
no |
|
Accessibility (documents) |
no |
no |
no |
no |
yes |
no |
no |
no |
The Features group for charts contains commands to select custom chart features.
The commands are:
Note: The reference line option is not available in InfoAssist Basic.
Note: The annotation option is not available in HTML5. The annotation option is not available in InfoAssist Basic.
Note: Gauge options are not available in InfoAssist Basic.
Note: Annotate is not available in HTML5.
Note: The chart features are unavailable when designing a chart that will be output in active report, active Flash, or active PDF formats.
The Chart Types group contains the most commonly used chart types, Bar (default), Pie, Line, Area, and Scatter.
Click Other to open the Other Chart Types dialog box, shown in the following image. Across the top of the dialog box are tabs which are depicted by icons. Each tab represents a chart type category. The left-most tab represents the bar chart category, which is selected by default. When a tab is selected, it displays thumbnail images of the bar chart variations that are supported by InfoAssist.
In this example, the Vertical Percent Bar chart type is selected. A description of the selected chart type is provided beneath the images.
For more information on the chart types that you can choose from, see Selecting a Chart.
The Labels group for charts contains the Axes and Legend drop-down menus.
The commands are:
Note: The Axes option to change data labels position is not available in InfoAssist Basic.
| WebFOCUS |