Creating Customized Report Outputs
In addition to HTML, active report, active Flash, PDF,
active PDF, Excel, and PowerPoint output formats, you can create
the following custom report output formats.
-
OLAP. To
view output with OLAP functionality. For more information, see How to Create OLAP Reports.
-
Table of Contents. To
view output for individual values of the first sort (By) field,
one value at a time. For more information, see How to Create Table of Contents Reports.
-
Freeze. To
view output with column titles that freeze (remain in view) when
you scroll through pages of the report output. For more information,
see How to Freeze Column Titles in Reports.
-
Pages On Demand. Provides
access to two distinct features depending upon the output type that
you have selected.
-
HTML. If you
select this output type, and click Pages on Demand,
then the report opens in the WebFOCUS Viewer.
The WebFOCUS Viewer
saves the bulk of your report to your web server and delivers one
page of report output at a time, decreasing the amount of time that
you wait for the report to process.
The bulk of your report
remains on the web server until you request it or close the WebFOCUS
Viewer.
The WebFOCUS Viewer menu bar, at the bottom of the
Viewer, contains options for navigating through the pages. For more
information on these options, see How to Create Pages On Demand Reports.
-
active reports. If
you select this output type, and click Pages on Demand,
then active cache is enabled. For more information on active cache,
see Using the Active Cache Option.
-
Accordion. To
view output that is expandable for each vertical sort field. This
option displays data values only for the first vertical sort field
when you first view the output. You can manually expand your view
to expose the data values of lower-level sort fields. For more information,
see How to Create Accordion Reports.
x
Procedure: How to Create OLAP Reports
-
On the Format tab, in the Navigation group, click the Auto
Drill & Analysis down arrow.
The Auto Drill & Analysis menu opens. It contains the
following options:
-
OLAP
panel not accessible. (Default) Select this option to only
display sorting options in the column titles. The OCP (OLAP ribbon)
cannot be accessed from the title options.
-
OLAP
panel accessible. Select this option to access the OLAP panel
using the Auto Drill & Analysis button in the output of the
report.
Note: Using this option versus the hidden option
allows the user to better distinguish the difference between the
first and second options. The hidden option is available by accessing
the Navigation dialog box.
-
Dimension
filtering enabled. Select this option to display dimension filters
at the top of the report. You customize the filter placement within
the Navigation dialog box. You access the dialog box by clicking More
options.
-
Dimensions
grouped in tabs. Select this option to group dimension filters
in tabs based on hierarchy within statements in the metadata.
-
More Options. Select
this option to open the Auto Drill & Analysis dialog box, as
shown in the following image.
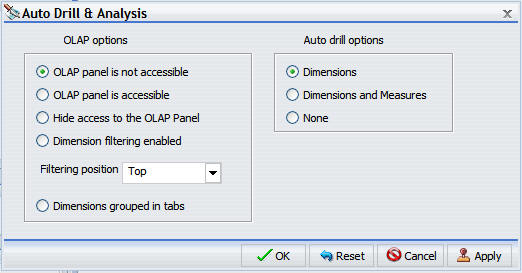
In
addition to the options discussed previously, the Auto Drill &
Analysis dialog box allows the following additional configuration
and customization options for OLAP output:
-
Select an option.
Selecting an option from the OLAP group, such as OLAP
panel is accessible, generates output that invokes OLAP
processing. The following image is an example of an OLAP report.
The OLAP button below the report, when clicked, launches the OLAP
ribbon.
x
Procedure: How to Create Table of Contents Reports
Note: You
cannot use the Table of Contents with the Accordion feature.
-
Create a
report.
-
On the Format tab, in the Navigation group, click Table
of Contents.
A table of contents button appears in the top-left corner
of the report output, as shown in the following image.
-
Double-click the button to display the Table of Contents menu,
shown in the following image. The Table of Contents menu enables
you to select and view individual values of the first sort (By)
field, one value at a time.
Drag
the Table of Contents menu in any direction to view the report
output, which appears behind the menu by default.
Select a sort field to view values for that field. In the
following example, clicking NorthEast displays
the corresponding report output.
You
can also select options to view the entire report or remove the
table of contents.
x
Procedure: How to Freeze Column Titles in Reports
On the
Format tab, in the Navigation group, click Freeze.
Column titles freeze (remain in view)
when you scroll through pages of the report output.
The following
image shows the scroll bar that appears when you freeze column titles.
x
Procedure: How to Create Pages On Demand Reports
This
procedures describes using the Pages on Demand feature to create
an HTML report.
-
Create a
report.
The default output is HTML.
-
On the Format
tab, in the Navigation group, click Pages on Demand.
-
Run the
report.
The report opens in the WebFOCUS Viewer, as shown in the
following image.
-
Navigate
through the report using the navigation options available on the
WebFOCUS Viewer menu bar.
The options are:
- Go to a specific
page
- Retrieve all pages
- Go to the first page
- Go to the previous
page
- Go to the next page
- Go to the last page
- Perform case-sensitive
and case-insensitive searches
- Perform forward and
backward searches
- Access WebFOCUS Viewer
Help
- Close the WebFOCUS
Viewer
x
Procedure: How to Create Accordion Reports
Note: You
cannot use the Table of Contents in conjunction with the Accordion
feature.
-
Create a
report.
The following image shows a chart before the accordion option
is applied.
-
On the Format tab, in the Features group, click Accordion.
Plus signs, shown in the following image, indicate that there
are expandable views of data for each vertical sort field.
You
can manually expand your view to expose the data, as shown in the
following image.
x
Procedure: How to Implement Stack Measures
On the
Format tab, in the Features group, click Stack Measures.
All
measures on the report are stacked.
The following image shows
a report in Live Preview before the Stack Measures option is enabled.
The
following image shows a report in Live Preview after the Stack Measures
option is enabled.