Field Properties and Report Options Dialog Boxes

In this section:

Report Painter provides tabbed dialog boxes that handle a wide range of tasks for columns and reports. Although there are alternative ways to accomplish some of these tasks (from right-click menus, toolbar buttons, and menu bar options), you can:


Top of page

x
Field and Column Total Properties Dialog Boxes

Reference:

Right-click columns or column totals and select Options to make the Field Properties dialog boxes available.


x
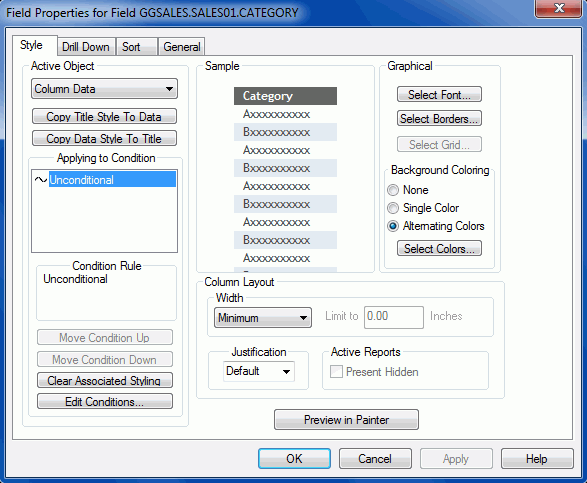
Reference: Field Properties Style Tab

Right-click a column in the Report Painter window and click Options from the context menu. The Field Properties dialog box opens at the Style tab.

Column Data is displayed as the default active object. Column Title and Column Title and Data can be selected from the drop-down list.

active object

Object areas, such as Column Data, Column Title, and Column Title and Data can be selected from the active object drop-down list. You can apply conditions, colors, grids, or borders to an object area.

Copy Title Style to Data

Copies the title styling attributes (conditional or unconditional) of a column to the data component of the column.

Copy Data Style to Title

Copies the data conditional styling attributes (conditional or unconditional) of a column to the title component of the column.

Applying to Condition

Displays existing conditions created with the Condition List and Edit Condition dialog boxes.

Condition Rule

Displays the selected condition rules you created in the Edit Condition dialog box.

Move Condition Up and Move Condition Down

Rearranges the order of conditions applied in a column. Order is significant because conditions are applied in the order listed. For example, if the first and last conditions are both true, the style in the last condition will override the style in the first.

Clear Associated Styling

Clears associated styling for a column. Select a defined condition from the Applying to Condition dialog box in the Style tab and click this button.

Edit Conditions

Opens the Condition List dialog box. Click New to launch the Edit Condition dialog box, where you can create a new condition or edit an existing one. You can define conditions that control when to apply particular fonts, point size, text style, grids, color, and drill-down procedures.

Column Layout

Click the Width or Limit to option.

Note: To use these features in HTML reports, ensure that the Cascading Style Sheets option is selected on the Report Options Features tab.

Width

Choose one of the following options from the Width drop-down list:

  • <not set>. No width option is selected.
  • Maximum. Sets the width according to the length defined in the field format.
  • Minimum. Sets the width of the column according to the widest value or heading in the field. This is selected by default.
  • Truncate. Enables you to specify where to truncate the column width based on the specified units (inches or centimeters). To indicate that a field value has been truncated in the browser, WebFOCUS places an exclamation point (!) after every alphanumeric and text field value and an asterisk (*) after every numeric field value.
  • Wrap. Enables you to specify where to wrap data based on the specified units (inches or centimeters).

    For related information, see Formatting a Column.

Limit to

Enables you to specify where to truncate or wrap data based on the specified units (inches or centimeters).

Note that the Limit to option is only activated when Truncate or Wrap is selected.

Justification

Select a justification option for the selected column: Left, Right, Center, or Default to reinstate the default setting (left for alphanumeric columns, right for numeric columns).

Present Hidden

Enables you to select the Present Hidden option, which determines the columns that will be hidden from view in the report output, when using the HTML active report output format. For more information, see Show/Hide Report Columns in the Active Technologies User's Guide.

Preview in Painter

Enables you to preview a styling attribute in the Report Painter window (in addition to the Sample window in the Style tab).

Select Font

Click the Select Font button to open the Font dialog box, where you can specify the font, font style, size, effects, and color for the selected object.

Select Borders

Opens the Borders dialog box, from which you can apply borders to the selected column.

Note: If grids are on, you cannot use the Borders feature.

Select Grid

Opens the Grid dialog box, from which you can apply a grid to the selected column. For PDF and Postscript styled report formats, you can specify a grid type (horizontal and vertical, horizontal, or vertical) and a Line style (none, light, or heavy).

These options are not supported in HTML styled report formats.

The Select Grid button will be unavailable when the report includes one or more style sheet files that have border styling. To enable the button, you need to select a different style sheet.

Background Coloring

You can apply a background color to Column Data, Column Title, or Column Title and Data.

Choose one of the following options:

Single Color

Click Single Color, then click Select Colors to open the Color dialog box. You can then select one background color.

Alternating Colors

Select Alternating Colors, then click Select Colors to open the Choose Background Colors dialog box. You can then assign alternating background colors to rows within columns.

Select Colors

Click the Select Colors button to open the Choose Background Colors dialog box. You can then assign alternating background colors to rows within columns. This button is available if either Single Color or Alternating Colors is chosen.


x
Reference: Field Properties Drill Down Tab

The Field Properties Drill Down tab is shown in the following image.

Right-click a column in the Report Painter window and choose Options from the context menu. The Field Properties dialog box opens. Click the Drill Down tab. Use the following options to supply information required to link a report to another report, a URL, JavaScript, Maintain procedure, Maintain Case, or Drill Through. For details, see Creating a Drill Down Procedure.

Multiple Drill Downs must be checked for Drill Menu Items to be displayed.

When No Action or Default is chosen from the Drill Down Type drop-down menu, Procedure Name, Target Frame, and With Parameters will not be displayed.

The Drill Through option is only available for PDF formatted reports.

The following options are available on the Field Properties Drill Down tab:

active object

Select one of the following from the drop-down list. The drill-down action is applied to the selected object:

  • Column Title and Data
  • Column Data
  • Column Title
Copy Title Style to Data

Copies the title styling attributes (conditional or unconditional) of a column to the data component of the column.

Copy Data Style to Title

Copies the data conditional styling attributes (conditional or unconditional) of a column to the title component of the column.

Applying to Condition

Displays existing conditions created with the Condition List and Edit Condition dialog boxes. The value Unconditional means that any drill-down reports applied to the column will be applied unconditionally to the column.

Condition Rule

Displays the actual condition if a condition is selected in the Applying to Condition dialog box.

Move Condition Up/Move Condition Down

Rearranges the order of conditions applied to the drill-down report. Conditions are applied in the order listed. For example, if the first and last conditions are both true, the last condition will override the first.

Clear Associated Styling

Removes the current styling from the condition.

Edit Conditions

Opens the Condition List dialog box, from which you create a new condition, edit an existing condition, or delete a condition.

Drill Down Definition

Caution: Before you select a Drill Down Definition, specify the object to which the action will be applied (that is, Column Title and Data, Column Data only, or Column Title only).

Multiple Drill Downs

This field is only enabled if an HTML styled report format is selected in the Report Options dialog box. The multiple drill-down feature enables you to add detail to a report by creating hyperlinks that have multiple actions. For example, you can create hyperlinks that run a detailed report or Maintain procedure, execute a JavaScript function, and link to a URL. When you click a component in the summary report, a pop-up menu appears, with the possible options to drill down to.

The multiple drill-down feature applies to:

  • In the Report Options dialog box, the Select Format option must be HTML Web Document (HTML), HTML Table (HTMTABLE), HTML active report (AHTML), or User styled report format.
  • Data fields in the body of the report, not to headings, subheadings, footings, or subfootings.
Drill Menu Items

Displays the default drill-down name, DrillDown1, when the Multiple Drill Downs check box is selected. You can double-click the default name and enter another name for the first drill down. The Drill Menu Items input box also features buttons that allow you to add, delete, or change the order of drill-down names.

Drill Down Type
Default

Default is selected automatically. Procedure Name, Target Frame, and With Parameters will not be displayed while this is selected.

No action

Click No action to specify that no drill-down link will be executed.

Execute Procedure

Click Execute Procedure and enter the name of a procedure to link to in the Procedure Name field, or click the Browse button and choose the detail procedure from the Open dialog box. Click Open to open the Procedure window for the detail report.

Execute Guided Procedure

Click Execute Guided Procedure and click Edit to open the Guided DrillDown window. Select the Drilldown procedures you wish to use and any parameters you wish to pass to those procedures. This creates a parameter that allows the user to select the drill-down procedure to use at run time.

URL

Click URL and enter the address to link to in the URL field. Click Open to open the specified URL in a web browser.

This option is only available for HTML Web Document (HTML), HTML active report (AHTML), PDF, Excel (2000, 2000 Formula, 97) and User styled report formats.

URL from field

Click URL from Field and choose a field name from the drop-down list to indicate that the URL referenced is the value of that field.

For example, if the data source contains a field, such as E_MAIL whose values are the email addresses of every employee, select E_MAIL from the Field drop-down list as the URL, and supply the proper parameters. This action enables a user to click a last name in the web browser, which opens the email application with the email address of the individual selected.

This option is only available for HTML Web Document (HTML), HTML active report (AHTML), PDF, and User styled report formats.

JavaScript

Click JavaScript to execute a JavaScript function. Enter the name of the function in the JavaScript field.

This option is only available for HTML Web Document (HTML), HTML active report (AHTML), PDF, and User styled report formats.

Maintain Procedure

Provides a link to a Maintain procedure. Enter the name of the procedure in the Procedure Name field. For details, see Drilling Down to a Maintain Procedure.

Maintain Procedure Compiled

Provides a link to a compiled Maintain procedure. Enter the name of the procedure in the Procedure Name field. For details, see Drilling Down to a Maintain Procedure.

Maintain Case

Provides a link to a Maintain Case. Enter the name of the case in the Procedure Name field.

Note: A Maintain Case is also known as a Function.

Drill Through

Enables you to define hyperlinks between the individual report components within a single PDF formatted document.

Procedure Name

Enter the required value here, or choose one from the drop-down list.

Target Frame

Specifies that the results of the drill-down link display in a target frame on a webpage. Select from the following standard HTML frame names: _blank, _self, _parent, _top. You can select different frames for multiple drill downs.

Note: When specifying a target frame from Report Painter, manually added commands in the style sheet are not recognized. For example, manually entering TARGET=NEW is removed when the procedure is run in Report Painter. Report Painter removes commands that it does not generate itself. For this example, set the target to _BLANK to open a drill-down report in a new window.

With Parameters

Displays the parameters defined for the selected procedure or URL in the Drill Down Definition field.

Add Button

Enables you to create parameters for the selected procedure or URL. Opens the Drill Down Parameter dialog box.

Edit Button

Enables you to edit the selected parameter.

Delete Button

Deletes the selected parameter.


x
Reference: Field Properties Sort Tab

The Field Properties Sort tab is shown in the following image.
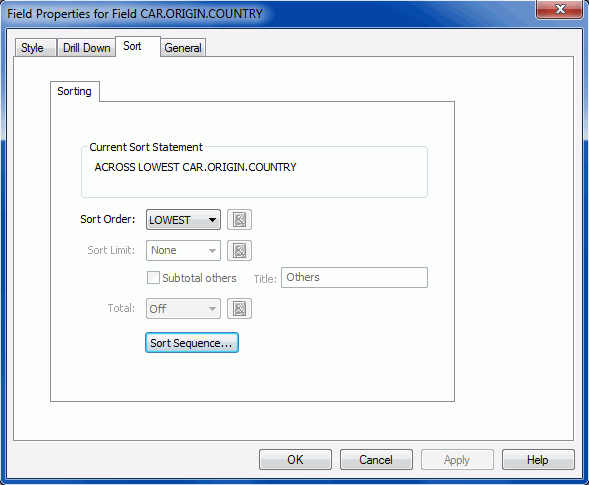
Select a column in the Report Painter window and click Options from the context menu. The Field Properties dialog box opens. Click the Sort tab. This tab appears only when the selected column has been designated as a sort column (either By or Across). For more details, see Sorting Data.

Sorting Tab

Current Sort Statement

Reflects the sort conditions that are in effect.

Sort Order

You can change the sort order of values in a column from lowest to highest, or vice versa, for alphanumeric (A to Z and Z to A) or numeric (1-10 and 10-1). You can also choose Variable and customize the sort order.

  • Click LOWEST to rank in ascending order (lowest to highest).
  • Click HIGHEST to rank in descending order (highest to lowest).
  • Click Variable to make the option a parameter whose value is prompted for at run time. Clicking the ampersand (&) button opens the Guided Variable Definition dialog box, which enables you to change the parameter name suffix, display text, order of values, and display or return values.
Sort Limit

If entered, this value limits the number of sort values to display. When used with Sort ascending, Limit displays the chosen number of lowest values. With Sort descending, it displays the chosen number of highest values. Limit is only supported for By fields.

Subtotal others

Selecting this option will subtotal the items selected.

Title

The title of the limit item.

Total

These options pertain to the total of an item.

  • On calculates and displays the total.
  • Off does not calculate or display the total. This is the default option.
  • Click Variable to make the option a parameter whose value is prompted for at run time. Clicking the ampersand (&) button opens the Guided Variable Definition dialog box, which enables you to change the parameter name suffix, display text, order of values, and display or return values.
Sort Sequence

The Sort Sequence button opens the Sort Sequence Builder, which allows you to pull in data from a field and customize sorting priorities. For more information, see Using the Sort Sequence Builder.

Grouping Tab

The Grouping tab is only available when you sort a report using a numeric sort field, as shown in the following image.
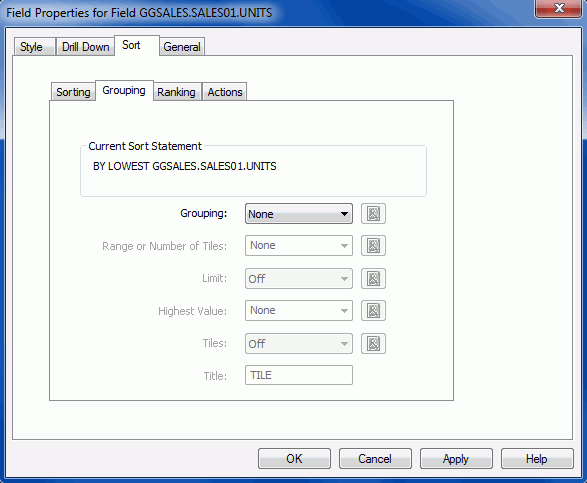
Current Sort Statement

Reflects the sort conditions that are in effect.

Grouping
None

No grouping option will be in effect. This is the default option.

IN-GROUPS-OF

Click this option to group sort field values in specified increments.

IN-RANGES-OF

Click this option to define the range by which sort field values are grouped.


Variable

Click Variable to make the option a parameter whose value is prompted for at run time. Click the ampersand (&) button to open the Guided Variable Definition dialog box, which enables you to change the parameter name suffix, display text, order of values, and display or return values.

Range or Number of Tiles

Allows for a range of number tiles to be present with the grouping.

  • None is the default option.
  • Select Variable to make the option a parameter whose value is prompted for at run time. Click the ampersand (&) button to open the Guided Variable Definition dialog box, which enables you to change the parameter name suffix, display text, order of values, and display or return values.
Limit

If specified, this value limits the number of groups of the specified interval to be retrieved.

  • On allows for a limit to be in place.
  • Off is the default option and does not allow for a limit to be in place.
  • Click Variable to make the option a parameter whose value is prompted for at run time. Click the ampersand (&) button to open the Guided Variable Definition dialog box, which enables you to change the parameter name suffix, display text, order of values, and display or return values.
Highest Value

In order to use the Highest Value option, Limit must be set to On or Variable. This option enables you set the highest value for the limit.

  • None is the default option.
  • Select Variable to make the option a parameter whose value is prompted for at run time. Click the ampersand (&) button to open the Guided Variable Definition dialog box, which enables you to change the parameter name suffix, display text, order of values, and display or return values.
Tiles

Select this option to group numeric data into any number of tiles (percentiles, deciles, quartiles, and so on). A new column, labeled TILE by default, is added to the report output and displays the tile number assigned to each instance of the tile field.

Title

You may type in a unique title name.

You can combine these selections with the list of defined Actions.

Ranking Tab

The Ranking tab is only available when you sort a report using a vertical sort field, as shown in the following image.
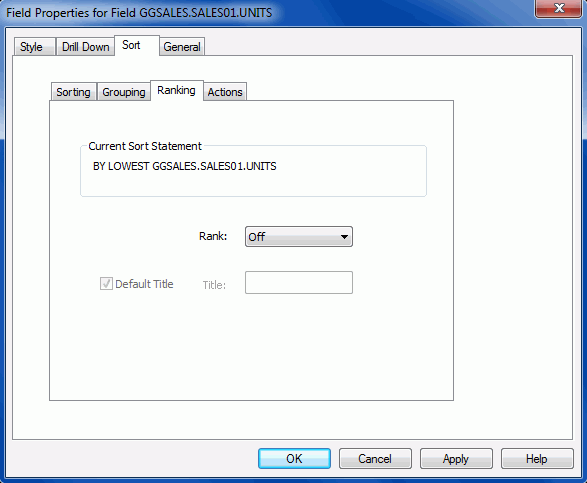
Current Sort Statement

Reflects the sort conditions that are in effect.

Rank

This option controls whether items are ranked or not.

  • When Off is selected, rankings will not be displayed. This is the default option.
  • When On is displayed, rankings will be displayed. Choosing this option allows you to edit the ranking title.
Title

Displays a default column title as RANK with the sort field. You may type in a unique title name for the ranked field. This field becomes active once On is selected in the Rank drop-down list.

Actions Tab

The Actions tab is only available when you sort a report using a vertical sort field, as shown in the following image.
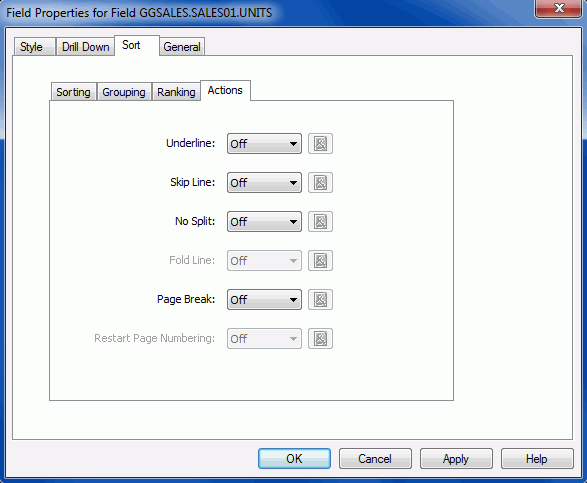
Underline

Includes a horizontal line across the width of a report after the value of the selected sort field changes. (To apply this action in HTML styled report formats, ensure that Cascading Style Sheets is selected on the Report Options Features tab.)

Click Variable to make the option a parameter whose value is prompted for at run time. Click the ampersand (&) button to open the Guided Variable Definition dialog box, which enables you to change the parameter name suffix, display text, order of values, and display or return values.

Skip Line

Skips a line on a report when the value of the selected sort field changes. (To apply this action in HTML styled report formats, ensure that Cascading Style Sheets is selected on the Report Options Features tab.)

Click Variable to make the option a parameter whose value is prompted for at run time. Click the ampersand (&) button to open the Guided Variable Definition dialog box, which enables you to change the parameter name suffix, display text, order of values, and display or return values.

No Split

Breaks sort fields logically and regenerates the field heading on the next page or screen.

Click Variable to make the option a parameter whose value is prompted for at run time. Click the ampersand (&) button to open the Guided Variable Definition dialog box, which enables you to change the parameter name suffix, display text, order of values, and display or return values.

Fold Line

Causes columns to be placed on a separate line when the value of the sort field changes. (This feature is not supported for HTML styled report formats.)

Click Variable to make the option a parameter whose value is prompted for at run time. Click the ampersand (&) button to open the Guided Variable Definition dialog box, which enables you to change the parameter name suffix, display text, order of values, and display or return values.

Page Break

Starts a new report page when the value of a selected sort field changes. (This feature is not supported for HTML styled report formats.)

Click Variable to make the option a parameter whose value is prompted for at run time. Click the ampersand (&) button to open the Guided Variable Definition dialog box, which enables you to change the parameter name suffix, display text, order of values, and display or return values.

Restart Page Numbering

Resets the page number to one at the sort break. The Page-break option must be selected.

Click Variable to make the option a parameter whose value is prompted for at run time. Click the ampersand (&) button to open the Guided Variable Definition dialog box, which enables you to change the parameter name suffix, display text, order of values, and display or return values.


x
Reference: Field Properties General Tab

The Field Properties General tab is shown in the following image.
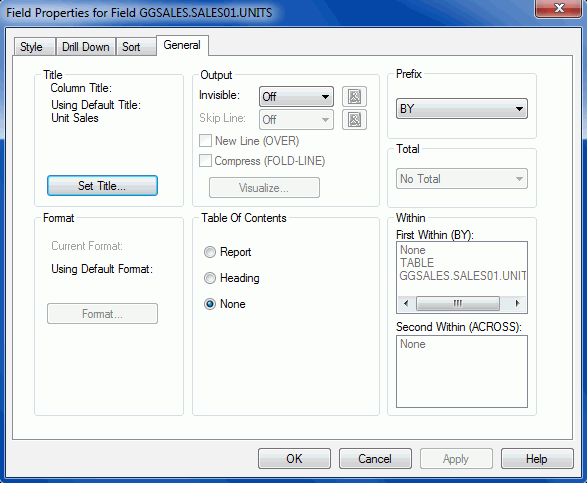
Select a column in the Report Painter window and click Options from the context menu. The Field Properties dialog box opens. Click the General tab, which includes the following fields.

Title

Displays the default column title. Click the Set Title button to open the Title dialog box, where you can type a new column title.

Format

Displays the current format of a column.

Click the Format button to open the Format dialog box, where you can change the format type and other date and time information. For details, see Format Dialog Box.

Output
  • The Invisible option enables you to control whether a column appears in the report, or is hidden. If you select On, the column is dimmed in the Report Painter window, but can still be used in calculations. Variable makes the option a parameter whose value is prompted for at run time. Click the ampersand (&) button to open the Guided Variable Definition dialog box, which enables you to change the parameter name suffix, display text, order of values, and display or return values.
  • Click Skip Line (SKIP-LINE) to add a blank line after every displayed line (in effect, double-spacing a report). Select Variable to allow you to click the ellipsis (...) button. Click the ellipsis (...) button to open the Guided Variable Definition window.
  • Click New Line (OVER) to place field names over one another. This is one way to decrease the width of a report, particularly when you are sorting horizontally (Across).
  • Click Compress (FOLD-LINE) to reduce the report width by stacking columns.
  • Click the Visualize button to open the Data Visualization dialog box, where you can enable a data visualization bar graph for the data in the selected numeric column. For details, see Data Visualization Dialog Box.

Table of Contents

Applies a dynamic table of contents to the first By field in an HTML report. This enables you to display every value of the highest-level sort field as a hyperlink, then toggle between a display of the entire report and of a designated section.

  • Select the Report check box to position the TOC icon in the upper-left corner of the executed report.
  • Select the Heading check box to position the TOC as an object in the page heading.
  • Select None to turn the feature off.

For details, see Navigating Sort Groups From a Table of Contents.

Prefix

Select an operator to perform a calculation or other manipulation directly on the values of a field and display the results in your report. The operator is applied to a single column and affects only that column. The list adjusts to display appropriate operators for the selected field. Note, however, that most operators apply to numeric fields that are being summed. For a list of operators, see Operations You Can Perform on Fields.

Total

When more than one field is present, this drop-down list becomes available. Choosing Total shows the total of the fields present. Summarize shows a summary of the fields present.

Within

Select a WITHIN phrase, which requires a BY phrase and/or an ACROSS phrase. A maximum of two WITHIN phrases can be used per display command.

Second Within

Select a second WITHIN phrase, if necessary.


x
Reference: Properties for Column Total Style Tab

The Properties for Column Total Style tab is shown in the following image.
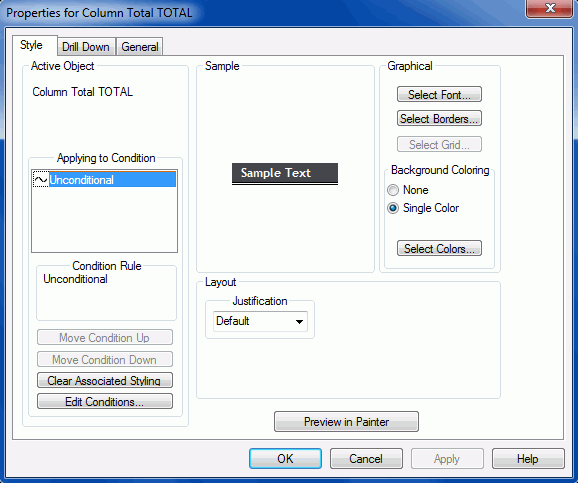
When using a column total field in the Report Painter window, right-click anywhere on the column total and click Options from the context menu. The Properties for Column Total dialog box opens at the Style tab.

Note: You may also style the Column Total from the Style tab of the Report Options dialog box.

active object

The active object area displays the name of the object property.

Applying to Condition

Displays existing conditions created with the Condition List and Edit Condition dialog boxes.

Condition Rule

Displays the selected condition rule(s) you created in the Edit Condition dialog box.

Move Condition Up and Move Condition Down

Rearranges the order of conditions applied in a column. Order is significant because conditions are applied in the order listed. For example, if the first and last conditions are both true, the style in the last condition will override the style in the first.

Clear Associated Styling

Clears associated styling for a column. Select a defined condition from the Applying to Condition dialog box in the Style tab and click this button.

Edit Conditions

Launches the Condition List dialog box. Click New to launch the Edit Condition dialog box, where you can create a new condition or edit an existing one. You can define conditions that control when to apply particular fonts, point size, text style, grids, color, and drill-down procedures.

Sample

Displays a sample of the selected item with the options you chose applied to it.

Layout

Enables you to select a justification option.

Justification

Select a justification option for the selected column: Left, Right, Center, or Default to reinstate the default setting.

Preview in Painter

Enables you to preview a styling attribute in the Report Painter window (in addition to the Sample window in the Style tab).

Graphical
Select Font

Opens the Font dialog box, where you can specify the font, font style, size, effects, and color for the selected object.

Select Borders

Opens the Borders dialog box, from which you can apply borders to the selected column.

Select Grid

Opens the grid dialog box, from which you can apply a grid to the selected column.

The Select Grid button will be unavailable when the report includes one or more style sheet files that have border styling. To enable the button, you need to select a different style sheet.

Background Coloring

You can apply a background color to the column total field. Choose one of the following options:

None

Removes any background color from the TOTAL field.

Single Color

Click the Single Color option button and then the Select Colors button to open the Color dialog box. You can then select one background color.

Select Colors

Click the Select Colors option button to open the Color selection window. From here, you can choose from any of the available colors.


x
Reference: Properties for Column Total Drill Down Tab

The Properties for Column Total Drill Down tab is shown in the following image.
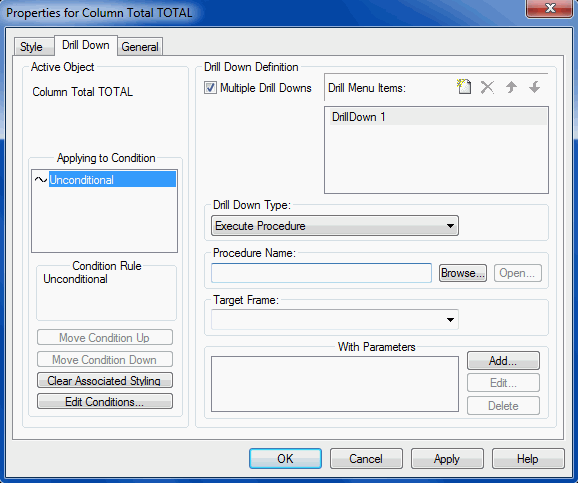
When using a column total field in the Report Painter window, right-click anywhere on the column total and click Options from the context menu. Click the Drill Down tab. Use the following options to supply information required to link a report to another report, a URL, JavaScript, Maintain procedure, Maintain Case, or Drill Through.

Multiple Drill Downs must be checked for Drill Menu Items to be displayed.

When No Action or Default is chosen from the Drill Down Type drop-down menu, Procedure Name, Target Frame, and With Parameters will not be displayed.

active object

The drill-down action is applied to the column total field.

Applying to Condition

Displays existing conditions created with the Condition List and Edit Condition dialog boxes. The value Unconditional means that any drill-down reports applied to the column will be applied unconditionally to the column.

Condition Rule

Displays the actual condition if a condition is selected in the Applying to Condition dialog box.

Move Condition Up and Move Condition Down

Rearranges the order of conditions applied to the drill-down report. Conditions are applied in the order listed. For example, if the first and last conditions are both true, the last condition will override the first.

Clear Associated Styling

Removes the current styling from the condition.

Edit Conditions

Opens the Condition List dialog box, from which you create a new condition, edit an existing condition, or delete a condition.

Multiple Drill Downs

This field is only enabled if an HTML styled report format is selected in the Report Options dialog box. The multiple drill-down feature enables you to add detail to a report by creating hyperlinks that have multiple actions. For example, you can create hyperlinks that run a detail report or Maintain procedure, execute a JavaScript function, and link to a URL. When you click a component in the summary report, a pop-up menu appears, with the possible options to drill down to.

The multiple drill-down feature applies to:

  • In the Report Options dialog box, the Select Format option must be HTML Web Document (HTML), HTML Table (HTMTABLE), HTML active report (AHTML), or User styled report format.
  • Data fields in the body of the report, not to headings, subheadings, footings, or subfootings.
Drill Menu Items

Displays the default drill down name, DrillDown1, when the Multiple Drill Downs check box is selected. You can double-click the default name and enter another name for the first drill down. The Drill Menu Items input box also features buttons that allow you to add, delete, or change the order of drill down names.

Drill Down Type
Default

Default is automatically selected for you. No action is taken and no other options are available in the Drill Down Type section when this option is selected.

No action

Click No action to specify that no drill-down link will be executed.

Execute Procedure

Click Execute Procedure and enter the name of a procedure to link to in the Procedure Name field, or click the Browse button and choose the detail procedure from the Open dialog box. Click Open to open the Procedure window for the detail report.

Execute Guided Procedure

Click Execute Guided Procedure and click Edit to open the Guided DrillDown window. Here you can select the Drilldown procedures you wish to use and any parameters you wish to pass to those procedures. This creates a parameter that allows the user to select the drill-down procedure at run time.

URL

Click URL and enter the address to link to in the URL field. Click Open to open the specified URL in a web browser.

This option is only available for HTML Web Document (HTML), HTML active report (AHTML), PDF, Excel (2000, 2000 Formula, 97) and User styled report formats.

URL from field

Click URL from field and choose a field name from the drop-down list to indicate that the URL referenced is the value of that field.

For example, if the data source contains a field, such as E_MAIL whose values are the email addresses of every employee, select E_MAIL from the Field drop-down list as the URL, and supply the proper parameters. This action enables a user to click a last name in the web browser, which opens the email application with the email address of the individual selected.

This option is only available for HTML Web Document (HTML), HTML active report (AHTML), PDF, and User styled report formats.

JavaScript

Click JavaScript to execute a JavaScript function. Enter the name of the function in the JavaScript field.

This option is only available for HTML Web Document (HTML), HTML active report (AHTML), PDF, and User styled report formats.

Maintain Procedure

Provides a link to a Maintain procedure. Enter the name of the procedure in the Procedure Name field. For details, see Drilling Down to a Maintain Procedure.

Maintain Procedure Compiled

Provides a link to a compiled Maintain procedure. Enter the name of the procedure in the Procedure Name field. For details, see Drilling Down to a Maintain Procedure.

Maintain Case

Provides a link to a Maintain Case. Enter the name of the case in the Procedure Name field.

Note: A Maintain Case is also known as a Function.

Drill Through

Enables you to define hyperlinks between the individual report components within a single PDF formatted document.

Procedure Name

Enter the required value here, or choose one from the drop-down list.

Target Frame

Specifies that the results of the drill-down link display in a target frame on a webpage. Select from the following standard HTML frame names: _blank, _self, _parent, _top. You can select different frames for multiple drill downs.

Note: When specifying a target frame from Report Painter, manually added commands in the Style Sheet are not recognized. For example, manually entering TARGET=NEW is removed when the procedure is run in Report Painter. Report Painter removes commands that it does not generate itself. For this example, set the target to _BLANK to open a drill-down report in a new window.

With Parameters

Displays the parameters defined for the selected procedure or URL in the Drill Down Definition field.

Add Button

Enables you to create parameters for the selected procedure or URL. Opens the Drill Down Parameter dialog box.

Edit Button

Enables you to edit the selected parameter.

Delete Button

Deletes the selected parameter.


x
Reference: Properties for Column Total General Tab

The Properties for Column Total General tab is shown in the following image.
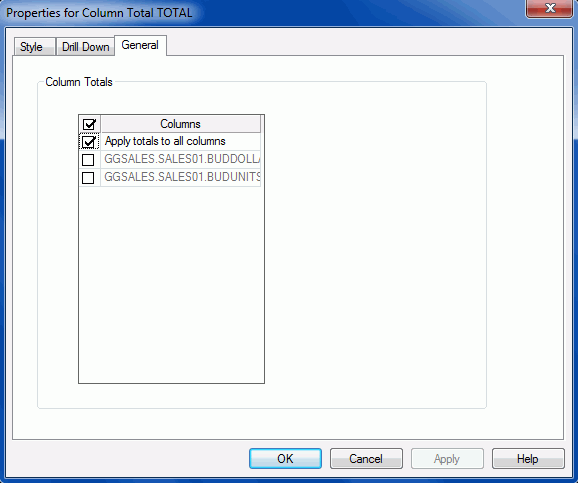
When using a column total field in the Report Painter window, right-click anywhere on the column total and click Options from the context menu. Click the General tab to apply column totals to selected fields in the report.

Columns

Select the check box next to the numeric value field(s) to be included in the column total.

Note: Apply totals to all columns is selected by default.

Top of page

x
Report Options Dialog Boxes

Reference:

The Report Options dialog boxes are available from the Report Options button on the Output Format toolbar. You can also access each Report Option tab directly from the Report menu.


x
Reference: Report Options Output Tab

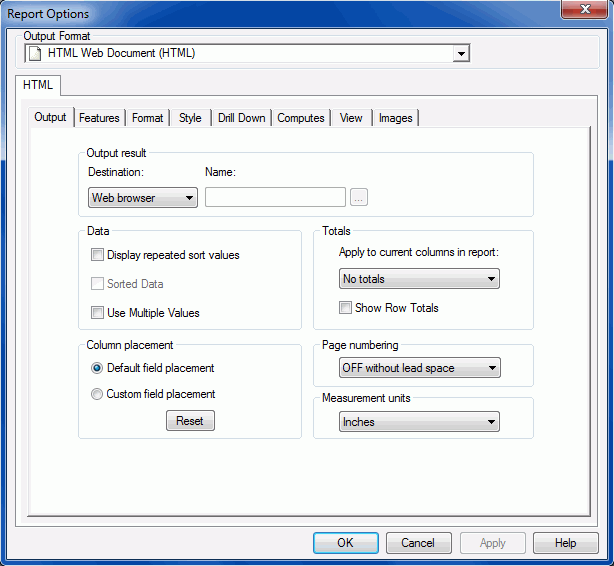
The Report Options Output tab is show in the following image.

Output result
Destination

The format displays the selected output format for the report output.

  • Web browser. The report output displays in a web browser and adds PCHOLD to the code.
  • Temporary file. The report output displays in a temporary file and adds HOLD to the code.
  • Save file. The report output displays as alphanumeric record and adds SAVE to the code.


Name

This field is active when Temporary file or Save file is selected as the Destination.

  • Temporary file. Enter up to 66 characters as the temporary (HOLD) file name. The default file name is HOLD. HOLD enables you to retrieve and process data, then extract the results for further processing. The output is saved with an associated Master File.
  • Save file. Saves the file to a location when the report is executed. The report data is saved as text data, storing numeric fields in character format. ALPHA (FTM files) is the default save format. The output file contains data only.
Data
Display repeated sort values

Select this option to prevent discontinuous data in a report and display repeated sort values. This is recommended for use with Excel Named Ranges. For more information, see Using Excel Named Ranges in WebFOCUS Applications.

Sorted Data

If the data you are accessing is already in the correct sort order, you can prevent WebFOCUS from resorting it. This feature provides a fast method of retrieving data if it is already stored in the order required for display, and no further sorting is required.

Use Multiple Values

Enables you to add the same data value to multiple rows in the FML matrix. For example, the same value can exist as a single value in one row, as part of a range in another row, and in a calculation in a third row.

For data that has not been structured as a hierarchy, values continue to be listed in the FOR field values panel after being used in a row. Without this option, values are removed from the list after being used.

In a hierarchy, a used value remains in the FOR field values panel, where it appears in red to indicate that it has already been added to the matrix.

In both instances, you can reuse the value as required.

Totals
Apply to current columns in report
  • Click No totals to suppress the display of totals.
  • Click Column totals to display a total for every column in the report.
  • Click Summarize to recalculate values at a sort break.
Show Row Totals

Select the Show Row Totals check box to display a total for every row in the report.

Column placement
Default field placement

Select to prevent the relocation of sort fields.

Custom field placement

Select to move sort fields from their default locations.

Reset

Click to restore the default placement.

Page numbering
  • Click ON to number the pages and display the page number on the upper-left hand corner of the page.
  • Click OFF to suppress page numbering. Click OFF without lead space to suppress page numbering and the two leading blank lines normally on each page.
  • Click Use current FOCUS setting to number the page according to the values assigned to the SET PAGE-NUM command.
Measurement units

Determines the UNITS setting in the WebFOCUS StyleSheet. Available units are Inches, Centimeters, and Points.


x
Reference: Report Options Features Tab for HTML Reports

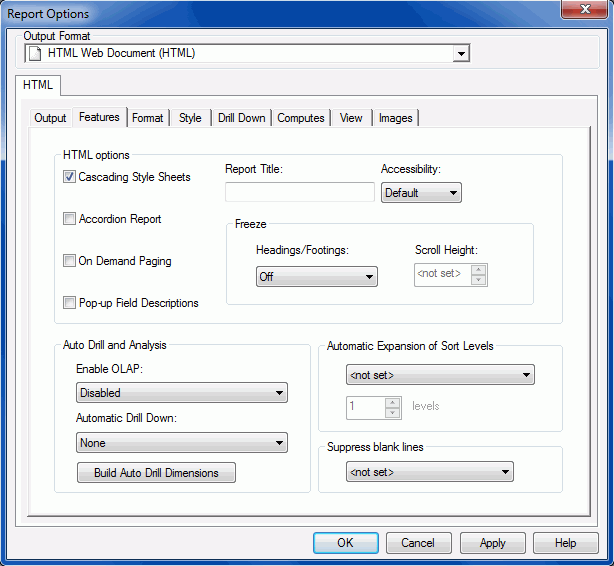
The following image shows the options that are available on the Features tab for HTML Web Document (HTML), HTML Table (HTMTABLE), Default, and User (HTML) reports.

HTML options
Cascading Style Sheets

Cascading Style Sheets improve many display options for HTML reports. Enable this option to take advantage of a variety of formatting enhancements.

Accordion Report

Provides a way to control the amount of sorted data that appears on an HTML report page. You can produce reports with expandable views of data for each vertical sort field. When an Accordion Report first appears, only data values of the first (highest-level) vertical sort field are shown. All other data is hidden. You can manually expand your view to expose data values of lower-level sort fields. For more information, see Controlling the Display of Sorted Data With Accordion Reports.

On Demand Paging

Displays one page of HTML report output and navigational controls. Use navigational controls to change the report page displayed in your browser.

Pop-up Field Descriptions

Displays pop-up field descriptions for column titles. For more information, see Displaying Pop-up Field Descriptions for Column Titles.

Report Title

The name that you type for an HTML report in this field will appear in the browser title bar.

Accessibility

Accessibility options customize how you view data on your computer. Select from Default, 508, or Off.

Freeze
Headings/Footings

Enables you to freeze the scrolling area of a report so that Headings/Footings display with the full report in a narrow browser window. Select from Off, On, Top, or Bottom.

Note: Freeze is not available when using the HTML Table (HTMTABLE) format.

Scroll Height

Enables you to specify the scroll height when freezing Headings/Footings, column titles, and totals.

Note: If the scroll height is not set, the default scroll height is 4 inches.

For more information about the freeze option, see How to Freeze the Scrollable Area for HTML Report Output.

Auto Drill and Analysis
Enable OLAP
  • Disabled. OLAP options are disabled and not shown in the OLAP report. By default, the Enable OLAP option is set to Disabled.
  • Off. Turns off the OLAP Control Panel and the OLAP Selections pane, but allows OLAP functionality from the report itself. You can access options on right-click menus, drag and drop columns within the report, and use up and down arrows to sort columns from high-to-low or vice versa.
  • On. Provides access to the OLAP Selections pane from a square button to the left of the column titles. You can open the Control Panel by clicking the OLAP button in the OLAP report.
  • Top Panel. Opens the OLAP Selections pane above the report. The Measures, Graph, and Dimension controls, the band containing the OLAP, Run, and Reset buttons appear above the report output. You can open the Control Panel by clicking the OLAP button on the Selection pane.
  • Bottom Panel. Opens the OLAP Selections pane below the report. The Measures, Graph, and Dimension controls, the band containing the OLAP, Run, and Reset buttons appear below the report output. You can open the Control Panel by clicking the OLAP button on the Selection pane.
  • Hidden Panel. Opens the OLAP report with the OLAP Selections pane hidden. You can perform a variety of analytic tasks from the report itself. Selection Criteria is shown next to the OLAP button.
  • Show Tabbed. For OLAP reports that have multiple dimensions, this option groups the dimension elements under a tab labeled with the dimension name.
Automatic Drill Down

Automatic Drill Down controls access to automatic drill downs in a report:

  • None disables automatic drill downs. By default, the Automatic Drill Down option is to None.
  • Dimensions enables automatic drill downs on dimensions in a report.
  • Dimensions and Measures enables automatic drill downs on dimensions and measures in a report.
Build Auto Drill Dimensions

The Build Auto Drill Dimensions button invokes the Dimension Builder, which enables you to create logical views based on enterprise data (relational or legacy data sources) for multi-dimensional analysis without manually editing metadata. For more information on Dimension Builder, see the Describing Data With Graphical Tools manual.

Automatic Expansion of Sort Levels

Generates an Accordion Report that expands by row. By default, this value is not set.

  • Only show top level. Creates an Accordion Report which initially displays only the highest sort field level. To see rows on lower levels, click the plus sign (+) next to one of the displayed sort field values.
  • Off. Does not create an Accordion Report
  • Expand everything. Creates an Accordion Report in which all sort field levels are initially expanded. To roll up a sort field level, click the minus sign (-) next to one of the sort field values on that level.
  • Expand n levels. Creates an Accordion Report in which n sort field levels are initially expanded. To roll up an expanded sort field level, click the minus sign (-) next to one of the sort field values on that level.
  • levels. Enables you to set the number of sort field levels. The default value is 1.
Suppress blank lines

Off. The suppression of blank lines will not occur.

Only within report body. The suppression of blank lines will only occur within the body of the report.


x
Reference: Report Options Format Tab for HTML Reports

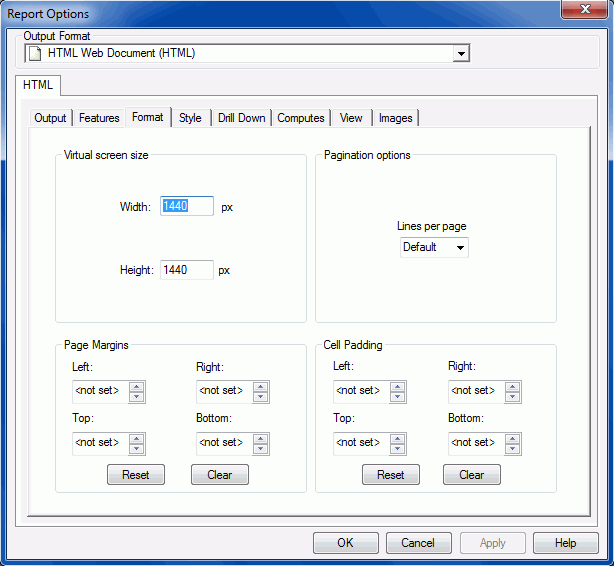
The following image shows the options that are available on the Format tab for HTML Web Document (HTML), HTML Table (HTMTABLE), Default, and User (HTML) reports.

Virtual screen size

Enables customization of the screen size for the report area that displays on the screen.

Note: Adjusting the virtual screen size applies to the work area in the Report Painter window. The report output is not affected by these settings.

Page Margins

Displays values that indicate the top, left, bottom, and right margins of the report page. Use the Reset and Clear buttons to reset to default values or clear your input.

Cell Padding

The amount of space between the gap values in the Cascading Style Sheet. Cell Padding displays values that indicate the top, left, bottom, and right margins. Values increment by 1/100 of an inch. Use the Reset and Clear buttons to reset to default values or clear your input.


x
Reference: Report Options Features Tab for PDF Reports

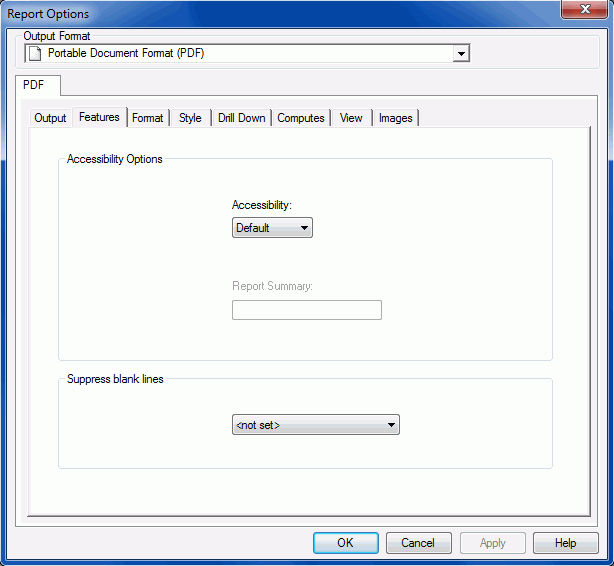
The following image shows the options that are available on the Features tab for Portable Document Format (PDF) reports.

Feature Tab for PDF Reports

Note: For the User format, if you want to use the accessibility option for PDF reports, you need to create and activate a style block for PDF using the Output Format toolbar. For more information on creating and activating style blocks, see Generating Format-Specific Style Blocks.

Accessibility Options
Accessibility

Customizes the viewing of data on your computer. Select the Accessibility options from Default, 508, or Off.

Report Summary

Type a summary about the report in the text box. This option is only available when Accessibility is set to 508. The typed summary is read aloud by a screen reader, such as JAWS®.

Suppress blank lines

Off. The suppression of blank lines will not occur.

Only within report body. The suppression of blank lines will only occur within the body of the report.

Only around heading/footing. The suppression of blank lines will only occur within the report body. This option is only available for the PDF, DHTML, PPT, and PS formats.

For entire report. The suppression of blank lines will occur throughout the entire report. This option is only available for the PDF, DHTML, PPT, and PS formats.


x
Reference: Report Options Features Tab for DHTML, PostScript, and PowerPoint Reports

The following image shows the options that are available on the Features tab for DHTML Web Document (DHTML) reports, PostScript (PS) reports, and PowerPoint (PPT) reports.

Feature Tab for DHTML, PostScript, and PowerPoint Reports

Suppress blank lines

Off. The suppression of blank lines will not occur.

Only within report body. The suppression of blank lines will only occur within the body of the report.

Only around heading/footing. The suppression of blank lines will only occur within the report body. This option is only available for the PDF, DHTML, PPT, and PS formats.

For entire report. The suppression of blank lines will occur throughout the entire report. This option is only available for the PDF, DHTML, PPT, and PS formats.


x
Reference: Report Options Features Tab for an Active Technologies Report

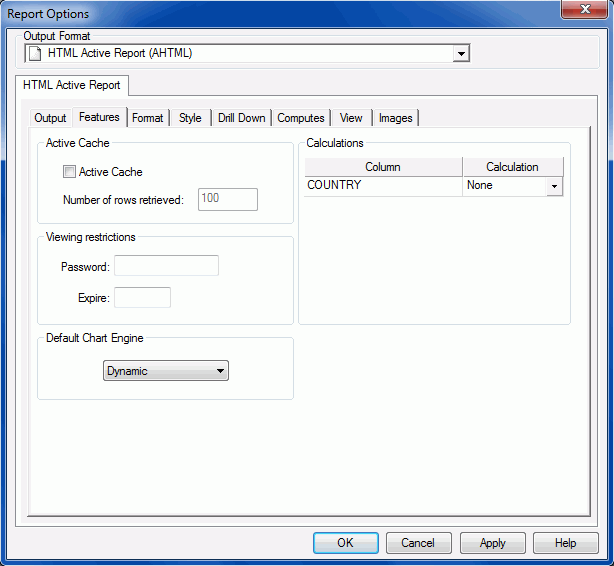
The following image shows the options that are available on the Features tab for HTML active reports (AHTML), active report for Adobe® Flash® Player (FLEX), and active report for Adobe Flash Player in PDF (APDF). For more information about HTML active reports, see Creating an Active Technologies Report. For more information about active reports for Adobe Flash Player, see the WebFOCUS Active Technologies User's Guide.


x
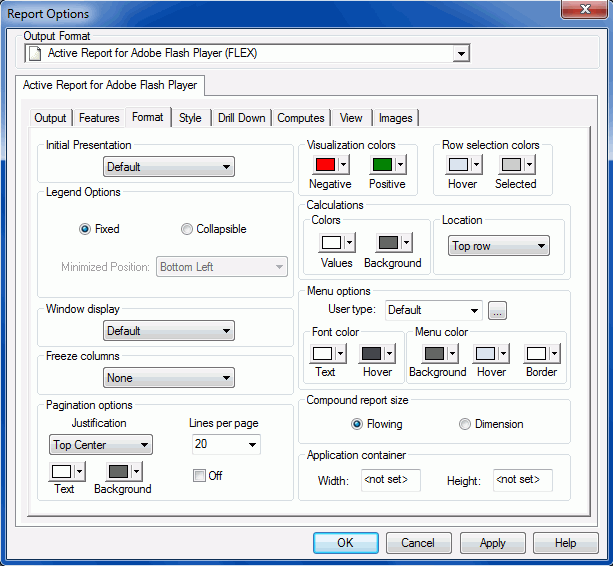
Reference: Report Options Format Tab for an Active Technologies Report

The following image shows the options that are available on the Format tab for HTML active reports (AHTML), active report for Adobe Flash Player (FLEX), and active report for Adobe Flash Player in PDF (APDF). For more information about HTML active reports, see Creating an Active Technologies Report. For more information about active reports for Adobe Flash Player, see the WebFOCUS Active Technologies User's Guide.

Note: The Application container options are not available on the Format tab for HTML active reports (AHTML).


x
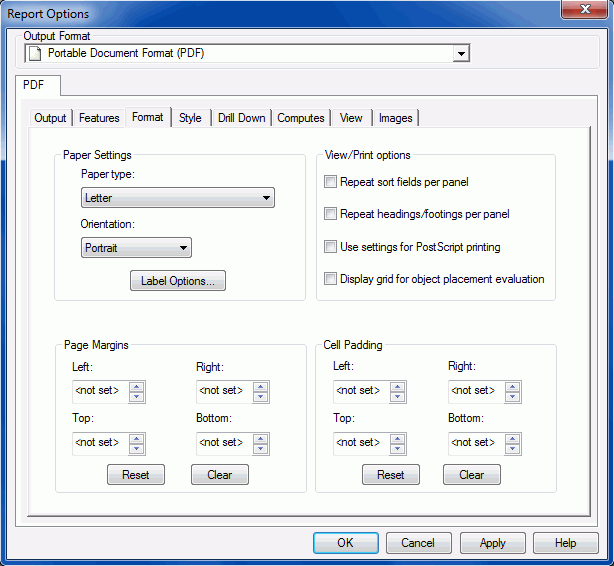
Reference: Report Options Format Tab for PDF, PostScript, or DHTML Reports

The following image shows the options that are available on the Format tab for Portable Document Format (PDF), PostScript (PS), and DHTML Web Document reports.

Paper Settings
Paper type

Displays a list of paper types or media to choose from.

Orientation
  • Click Portrait to print a report on a page that is taller than it is wide (vertically).
  • Click Landscape to print on a page that is wider than it is tall (horizontally).
Label Options

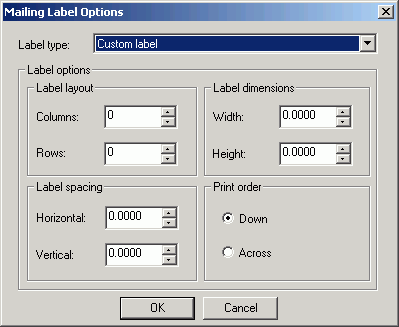
Launches the Mailing Label Options dialog box, where you can apply or customize label settings.

View/Print options
Repeat sort fields per panel

Enables the display of By fields in the left portion of each panel of a multi-panel report.

Repeat headings/footings per panel

Repeats headings/footings on each panel page when the columns presented on PDF reports cannot be displayed on a single page. For more information, see How to Repeat Headings and Footings Per Panel in PDF Report Output.

Note: This option is available only for PDF report output. If PS or DHTML is selected as the report output format, this option is unavailable.

Use settings for PostScript printing

Sends the page settings to a PostScript printer when printing in PS format.

Display grid for object placement evaluation

Displays a grid in the report output, which enables you to evaluate the correct placement of data and objects during your report design.

Tip: The display grid for object placement evaluation option may also be enabled by using the LAYOUTGRID setting in the Set tool. For more information about the Set tool, see Customizing Your Environment in the Developing Reporting Applications manual.

Page Margins

Displays values that indicate the top, left, bottom, and right margins of the report page. Use the Reset and Clear buttons to reset to default values or clear your input.

Cell Padding

The amount of space between the gap values in the Cascading Style Sheet. Cell Padding displays values that indicate the top, left, bottom, and right margins. Values increment by 1/100 of an inch. Use the Reset and Clear buttons to reset to default values or clear your input.


x
Reference: Mailing Label Options Dialog Box

The following image shows the Mailing labels options.

For more information about the Mailing Label Options dialog box, see Creating Mailing Labels.


x
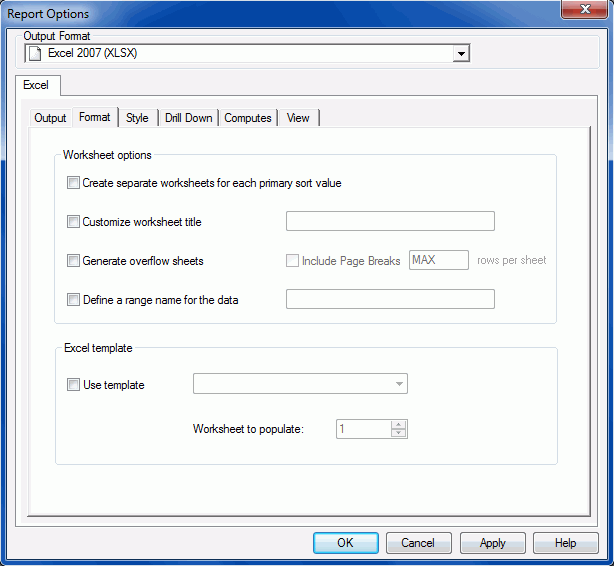
Reference: Report Options Format Tab for Excel Reports

The following image shows the options that are available on the Format tab for Excel 2000 (EXL2K), Excel 2007 (EXL07), Excel 2000 Formula (EXL2K FORMULA), Excel 2000 PivotTable (EXL2K PIVOT), and User (Excel) reports.

Worksheet options
Create separate worksheets for each primary sort value

Adds the highest-level sort field and its values as a TOC in the report. This option deactivates all other options on the Format tab.

Customize worksheet title

Sets the worksheet name in the Excel workbook.

Generate overflow sheets

This indicates where the overflow rows of data break in the Excel worksheet. The default is 65,000 rows of data before an overflow sheet is generated. For more information, see Generating Overflow Sheets for an Excel 2000 Report.

Note: When you change formats from XLSX to EXL2K and ROWLIMIT exceeds 65,000, you will receive a message asking you if you want to proceed. If you decide to continue, ROWLIMIT will be set to 65,000. If you decide not to continue, the format will revert to XSLX, with no change to ROWLIMIT.

Define a range name for the data

Assigns a named range to a group of cells in Excel. There is a 256 character limit for named ranges. For more information, see Using Excel Named Ranges in WebFOCUS Applications.

Excel template
Use template

Select and choose the template file (Workbook Name).

Note: In order for your workbook to appear in the template name drop-down list, it must be in your WebFOCUS Reporting Server application directory.

Worksheet to populate

The number of the worksheet to populate in the workbook. For example, if you have 5 worksheets in your workbook and you designated the first worksheet for the WebFOCUS report, then you would enter 1.

For more information about Excel templates, see Using Excel Templates.


x
Reference: Report Options Format Tab for PowerPoint Reports

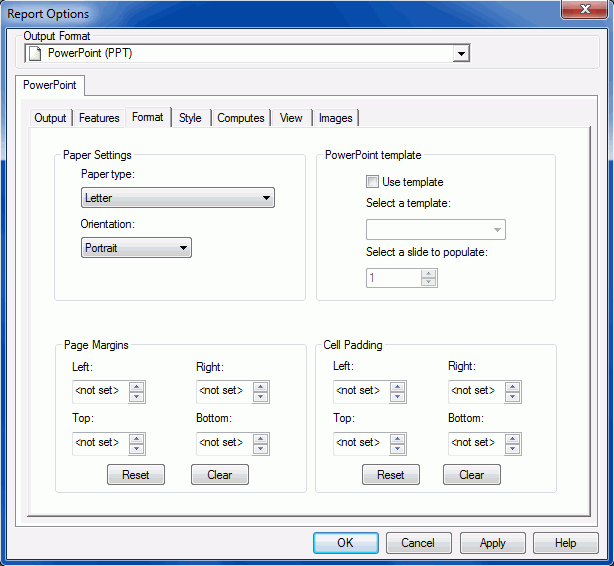
The following image shows the options that are available on the Format tab for PowerPoint® (PPT) reports.

Paper Settings
Paper type

Displays a list of paper types or media to choose from.

Orientation
  • Click Portrait to print a report on a page that is taller than it is wide (vertically).
  • Click Landscape to print on a page that is wider than it is tall (horizontally).
Page Margins

Shows values that indicate the top, left, bottom, and right margins of the report page. Use the Reset and Clear buttons to reset to default values or clear your input.

PowerPoint template
Use template

Select and choose the template file (PowerPoint Web Archive .MHT file name).

Note: In order for your .MHT file to appear in the template name drop-down list, it must be in your WebFOCUS Reporting Server application directory.

Tip: All .MHT files are shown in this directory so you may want to differentiate your Excel .MHT files from your PowerPoint .MHT files by using your own naming conventions. For example, Excel_template.MHT and PPT_template.MHT.

Select a slide to populate

The number of the slide to populate in the PowerPoint presentation. For example, if you have five slides in your presentation and you designated the first slide for the WebFOCUS report, then you would enter 1.

For more information about PowerPoint in Developer Studio, see Using PowerPoint Output Format and PowerPoint Templates.

Cell Padding

The amount of space between the gap values in the Cascading Style Sheet. Cell Padding displays values that indicate the top, left, bottom, and right margins. Values increment by 1/100 of an inch. Use the Reset and Clear buttons to reset to default values or clear your input.


x
Reference: Report Options Style Tab

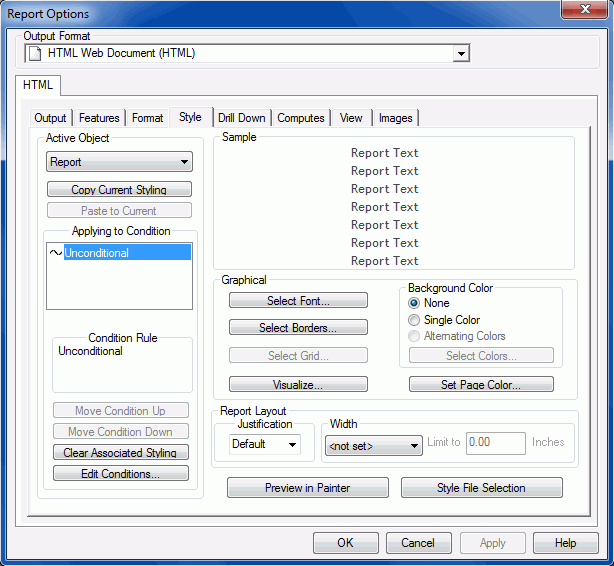
The Report Options Style tab is show in the following image.

active object

Choose one of the following object areas from the active object drop-down list: Report, Title, Data, Table Heading, Table Footing, Heading, Footing, Subhead, Subfoot, Subtotal, Across Column, Across Title, Column Totals, Row Totals (Report), Row Totals (Title), and Row Totals (Data).

You can apply conditions, colors, grids, borders, or conditions to an object area.

Copy Current Styling

Copies the current styling attributes from the object area selected in the active object drop-down list.

Paste to Current

Pastes the copied style to the object area selected in the active object drop-down list.

Applying to Condition

Displays existing conditions created with the Condition List and Edit Condition dialog boxes.

Condition Rule

Displays any condition rule(s) you created in the Edit Condition dialog box.

Move Condition Up/Move Condition Down

Rearranges the order of conditions applied in a column. Order is significant because conditions are applied in the order listed. For example, if the first and last conditions are both true, the style in the last condition will override the style in the first.

Clear Associated Styling

Clears associated styling for a column. Select a defined condition from the Applying to Condition dialog box in the Style tab and click this button.

Edit Conditions

Launches the Condition List dialog box. Click New to launch the Edit Condition dialog box, where you can create a new condition or edit an existing one. You can define conditions that control when to apply particular fonts, point size, text style, grids, color, and drill-down procedures.

Graphical
Select Font

Click the Select Font button to open the Font dialog box, where you can specify the font, font style, size, effects, and color for the selected object.

Select Borders

Opens the Borders dialog box, from which you can apply borders to the selected column.

Note: If grids are on, you cannot use the Borders feature.

Select Grid

Opens the Grid dialog box, from which you can apply a grid to the selected column. For PDF reports, you can specify a grid type (horizontal and vertical, horizontal, or vertical) and a Line style (none, light or heavy).

These options are not supported in HTML styled report formats.

The Select Grid button will be unavailable when the report includes one or more style sheet files that have border styling. To enable the button, you need to select a different style sheet.

Visualize

Click the Visualize button to open the Data Visualization dialog box, where you can insert data visualization bar graphs that correspond to the data in all numeric columns. Note that you cannot turn the data visualization feature on from the Report Options Style tab. It must be done from the Field Properties General tab or the right-click menu for a selected column. However, you can style the bar graphs from the Report Options Style tab. For details, see Data Visualization Dialog Box.

Background Color

You can apply a background color to the report or to an object area selected in the active object drop-down list.

Choose one of the following options:

None

No background color will be used.

Single Color

Click the Single Color option button and then the Select Colors button to open the Color dialog box. You can then select one background color.

Alternating Colors

Click the Alternating Colors option button and then the Select Colors button to open the Choose Background Colors dialog box. You can then assign alternating background colors to rows within columns.

Set Page Color

Allows you to select a color to apply to the entire report page.

Report Layout
Justification

Select a justification option for the selected column: Left, Right, Center, or Default to reinstate the default setting (left for alphanumeric columns and right for numeric columns).

Width

Choose one of the following options from the Width drop-down list:

<not set>

No width option is selected.

Maximum

Sets the width according to the length defined in the field format.

Minimum

Sets the width of the column according to the widest value or heading in the field. This is selected by default.
Truncate

Enables you to specify where to truncate the column width based on the specified units (inches or centimeters). To indicate that a field value has been truncated in the browser, WebFOCUS places an exclamation point (!) after every alphanumeric and text field value and an asterisk (*) after every numeric field value.

Wrap

Enables you to specify where to wrap data based on the specified units (inches or centimeters).

For related information, see Formatting a Column.

Limit to

Enables you to specify where to truncate or wrap data based on the specified units (inches or centimeters).

Note that the Limit to option is only activated when Truncate or Wrap is selected.

Preview in Painter

Enables you to preview a styling attribute in the Report Painter window (in addition to the Sample window in the Style tab).

Style File Selection

Opens the StyleSheet Selection dialog box, which enables you to reference or embed an external StyleSheet, use the default WebFOCUS StyleSheet, or apply no styling to your report. You may also save and include multiple StyleSheets. For more details, see StyleSheet Selection Dialog Box.


x
Reference: StyleSheet Selection Dialog Box

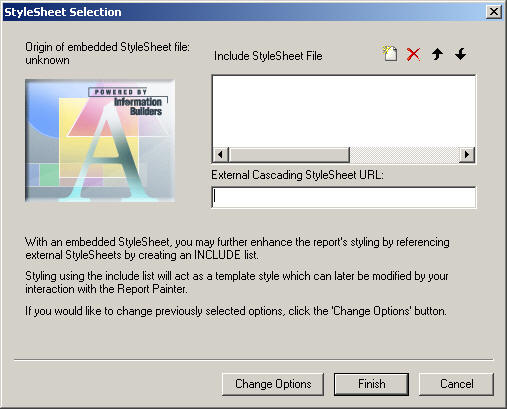
The Stylesheet Section dialog box allows you to customize your report using a stylesheet, as shown in the following image.

Note: The StyleSheet Selection dialog box opens to the Include StyleSheet File section, since every procedure has existing embedded styling by default. You may click Change Options and choose to embed or reference an external StyleSheet, use the WebFOCUS Default StyleSheet, or turn off all report styling. For more information about the StyleSheet File Selector, see Using the StyleSheet File Selector.

Include StyleSheet File

Provides options to include a StyleSheet, or multiple StyleSheets, to the report.

External Cascading StyleSheet URL

Enables you to type the name of a Cascading Style Sheet to be used in the report.

The external CSS (Cascading Style Sheet) file should be saved in an alias on the Web server. For more information, see How to Apply an External Cascading Style Sheet (CSS).


x
Reference: Report Options Drill Down Tab

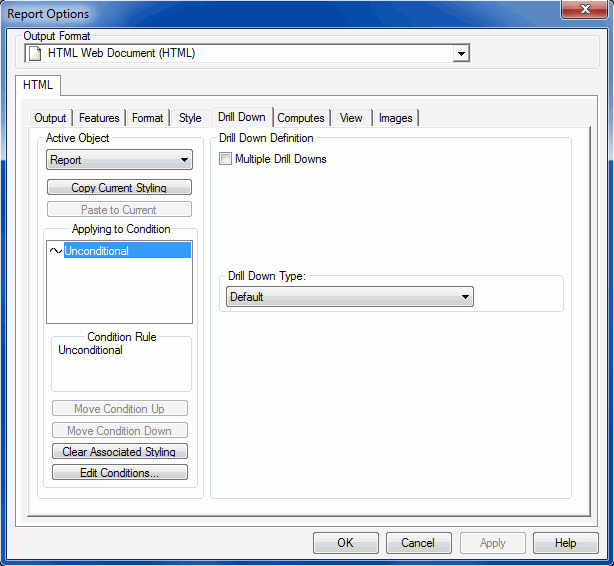
The following image shows the options that are available on the Drill Down tab for HTML reports.

active object

Choose one of the following object areas from the active object drop-down list: Report, Title, Data, Table Heading, Table Footing, Heading, Footing, Subhead, Subfoot, Subtotal, Across Column, Across Title, Column Totals, Row Totals (Report), Row Totals (Title), or Row Totals (Data).

You can apply conditions, colors, grids, borders, or conditions to an object area.

Copy Current Styling

Copies the current styling attributes from the object area selected in the active object drop-down list.

Paste to Current

Pastes the copied style to the object area selected in the active object drop-down list.

Applying to Condition

Displays existing conditions created with the Condition List and Edit Condition dialog boxes.

Condition Rule

Displays any condition rule(s) you created in the Edit Condition dialog box.

Move Condition Up/Move Condition Down

Rearranges the order of conditions applied in a column. Order is significant because conditions are applied in the order listed. For example, if the first and last conditions are both true, the style in the last condition will override the style in the first.

Clear Associated Styling

Clears associated styling for a column. Select a defined condition from the Applying to Condition dialog box in the Style tab and click this button.

Edit Conditions

Launches the Condition List dialog box. Click New to launch the Edit Condition dialog box, where you can create a new condition or edit an existing one. You can define conditions that control when to apply particular fonts, point size, text style, grids, color, and drill down procedures.

Drill Down Definition

Caution: Before you select a Drill Down Definition, specify the object to which the action will be applied (that is, column title and data, column data only, or column title only).

Multiple Drill Downs

This field is only enabled if an HTML styled report format is selected in the Report Options dialog box. The multiple drill down feature enables you to add detail to a report by creating hyperlinks that have multiple actions. For example, you can create hyperlinks that run a detail report or Maintain procedure, execute a JavaScript function, and link to a URL. When you click a component in the summary report, a pop-up menu appears, with the possible options to drill down to.

The multiple drill down feature applies to:

  • In the Report Options dialog box, the Select Format option must be HTML Web Document (HTML), HTML Table (HTMTABLE), HTML active report (AHTML), or User styled report format.
  • Data fields in the body of the report, not to headings, subheadings, footings, or subfootings.

Multiple Drill Downs must be checked for the Drill Menu Items box to be displayed.

Drill Menu Items

Displays the default drill down name, DrillDown1, when the Multiple Drill Downs check box is selected. You can double-click the default name and enter another name for the first drill down. The Drill Menu Items input box also features buttons that allow you to add, delete, or change the order of drill down names.

Drill Down Type

The Drill Down Type options will not display if Default or No action is selected from the drop-down list.

Default

Default is automatically selected for you. No action is taken and no other options are available in the Drill Down Type section when this option is selected.

No action

Click No action to specify that no drill-down link will be executed.

Execute Procedure

Click Execute Procedure and enter the name of a procedure to link to in the Procedure Name field, or click the Browse button and choose the detail procedure from the Open dialog box. Click Open to open the Procedure window for the detail report.

Execute Guided Procedure

Click Execute Guided Procedure and click Edit to open the Guided DrillDown window. Here you can select the Drilldown procedures you wish to use and any parameters you wish to pass to those procedures. This creates a parameter that allows the user to select the drill-down procedure at run time.

URL

Click URL and enter the address to link to in the URL field. Click Open to open the specified URL in a web browser.

This option is only available for HTML Web Document (HTML), HTML active report (AHTML), PDF, Excel (2000, 2000 Formula, 97) and User Styled report formats.

URL from field

Click URL from field and choose a field name from the drop-down list to indicate that the URL referenced is the value of that field.

For example, if the data source contains a field, such as E_MAIL whose values are the email addresses of every employee, select E_MAIL from the Field drop-down list as the URL, and supply the proper parameters. This action enables a user to click a last name in the web browser, which opens the email application with the email address of the individual selected.

This option is only available for HTML Web Document (HTML), HTML active report (AHTML), PDF, and User styled report formats.

JavaScript

Click JavaScript to execute a JavaScript function. Enter the name of the function in the JavaScript field.

This option is only available for HTML Web Document (HTML), HTML active report (AHTML), PDF, and User styled report formats.

Maintain Procedure

Provides a link to a Maintain procedure. Enter the name of the procedure in the Procedure Name field. For details, see Drilling Down to a Maintain Procedure.

Maintain Procedure Compiled

Provides a link to a compiled Maintain procedure. Enter the name of the procedure in the Procedure Name field. For details, see Drilling Down to a Maintain Procedure.

Maintain Case

Provides a link to a Maintain Case. Enter the name of the case in the Procedure Name field.

Note: A Maintain Case is also known as a Function.

Drill Through

Enables you to define hyperlinks between the individual report components within a single PDF formatted document.

Procedure Name

Enter the required value here, or choose one from the drop-down list.

Target Frame

Specifies that the results of the drill-down link display in a target frame on a webpage. Select from the following standard HTML frame names: _blank, _self, _parent, _top. You can select different frames for multiple drill downs.

Note: When specifying a target frame from Report Painter, manually added commands in the StyleSheet are not recognized. For example, manually entering TARGET=NEW is removed when the procedure is run in Report Painter. Report Painter removes commands that it does not generate itself. For this example, set the target to _BLANK to open a drill down report in a new window.

With Parameters

Displays the parameters defined for the selected procedure or URL in the Drill Down Definition field.

Add Button

Enables you to create parameters for the selected procedure or URL. Opens the Drill Down Parameter dialog box.

Edit Button

Enables you to edit the selected parameter.

Delete Button

Deletes the selected parameter.

For details, see Selecting Data.


x
Reference: Report Options Computes Tab

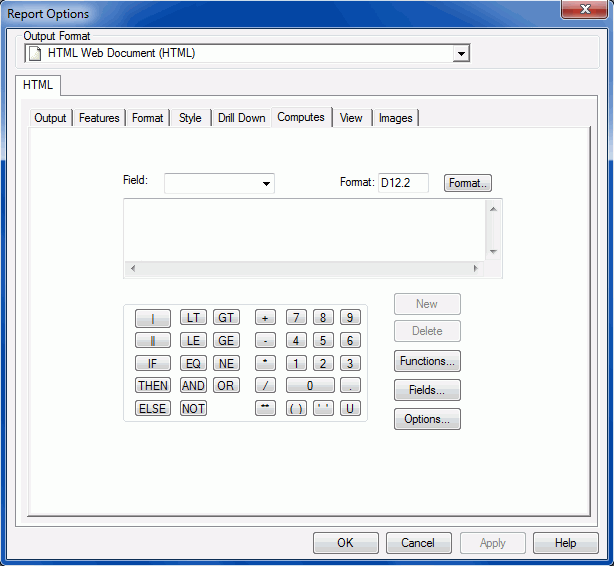
The Report Options Computes Tab is shown in the following image.

The Computes tab includes the following fields and options for creating expressions.

Field Box

Displays the name of the calculated value. Assign a field name to the value you wish to calculate.

When editing a calculated value, click the down arrow on the Field combo box, and select the field you wish to edit. When you select a field, the corresponding information appears in the Format box, and the expression box. You can edit the information, eliminate the field, or run it.

Format Box

Displays the field type, field length, and display options. The field type can be alphanumeric, numeric, or date/time.

Format Button

Opens the Format dialog box, where you can assign format information to the calculated value.

Expression Box

Displays the expression used to evaluate the field.

Type the expression, or use the Fields list, Calculator, and Functions list to help you create the expression.

Calculator

Provides numbers and operators that you can use to create numeric, alphanumeric, and conditional expressions. Click the desired number or operator to add it to the expression box.

  • To enclose a value in parentheses, click the ( ) key in the calculator. Parentheses affect the order in which the specified operations are performed.
  • To enclose a value in single quotation marks, click the ' ' key in the calculator. Use single quotation marks to enclose alphanumeric and date literals.
  • To convert entries in the expression box to uppercase, click the U key in the calculator. Note that field names are case-sensitive.
New Button

Clears the entry box, including the Field combo box and the corresponding expression. It also returns the format to the default value D12.2, and places the cursor in the Field combo box so you can begin to create a new field. The New button becomes available for use once a name for the expression is entered in the Field box. Once a name is entered and you click the New button, the previous expression is saved and can be retrieved by selecting that expression from the Field drop-down list.

Delete Button

Deletes the current expression and clears the tab.

Functions Button

Opens the Function Arguments dialog box, which lists all available built-in functions. A list of predefined functions are grouped into categories that include Character, Data Source and Decoding, Date and Time, Format Conversion, Numeric, and System. Each of the available functions is a program that returns a value. There is also a list of all available user defined functions. For more information on user defined functions, see Using User Defined Functions.

Double-click the desired function to add it to the expression box. Then, in the expression box, highlight each argument and substitute the value or field name you wish to use. For details, see the Using Functions manual.

Fields Button

Opens the Insert Field window. The Field tab lists all fields in the data source. The Column tab lists all fields being used in the report. If there are no fields being used, the Column tab will display all fields in the data source. Click Insert while a field is highlighted to insert that field into the expression.

Options Button

Opens the Options window, which enables you to establish how to interpret and represent missing values for the virtual field.

OK Button

Checks the syntax for your calculated value and displays a warning message. You cannot exit until the errors are fixed. When the syntax is correct and you click OK, the Computes tab closes. You can continue building your report.


x
Reference: Report Options View Tab

The Report Options View tab is shown in the following image.

General
  • Click Boundaries to show or hide the boundaries for report objects, such as headings and footings.
  • Click Test Data to display test data in a design mode.
  • Click Show Tool Tips for Fields to display tool tips.
  • Click Show Invisible Fields to display hidden fields (that is, fields that are unavailable in the Report Painter window).
Field List

Click one or more options to control the display of field information on the Computes tab:

  • Sort Field List alphabetizes the field names in the Fields window.
  • Show Qualified Fields lists the field names in the Fields window as qualified field names.
  • Show Field Name shows/hides the full field name in the Fields window, as provided in the Master File. This option is selected by default.
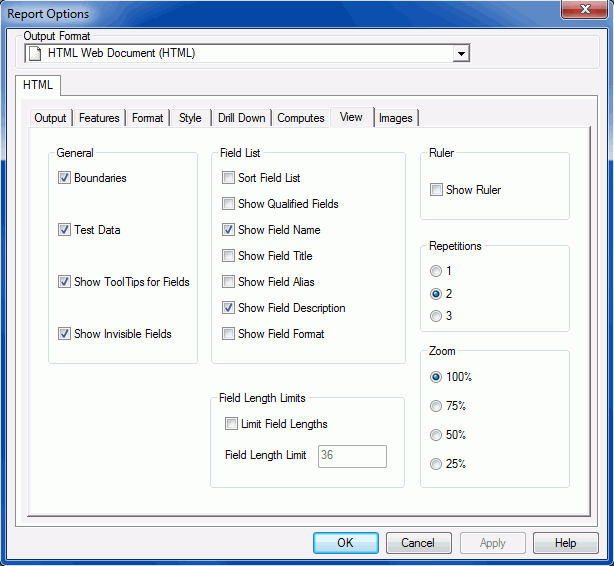
  • Show Field Title shows/hides the field column title in the Fields window, as provided in the Master File.
  • Show Field Alias shows/hides the alternate field name in the Fields window, as provided in the Master File.
  • Show Field Description shows/hides descriptive information about the field in the Fields window, as provided in the Master File.
  • Show Field Format shows/hides in the Fields window the field usage attributes, which include the field length and format.
Field Length Limits

This field is enabled when you check Limit Field Lengths. Enter a number that represents the maximum length of a field or maximum number of characters that can appear in the report.

Ruler

Click Ruler to show or hide a standard ruler at the top of the Report Painter window.

Repetitions

Click 1, 2, or 3 to specify the number of test data instances that appear for a field. The default value is 2.

Zoom

Specify the size (magnification/scale) of the Report Painter window: 100%, 75%, 50%, or 25%. The default value is 100%.


x
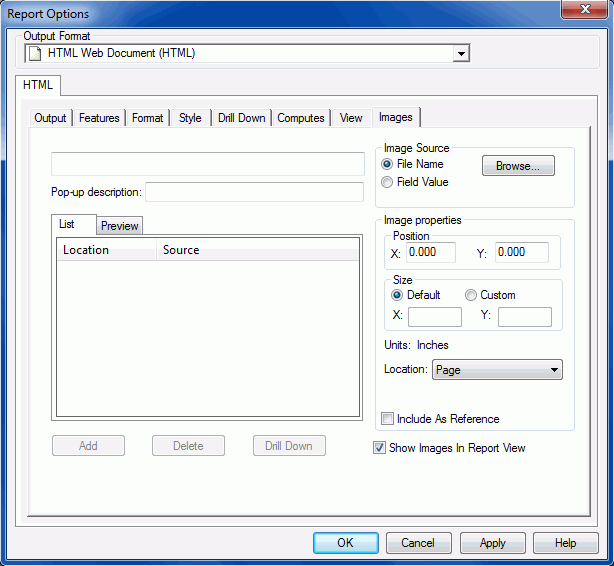
Reference: Report Options Images Tab

The Report Options Images tab is shown in the following image.

Entry Field

Enter the image file being added to the report, including its path, or select a file or field from the Image Source field. Your selection is reflected in the Entry field.

Pop-up description

Enables you to provide alternative information about the image in the output, when the mouse is hovered over the image. For more information, see How to Create a Pop-Up Description for an Image.

List Box

Displays a list of the images or fields you have added to the report.

Add Button

Adds the graphic image displayed in the entry field to the list box window.

Delete Button

Deletes the image from the report or the selected object.

Click the image name or field name in the list box and click the Delete button.

Drill Down Button

Opens the drill-down dialog box where you can set up drill-down options for the image. This option is only available for the HTML Web Document (HTML) styled report format.

Image Source

Identifies the source of the graphic image:

Select File Name to enter the path and exact file name of the image in the entry field, or click the Browse button to select an image.

Select Field Value to enter the report field that points to the images, where the value of each record corresponds to a graphic image file name that you have placed on the path or you have inserted in the field data source.

Select Graph to insert a graph. You must have a graph request with the output set to file (HOLD) before creating the report. The report automatically detects the graph request in the procedure and activates the Graph button on the Report Options Images tab.

Image properties
Position

Specifies the starting position of the image in relation to the report object in which the image is embedded (for example, Subheading). Specify the X and Y coordinates.

Note: To use these features in HTML styled report formats, ensure that the Cascading Style Sheets option is selected on the Report Options Features tab.

Size

Scales the image to a desired width and height. The default behavior is to render the image at its original size.

Select the Custom option button and specify the height and width in the X and Y boxes.

Note: To use these features in HTML styled report formats, ensure that the Cascading Style Sheets option is selected on the Report Options Features tab.

Units: Inches

Displays the unit of measurement (inches or centimeters).

Location

Select one of the locations from the Location drop-down list: Page or Background.

If you add a subfooting, subheading, subtotal, report heading, or report footing to your report, these object areas are also listed to enable you to attach an image to these locations.

Include As Reference

Includes the image as a reference instead of embedded. This option is only available for the HTML Web Document (HTML), HTML Table (HTMTABLE), PDF, PS, Default, and User styled report formats.

Show Images In Report View

Shows or hides the image in the Report Painter window.


WebFOCUS