Sorting enables you to group or organize report information
vertically and horizontally, in rows and columns, and specify a
display sequence.
The sort field organizes the rows and columns and controls the
sequence of data items in the report. Any field in the data source
can be the sort field. If you wish, you can select several sort
fields, nesting one within another. Sort fields appear when their
values change.
You sort a report using By and Across options:
-
By. Displays
the sort field values vertically, creating rows. Report Painter
displays vertical sort fields in the left-most columns of the report.
-
Across. Displays
the sort field values horizontally, creating columns. Report Painter
displays horizontal sort fields across the top of the report.
-
By
and
Across. Used
in the same report create rows and columns, producing a grid or
matrix.
x
You can sort report information vertically using the
By option. As Report Painter displays sort field values vertically,
it creates rows.
You can include up to 32 vertical (By) sort phrases in a request
(31 if you combine vertical sorting with the Detail display option).
If you are sorting vertically, you can:
- Control the
replacement of vertical sort fields. For details, see How to Control the Placement of a Vertical Sort Field on a Report.
- Choose the
number of sort records to display. For details, see How to Display a Specific Number of Sort Values.
- Add underlines,
blank lines, and page breaks at sort breaks. For details, see How to Add an Underline, Blank Line, or Page Break at a Vertical Sort Break.
- Reset the page
number after a sort break. For details, see How to Add an Underline, Blank Line, or Page Break at a Vertical Sort Break.
- Group numeric
data into ranges. For details, see How to Group Numeric Data Within a Range.
- Rank data numerically.
For details, see How to Rank Data Numerically.
- Sort and aggregate
a report column. For details, see How to Aggregate and Sort Report Columns.
- Add a dynamic
table of contents to an HTML report in order to quickly navigate
and analyze multiple levels of sorted data. For details, see Navigating Sort Groups From a Table of Contents.
For related information, see Additional Sorting Options.
x
Procedure: How to Sort Rows
-
Click
the By button on the Columns toolbar to sort
vertically (creating rows).
-
From
the Fields tab in the Object Inspector, double-click the field you wish
to use for sorting, or drag the sort field from the Fields tab to
the Report Painter window. The sort field appears in the left column
of the Report Painter window.
Example: Sorting Vertically
The following report displays all employee IDs (EMP_ID)
sorted vertically by DEPARTMENT.
Notice that the sort field DEPARTMENT automatically
appears as the left column in the report. The sort field values
(MIS and PRODUCTION) appear when the sort field changes.
x
Procedure: How to Control the Placement of a Vertical Sort Field on a Report
Ordinarily, vertical sort fields appear in the left hand
column of a report. To control the placement of sort fields in a
report, choose one of the following options from the Report Options
Output tab.
-
Default field placement
-
Prevents or restricts the relocation of
sort fields.
-
Custom field placement
-
Enables you to move sort fields.
-
Reset
-
Click to restore the default placement
of fields.
x
Procedure: How to Display a Specific Number of Sort Values
You
can choose the number of records to display in your report. For
example, you can display the top five salaries in a report that
sorts by current salary.
-
Right-click
a vertical sort (By) field and click Options from
the context menu, then select the Sort tab
from the Field Properties dialog box.
-
In the
Sort Limit field, type the number of sort values to display, select one
of the predefined values, or click Variable to
be prompted for a value at run time.
Note: The Sort Limit option only applies
to a vertical sort (By) field. If you select HIGHEST from
the Sort Order drop-down list, you see the chosen number of highest
values. If you select LOWEST from the Sort
Order drop-down list, you see the chosen number of lowest values.
x
Procedure: How to Add an Underline, Blank Line, or Page Break at a Vertical Sort Break
You can use formatting options to enhance the readability
and usefulness of a report. These options apply only to a vertical
sort (By) field. To add underlines, skipped lines, or page-breaks
at each sort break:
-
Right-click
a sort (By) field and click Options from
the context menu, then click the Sort tab
from the Field Properties dialog box.
-
From
the Actions tab, choose a formatting options:
-
Underline
-
Include a horizontal line across the
width of a report after the value of the selected sort field changes.
To apply this action in HTML styled report formats, ensure that
the Cascading Style Sheets option is selected on the Report Options Features
tab.
-
Skip Line
-
Skip a line on a report when the value
of the selected sort field changes. To apply this action in HTML
styled report formats, ensure that the Cascading Style Sheets option
is selected on the Report Options Features tab.
-
No Split
-
Break sort fields logically and regenerate
the field heading on the next page or screen.
-
Fold Line
-
Causes columns to be placed on a separate
line when the value of the sort field changes. This feature is not
supported for HTML styled report formats.
-
Page Break
-
Start a new report page when the value
of a selected sort field changes.
-
Restart Page Numbering
-
Resets the page number to one at the
sort break. The Page-break option must be selected.
x
Procedure: How to Group Numeric Data Within a Range
This option only applies to a numeric By field.
You can group sort field values together
and define the range of each group.
For example,
in a report that lists employees by salary, instead of showing each individual
salary, you can group employees by salary increments of $5000. The
list of salaries appears as $5000, $10,000, $15,000, and so on.
-
Right-click
a numeric sort (By) field and click Options from
the context menu, then click the Sort tab
from the Field Properties dialog box.
-
From
the Grouping subtab, select IN-GROUPS-OF from
the Grouping drop-down list.
-
Type
the sort field increment in the Range or Number of Tiles drop-down list
or click Variable to be prompted for a value
at run time.
-
Select On from
the Limit drop-down list and enter the grouping limit in the Highest
Value drop-down list.
Note: Highest
Value is an optional number that defines the highest range label
to be included in the report. The range is extended to include all data
values higher than this value.
-
Click OK.
In the image
below, the report lists employees by salary in groups of $5,000 intervals.
The
image below is the same report showing groups in $5,000 intervals
and a group limit of $15,000.
x
Procedure: How to Group Numeric Data Into Ranges
This option only applies to a numeric By field.
When you sort a report
using a numeric sort field, you can group the sort field values together
and define groups of equal range using the In-Ranges-Of option.
For example, in a report that lists employees by salary,
instead of showing each individual salary, you can group employees
by salary in ranges of $5000. The list of salaries appears as $5000–$9999.99,
$10,000–14,999.99, $15,000–$19,999.99, and so on.
-
Right-click
a numeric sort (BY) field and click Options from
the context menu, then click the Sort tab
from the Field Properties dialog box.
-
From
the Grouping subtab, select the IN-RANGES-OF from
the Grouping drop-down list.
-
Type
the sort field increment in the Range or Number of Tiles drop-down list
or select Variable to be prompted for a value
at run time.
-
Click On from
the Limit drop-down list and enter the grouping limit in the Highest
Value drop-down list.
Note: Highest
Value is an optional number that defines the highest range label
to be included in the report. The range is extended to include all data
values higher than this value.
-
Click OK.
In the image below, the report lists employees by salary
in ranges of $5,000 intervals.
The image below is the same report
showing ranges in $5,000 intervals and a group limit of $15,000.
x
Procedure: How to Group Numeric Data Into Tiles
This option only applies to a numeric By field.
You can group
numeric data into any number of tiles (percentiles, deciles, and
so on) in tabular reports. For example, you can group salary into
deciles to determine which employees are earning the top salaries
in each department.
Grouping is based on the
values in the selected vertical (BY) field, and data is apportioned
as equally as possible into the number of tile groups you specify.
-
Right-click
a numeric sort (By) field and click Options from
the context menu, then click the Sort tab
from the Field Properties dialog box.
-
From
the Grouping subtab, select the IN-GROUPS-OF from
the Grouping drop-down list.
-
Enter
the range (or number of tiles) in the Range or Number of Tiles drop-down
list or select Variable to be prompted for
a value at run time.
Note: Range or
Number of Tiles is the number of tiles that is used to group the
report.
-
Click On from
the Tiles drop-down list and enter a title for the Tile in the
Title box.
If you do not enter a Title, a new column
labeled TILE by default, is added to the report and shows the tile
number assigned to each instance of the tile field.
-
Click OK.
The following image is an example
of a report showing salaries grouped into five tiles. Note that
the tiles are assigned within the higher-level sort field DEPARTMENT.
The MIS category not have any data assigned to tile 3. The PRODUCTION
category has all five tiles. For more information about how tiles
are grouped, see Grouping Numeric Data Into Tiles in
the Sorting Tabular Reports chapter of the Creating
Reports With WebFOCUS Language manual.
x
Procedure: How to Rank Data Numerically
When you sort reports
vertically, you can indicate the numeric rank of each row.
-
Right-click
a By field and click Options from the context
menu, then click the Sort tab from the Field Properties
dialog box.
-
From the
Sorting subtab, in the Sort Order drop-down list, click LOWEST (for
ascending order), HIGHEST (for descending
order), or Variable to be prompted for a
value at run time.
-
To limit
the number of ranked fields, in the Sort Limit field, type the number
of sort values to display, select one of the predefined values,
or click Variable to be prompted for a value
at run time.
-
From
the Ranking subtab, click On from the Rank
drop-down list.
-
Click OK.
A numerical ranking appears on each line of the report with
the default column heading, RANK.
x
Procedure: How to Aggregate and Sort Report Columns
You can apply aggregation and sorting simultaneously to
numeric columns in your report in one pass of the data. You can
also sort based on calculated values.
You apply column-based sorting to a
report one column at a time by adding the BY TOTAL phrase. For BY
TOTAL to work correctly, you must have an aggregating display command,
such as SUM. The records can be sorted in either ascending or descending sequence.
For more information about adding BY TOTAL to report columns, see Sorting
and Aggregating Report Columns in the Sorting Tabular Reports chapter of the Creating
Reports With WebFOCUS Language manual.
-
Right-click
on a numeric column and click Options from
the context menu, then click the Sort tab
from the Field Properties dialog box.
-
From
the Sorting subtab, select the sort order as either LOWEST or HIGHEST.
Note: You can
click Variable to be prompted for a value
at run time.
-
Click On from
the Total drop-down list to add the BY TOTAL phrase to the numeric
column.
-
Optionally,
you may also limit the number of results shown in the report output
by entering a value in the Sort Limit field box.
-
Click the General tab
of the Field Properties dialog box and select an aggregating display
command from the Prefix drop-down list. For example, SUM or AVE.
Note: For BY TOTAL to work correctly, you must have an aggregating
display command. A non-aggregating display command, such as PRINT, simply
retrieves the data without aggregating it.
-
Click OK.
The following image is an example
of a report showing the total highest salary by department and names.
Example: Ranking Data Numerically by a Total Field
Suppose that you want to see total sales for different
regions within your enterprise. The following example shows how
to create a report that ranks regions, by highest dollar sales,
for all Gotham Grinds stores:
- Open the GGSALES
data source in Report Painter.
- Double-click
or drag DOLLARS, REGION,
and DOLLARS again from the Fields tab of
the Object Inspector.
- Select the
first instance of Dollar Sales and Region and
click the By button on the Report Painter
toolbar.
The first instance of Dollar Sales and Region become
By sort fields.
- Select the second
instance of Dollar Sales and click the Sum button
on the Report Painter toolbar.
The second instance of Dollar
Sales becomes a Sum field.
Tip: To show dollar signs for the Dollar Sales Sum field:
- Right-click
the Dollar Sales Sum column.
- Click Format.
- Select Floating
dollar -- M from the Edit Options list.
- Click OK.
- To sort the
report BY TOTAL Dollars, right-click on the Dollar Sales By
field and select Options.
The Field Properties
dialog box opens at the Style tab.
- Click the Sort tab
and select On from the Total drop-down list.
This
adds BY TOTAL to the syntax.
- Select HIGHEST from
the Sort Order drop-down list.
- Click the Ranking subtab
and select the On from the Rank drop-down
list.
- Click OK to
close the Field Properties dialog box.
The Dollar Sales By field
appears by Rank.
- Right-click
the Dollar Sales By field again and select Invisible and
then On from the context menu.
- Run the report.
The Dollar Sales value for the Regions field is ranked by Total,
as shown in the following image.
x
You can sort report information horizontally using the
Across option. As Report Painter displays sort field values horizontally,
it creates columns.
You can have up to five horizontal sort fields per report request.
Each one can retrieve up to 95 sort field values. Your report can
include up to 256 columns. The total number of Across columns in
a report is equal to the total number of across sort field values
multiplied by the total number of display fields.
x
Procedure: How to Sort Columns
-
Click
the Across button on the Columns toolbar
to sort horizontally (creating columns).
-
From
the Fields tab in the Object Inspector, double-click the field you wish
to use for sorting, or drag the sort field from the Fields tab to
the Report Painter window.
Example: Sorting Horizontally
This report totals the salary outlay (CURR_SAL) of
the department and sorts horizontally by DEPARTMENT.
DEPARTMENT
| |
MIS $108,002.00
|
PRODUCTION $114,282.00
|
Note that the sort field DEPARTMENT
appears as a label at the top of the report and the sort field values
appear as column titles.
xUsing the Sort Sequence Builder
The Sort Sequence Builder allows you to customize the
sorting order of data within a field.
To access the Sort Sequence Builder, right-click on a BY or ACROSS
field and click the Sort Sequence button.
Alternatively, you can click the Sort Sequence button
found in Sorting section of the Field Properties Sorting tab.
The Sort Sequence Builder is shown in the following image.
You can enter your own values, on the left side, in the Sort
Sequence list using the New button. Titles
are optional.
You can also get values using the Get Data button.
The Get Data button will retrieve data values
for the selected field and display them in the right side. These
field values can be dragged or double-clicked to add a new value
to the Sort Sequence list on the left side.
The toolbar above the Sort Sequence list can be used to manipulate
the values. The toolbar buttons are: Undo, Redo, New, Delete, Move
Up, and Move Down.
Note: If you have applied a sort sequence and then try
to change the type of another field to FOR, you will receive the
following message.
Each report request may contain only one FOR or BY ROWS OVER phrase.
If you wish to continue, all sort sequence values will be removed from: <field name>

Continue?
If you continue, the sort sequence values are removed from the
field to which they are applied. The field you originally selected
is changed to a FOR field.
Alternatively, if you try to apply a sort sequence to a field
while there is already a FOR field present, you will receive the
following message.
Each report request may contain only one FOR or BY ROWS OVER phrase.
If you wish to continue, the current FOR field <field name> will be converted to a SUM field, and all FML attributes will be lost.

Continue?
If you continue, the FOR field will be changed to a Sum field
and the Sort Sequence Builder dialog box will open. You can then
create a sort sequence for the selected field.
xSorting Using Multiple Fields
You can organize information in a report using more
than one sort field. When several sort fields are used, the sequence
of the sort fields determines the sorting order: the first By or
Across field sets the major sort break, the second By or Across
field sets the second sort break, and so on. Each successive sort
is nested within the previous one.
x
Procedure: How to Sort Using Multiple Fields
-
Click
the By or Across button
on the Columns toolbar to sort vertically or horizontally.
-
From
the Fields tab in the Object Inspector, double-click the field you wish
to use for sorting, or drag the sort field from the Fields tab to
the Report Painter window.
-
Repeat
steps 1 and 2. The field you select will be used as a sort field, along
with any previous (higher level) sort fields.
-
Repeat
as many time as necessary. (See Sorting Rows and How to Navigate Sorted Data From a Multi-Level Report TOC for limitations.)
Example: Sorting With Multiple Fields
To sort with multiple By fields, you can select several
vertical sort fields, nesting one within another, as with DEPARTMENT
and LAST_NAME in this example. The output is:
To
sort using multiple Across fields, the following report sorts the
sum of current salary (CURR_SAL) horizontally, first by department
(DEPARTMENT), then by job code (CURR_JOBCODE).
xSorting Rows and Columns to Create a Matrix
You can create a simple matrix report by sorting both
rows and columns. When you include both vertical (By) and horizontal
(Across) sort fields in a report request, information is sorted
down the report and across the report, turning it into a matrix
of information that you read like a grid. A matrix report can have
several By and Across sort fields.
x
Procedure: How to Create a Matrix
-
Click
the By button on the Columns toolbar and
select one or more vertical sort fields.
-
Click
the Across button on the Columns toolbar and
select one or more horizontal sort fields.
-
Click
the Detail or Sum button
on the Columns toolbar and select one or more fields to add to the
report.
Tip: You can also create a matrix using
the Sort Groups tab in the Object Inspector. See Sorting in Groups to Create a Combined Detail/Summary Report for more information.
Example: Creating a Simple Matrix
The following report displays total salary outlay sorted
across departments and by job codes.
xAdditional Sorting Options
The following options give you additional control over
the organization of data in your reports. You can:
- Sort in ascending
or descending order.
- Group sort
fields logically on a page.
- Rank sort fields
by highest or lowest values.
- Limit the number
of ranked values.
- Add subheading
and subfootings at sort breaks.
- Add subtotals
at sort breaks.
- Set conditions
for the display of sort-based subheading, subfootings, and page breaks.
- Prevent unnecessary
resorting of data.
- Wrap a horizontal
Across column in a PDF report.
x
Procedure: How to Arrange Field Values in Ascending/Descending Sort Order
You
can change the sort order from ascending to descending, or vice
versa, for alphanumeric (A to Z; Z to A) and numeric (1-10; 10-1)
fields.
- Right-click
the field and click Options from the context
menu, then click the Sort tab from the Field
Properties dialog box. Select HIGHEST from
the Sort Order drop-down list to sort values from highest to lowest
(descending order).
- Right-click
the field and click Options from the context menu,
then click the Sort tab from the Field Properties
dialog box. Click LOWEST from the Sort Order
drop-down list to sort values from lowest to highest (ascending
order).
x
Procedure: How to Keep Logically Grouped Sort Fields Together After a Page Break
You can break sort fields logically and regenerate the
field heading on the next page or screen.
-
Right-click
the field and click Options from the context
menu, then click the Sort tab from the Field Properties
dialog box.
-
From
the Actions tab, click On from the No Split drop-down
list.
Note: Only one
No Split option is allowed per report.
x
Procedure: How to Add a Subheading or Subfooting at a Sort Break
-
Select
the sort field from the Report Painter window.
-
Do one
of the following:
- Click the SubHeading
(or SubFooting) button on the Headings and Footings
toolbar.
- Choose Subheading
(or Subfooting) from the Insert menu.
A Subheading (or Subfooting) object area is added
to the Report Painter window.
-
Place
the cursor in the object area to add text.
Tip: To view the
boundaries for all object areas, click the Options button
on the Output Format toolbar. Select the View tab
and click the Boundaries check box.
-
Optionally,
you can right-click and click Options to
style, drill down, add images, and so on.
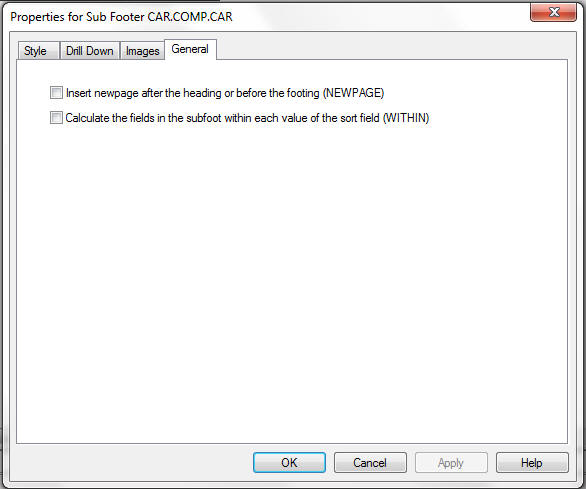
You can click the General tab,
as shown in the following image, to create a new page (NEWPAGE)
for each subfoot. WITHIN will create a subfoot within a specified
sort break. WITHIN is only available for subfoot.
For related information, see How to Display a Conditional Subheading, Subfooting, or Page Break.
x
Procedure: How to Display a Conditional Subheading, Subfooting, or Page Break
You can control when subheadings, subfootings, and page-breaks
appear based on conditions you supply. The condition must be satisfied
in order for the subheading, subfooting, or page break to be displayed.
You accomplish this using the When option.
-
Place
the cursor in the object area (that is, subheading, subfooting,
or page break) in the Report Painter window.
-
Click When from
the Properties menu or the context menu for the selected object.
The When dialog box opens.
-
You
can use this dialog box to create an expression that determines when
the subheading, subfooting or page-break should be displayed. You
can also click the Assist button to open
the Expression Builder, which is designed to help you create an
expression.
For details on the Expression Builder, see Using the Basic Expression Builder.
Example: Embedding a Value in a Subheading or Subfooting
To specify the department name in a subheading field:
- Open the EMPLOYEE
data source in Report Painter.
- Use the Fields
list to create a Subheading sort field.
- Type the following
in the Subheading object area:
DEPARTMENT IS
- Place the cursor
where you want the field value to be inserted.
- Double-click
the field DEPARTMENT from the Fields window. The subheading field then
shows the following:
DEPARTMENT IS <EMPLOYEE.EMPINFO.DEPARTMENT
When the report appears, the
department name for each department appears in the subheading as
follows:
DEPARTMENT IS MIS
DEPARTMENT IS PRODUCTION
x
Procedure: How to Prevent Report Painter From Sorting Data
If the data you are accessing for your report is already
in the correct sort order, you can prevent Report Painter from resorting
it by clicking the Options button on the
Output Format toolbar. The Report Options dialog box opens. From
the Output tab, click Sorted Data in the
Data area.
This feature provides
a very fast method of retrieving data if it is already stored in
the order required for display, and no further sorting is required.
x
Procedure: How to Wrap an Across Column in a PDF Report
Selecting the wrap option for an Across column
automatically wraps the data to fit the width of the value underneath
it in the PDF report.
-
In Report
Painter, create a PDF report with several sort fields. Select the
field to be sorted horizontally and click Across from the
Columns toolbar.
The field is sorted horizontally, creating
columns.
-
With the
Across field still selected, right-click and click Options from
the context menu.
The Field Properties dialog box opens at
the Style tab.
-
Click Column
Data from the active object drop-down list.
-
Click Wrap from
the Column Layout Width drop-down list.
Note: The Limit
to option is grayed out, as the specified measurement units for
Across data is not applicable. Selecting Wrap automatically wraps
the data to fit the width of the value underneath it.
-
Click Apply and
then OK to close the Field Properties dialog
box.
-
Run the
report.
Wrap is enabled for the horizontal Across column in the
PDF report.
xSorting in Groups to Create a Combined Detail/Summary Report
You
can produce complex reports that sort information in groups to display
both summary and detailed information in the same report. These
reports (sometimes called multi-verb requests) contain more than
one display option (Sum, Detail). They also group fields within the
request in order to be able to manipulate the fields in each group
separately. For example, you can produce one report that lists the
total salary for all departments in a company, the total salary
for each department, and the last names and individual salaries of
the employees within each department.
You can implement group sorting in the Object Inspector Sort
Groups tab. All actions you perform in the Sort Groups tab immediately
affect the fields in the Report Painter window.
In creating a request that produces a combined detail/summary
report, a meaningful relationship must exist among the separate
sort condition sets. Report Painter automatically enforces the following
rules:
- Up to sixteen
Sum and Detail columns and their associated sort conditions can
be used in a request.
- The first Sort
Group in a report can contain a Sum column alone or a By column preceding
a Sum column. For other Sort Groups, a By column must precede a
Sum column.
- Detail data
in the report may appear only in the last column.
- WHERE and IF
criteria apply to the records selected for the report as a whole.
x
Procedure: How to Create and Manipulate Sort Groups
-
Drag
the fields you want to include in your report from the Fields tab
in the Object Inspector to the Report Painter window. Include multiple instances
of fields you want to sum at various levels.
-
The
fields are added as Detail columns by default. Click the Sort
Groups tab and notice that all the fields are in Sort
Group 1.
-
Select
each column you want to sort by and click the By button.
Then click each column you want to sum and click the Sum button.
Alternatively, you can right-click each
field in the Sort Group panel and click Change to By or Change
to Sum. These changes are immediately reflected in the
Report Painter window.
-
You
are now ready to break out your sort groups.
Note: The first
Sort Group can contain a Sum column alone or a By column followed
by a Sum column. All other Sort Groups must have one or more By
columns followed by a Sum column.
-
To form your first sort group:
Drag
a Sum column and drop it directly onto the Sort Group 1 folder.
The dragged column becomes the first column in the group and in
the Report Painter window.
or
Drag a Sum column and drop it onto a By column.
The Sort Groups tab is refreshed to display
the first Sort Group as you specified. Other fields are now listed
in Sort Group 2.
-
To form another sort group, drag a Sum column onto a By
column.
Once again, the Sort Group pane is refreshed. The Sum
column follows the associated By column in the Report Painter window
and the remaining fields are collected in the next Sort Group.
Repeat this process for each group you wish
to create.
-
If your
report contains a Detail field, it will be moved to the last column in
the report, and designated as its own sort group.
Example: Creating a Detail/Summary Report
Suppose that you want to see
total sales at different levels within your enterprise. The following
example shows how to create a report of total sales for all Gotham
Grinds stores by state, total sales for each Gotham Grinds store,
and sales for each product category.
- Open the GGSALES
data source in Report Painter.
- Double-click
or drag ST, STCD, CATEGORY, DOLLARS, DOLLARS,
and DOLLARS from the Fields tab of the Object
Inspector. The first instance of DOLLARS will show total sales for
each state. The second instance will show total sales for each store.
The third instance will show detailed sales for each product category.
- Select the
first instance of the Dollar Sales column in the Report Painter
window and click the Sum button in the toolbar.
The other two instances of Dollar Sales automatically become summary
columns.
- Select the State column
in the Report Painter window and click the By button
in the toolbar. Repeat this step for the Store ID and Category columns.
- Click the Sort
Groups tab in the Object Inspector. All the report columns
are in Sort Group 1.
- To form your
first sort group, drag the first instance of DOLLARS and
drop onto ST.
The Sort Group pane is refreshed.
The remaining fields are now listed in Sort Group 2.
- To form your
second sort group, drag the second instance of DOLLARS and
drop onto STCD.
The Sort Group pane is
refreshed. The remaining fields are now listed in Sort Group 3.
- Select the
third Dollar Sales column in the Report Painter window and click
the Detail button.
Tip: To
show dollar signs for the Dollar Sales fields:
- Right-click
the Dollar Sales column.
- Click Format.
- Select Floating
dollar -- M from the Edit Options list.
- Click OK (repeat
for all Dollar Sales columns).
- Create a Where
clause to narrow down the report output results. Click the Where button
from the Where/If drop-down menu.
- Double-click DOLLARS to
move the field to the Column to filter field.
- Click is
greater than or equal to from the Logical Relation drop-down
list.
- Click Value from
the Compare Type drop-down list.
- Double-click
in the Compare Value field to Edit a Single Value,
and enter 25,000 for this example. Click OK.
For more details about using the Expression Builder, see Using the Basic Expression Builder.
- Run the report
by clicking the Run button on the toolbar.
The
report appears in the browser.
xControlling the Display of Sorted Data With Accordion Reports
Accordion Reports provide a way to control the amount
of sorted data that appears on an HTML report page. You can produce
reports with expandable views of data for each vertical sort field.
When an Accordion Report first appears, only data values of the first
(highest-level) vertical sort field are shown. All other data is
hidden. You can manually expand your view to expose data values
of lower-level sort fields.
When you create an Accordion Report, a plus sign (+) appears
to the left of each data value in the column under the highest-level
sort heading. For data associated with lower-level sort fields,
a plus sign (+) is placed to the left of each data value, but the
data does not appear unless manually expanded. Data values of the
lowest-level sort field are not expandable.
To expand your view of data for any expandable sort field, click
a plus sign (+) and all data associated with the next lower-level
sort field appears. When you expand a data value under the next
to lowest sort heading, all of the remaining associated data values
in the report appear.
Two vertical (BY) sort fields are required. If your report does
not contain two vertical sort fields, then the Accordion Reports
option is ignored and a standard HTML report is created.
The use of horizontal (ACROSS) sort fields is supported with
Accordion Reports. The horizontal sort headings that appear above
vertical sort headings in a standard HTML report are not displayed
in an Accordion Report until at least one sorted data value has
been manually expanded in each expandable sort column.
PDF and Excel formats are not supported with Accordion Reports.
x
Reference: Requirements for Accordion Reports
The following requirements must be taken into consideration
when creating Accordion Reports:
- Adding a drill-down
link to an Accordion Report requires that the TARGET parameter must
be set to a value that specifies a new HTML frame.
- Once an Accordion
Report is created and delivered to the user, there are no subsequent
calls to the WebFOCUS Reporting Server required when the user is interacting
with the report. However, the collapsible folder controls on the
sort fields require JavaScript and images that reside on the WebFOCUS
Client. The user must be connected to the WebFOCUS Web tier components
in order to use this feature. For online connected users of WebFOCUS,
no change is required to the report.
However, for distribution
of reports using ReportCaster, see the following Reference topic
to ensure that the report is delivered correctly as an email attachment or
as an archived report in the Report Library.
x
Reference: Distributing Accordion Reports With ReportCaster
Distributing Accordion Reports with ReportCaster requires
the use of JavaScript components and images located on the WebFOCUS
Client. To access the JavaScript components and images from a report
distributed by ReportCaster, the scheduled procedure must contain
the SET FOCHTMLURL command, which must be set to an absolute URL instead
of the default value. For example,
SET FOCHTMLURL = http://hostname:port/ibi_html
where:
-
hostname:port
-
Is the host name and optional port number
(specified only if you are not using the default port number) where
the WebFOCUS web application is deployed.
- ibi_html
-
Is the site-customized web server alias
pointing to the WebFOCUS/ibi_html directory (where ibi_html is the
default value).
For more information about coding reports for use with
ReportCaster, see the Tips and Techniques for Coding a ReportCaster
Report section in your ReportCaster manual.
x
Reference: Support for Accordion Reports
The following commands are not supported when using Accordion
Reports:
BORDER, COLUMN, FOR, IN, OVER, PAGE-NUM, ROW-TOTAL, TOTAL
Data Visualization, OLAP, On Demand Paging, and the ReportCaster
burst feature are also not supported with Accordion Reports.
x
Procedure: How to Create an Accordion Report
-
Create
a report in Report Painter using the GGSALES Master File.
-
In the
Report Painter main window, add the following fields:
UNITS, ST,
DOLLARS, CITY, REGION, CATEGORY
-
Highlight
the UNITS and DOLLARS fields and click Sum.
-
Highlight
the ST, CITY, and CATEGORY fields and click By.
-
From
the Report menu, click Features. The Report
Options dialog box opens.
Note: Accordion
Reports are available for HTML Web Document (HTML), HTML Table (HTMTABLE),
Default, and User styled report formats.
-
In the
HTML options area, select Accordion Report.
-
Click OK.
-
Click Run.
The accordion report appears.
The following image shows an Accordion
Report which displays all data associated with the first level sort
field, Region, by default. The expanded data values you see are the
result of a report user clicking plus signs to the left of specific
first, second, and third level sort fields after the report is generated.
x
A Sort object can be inserted into the Report Painter
as a BY column. However the following options are unavailable when
a Sort object BY column is selected.
- Increase Size
- Decrease Size
- Bold
- Italic
- Underline
- Disable Underline
- Left Justify
- Center Justify
- Right Justify
- Default Justify
- Font Color
- Font Name
- Font Size
- Match All Styles