Using the Object Inspector
The Object Inspector enables you to add fields to a report, create
sort groups, view column, report, and image properties, and view
the report components for the procedure.
Report Painter opens by default with the Object Inspector positioned
in the left window pane of the Report Painter window. The Object
Inspector can be closed or floated on top of the Report Painter
window. Any changes made in the Object Inspector are reflected in
the Report Painter window and vice versa.
The Object Inspector has tabs that you can toggle between: Where/If,
Properties, Fields, Sort Groups, Setup, Pivot, and Images.
Note: The Pivot tab is available only when using the Excel®
2000 PivotTable (EXL2K PIVOT) report output format. For more information
about Excel PivotTables, see the Creating Reporting Applications With Developer Studio manual.
Among other things, the Object Inspector enables you to:
- View and modify the
properties of a column.
- View the thumbnail
and properties of an image.
- View properties of
a selected report object (column, heading, footing, or entire report).
- Add fields to your
report.
- Show the fields for
the Master File in a Field Tree or Field List, with options to show extended
information, such as title, description, alias, and so on.
- Create variable fields.
- View and modify the
sort status of a field.
Note: The Object Inspector is only available in the Report
Painter view.
x
Procedure: How to Float the Object Inspector
Double-click
the gray double lines above the Object Inspector title bar until
you see a solid blue line.
The Object
Inspector becomes a movable window that you can float on top of
the Report Painter window.
Tip: To dock the Object
Inspector, double-click the blue line above the Object Inspector
title bar.
x
Procedure: How to Show or Hide the Object Inspector
After
you have populated a report with information, you may wish to close
the Object Inspector so that the report is more fully visible on
the screen.
From the File menu, uncheck Show
Object Inspector.
Tip: You can reopen the
Object Inspector at any time by rechecking the Show Object
Inspector option on the File menu.
xAdding a Column to Your Report
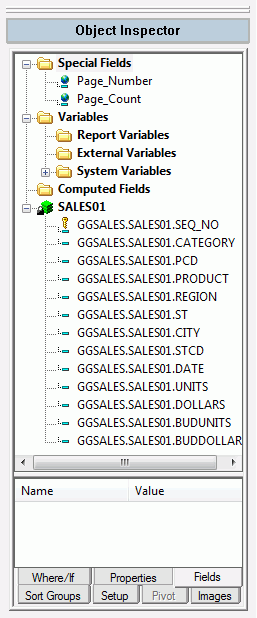
The Fields tab in the Object Inspector lists all field
names available for use in your report. This includes fields in
the open file and any joined files, temporary fields. You can select
a field to view its field name, qualified field name, alias, title,
description, and format in the lower pane. You can double-click
or drag fields from this pane to the Report Painter window, where
they become report columns. For details, see How to Add Columns to Your Report.
The Object Inspector is shown in the following image.

xIn this section: How to: Reference: |
You can view the fields list in the Object
Inspector as a:
- Tree separated by
segments (Field Tree).
- List of fields (Field
List).
- Tree separated by
Dimensions (Dimension Tree).
Note: When creating a report with a multi-dimensional
data source, additional folders in the Object Inspector, and all
other fields lists, are available. For more information about viewing
the fields list with a multi-dimensional data source, see Viewing the Fields List in the Creating
Reporting Applications With Developer Studio manual.
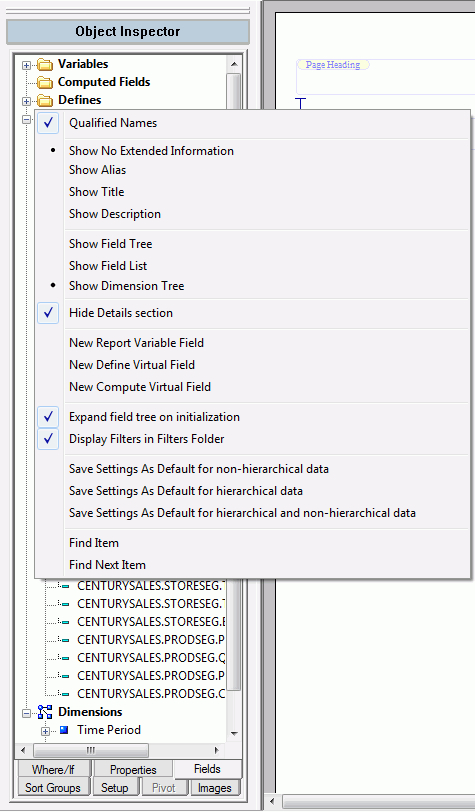
The following image shows the right-click context menu that is
available from the Fields tab of the Object Inspector when you right-click
on white space. The right-click menu changes to show only valid
options depending on the object you select.

You can double-click or drag segments or fields from the Object
Inspector to the Report Painter window, where they become report
columns.
You can customize how you view the fields list and save your
settings. You can also search for fields in the fields list. These
options appear anywhere in Report Painter where a fields list is
available. For example, Object Inspector, Define tool, Variable
Editor, and so on.
The System Variables folder contains variables that are automatically
populated with system values. These values include the current date,
current time, operating system, number of lines read, and number
of answer set lines in the last request. These values can be used
to control processing. For example, if no records are read for a
report request because no records fit the selection criteria, processing
may halt or the selection criteria may be changed. To view a description
of each variable, place the mouse over the system variable name.
Note:
- Show Dimension Tree
will only display when dimensions are available within the procedure.
- The Variable folder
for all Object Inspectors is no longer expanded.
- Variable Defines
are shown under the Query Variables folder.
- Parent-child Defines
are shown under the corresponding parent-child hierarchy.
- Other Defines are
shown under the Defines folder.
x
Using Dimension Tree View
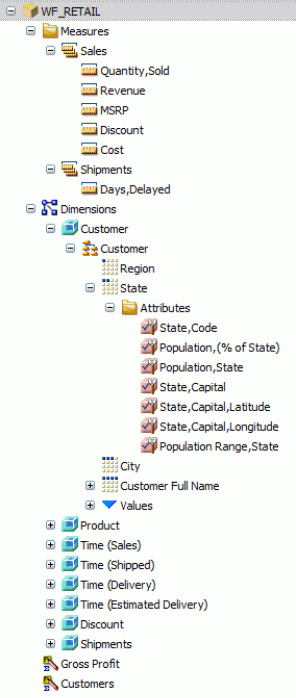
Dimension tree view displays fields in a hierarchical
structure of data. When a Master File defines Measures and Dimensions,
a report using that Master File will automatically open in Dimension
tree view. Fields are divided into two main categories, either Measures
or Dimensions. Beneath those two main categories are subcategories.
The category and subcategory the fields fall under is determined
by how they are defined in the Master File. The following image
shows the Dimension tree view with Measures and Dimensions having
multiple subcategories beneath them.

-
Dimensions
can be either BY or Detail column types.
-
Measures can be
BY, SUM, or Detail column types.
-
Any field list
can be switched to Dimension tree view. However, if Measures and
Dimensions are not defined in the Master File, then Measures and
Dimensions will not be displayed properly.
Note: You must select the correct column type before dragging
or double-clicking the field you want to add. For example, if you
double-click a Dimension when the SUM column type is selected, the
field will not be added to the report. You must change the column
type to BY or Detail and then double-click the field.
x
Procedure: How to Save the Fields List Options in Report Painter
-
Right-click
anywhere on the fields list and select from the options available
in the context menu to customize the view of the fields list.
-
Right-click on the fields list again
to save the settings of your view. Select from the following options:
-
Save Settings As Default for non-hierarchical data. Saves
the current fields list view as the default view for non-hierarchical
data. The fields list appears differently for hierarchical data.
-
Save Settings As Default for hierarchal data. Saves
the current fields list view as the default view for hierarchical
data. The fields list appears differently for hierarchical data.
-
Save Settings As Default for hierarchical and non-hierarchical data. Saves
the current fields list view as the default view for all data sources,
non-hierarchical and hierarchical data.
x
Procedure: How to Collapse the Field Tree
Right-click
anywhere on the Field Tree and deselect Display Filters
in Filters Folder from the context menu.
The
selected option is not immediately applied but appears the next
time you view a Field Tree.
Note: This option is also
available from the Reporting tab of the Developer Studio Options
dialog box.
x
Procedure: How to Display Filters and Computes in the Field Tree
By default, Master File Filters and
Computes are shown in the Report Painter Object Inspector in the
Filters folder, or Computes Folder, when using the Field Tree View.
Note: If
using a Master File Computes field, the Object Inspector automatically
displays the field in a Master File Computed Fields folder.
- Right-click anywhere
on the Field Tree and deselect Expand field tree on initialization from
the context menu.
- Right-click anywhere
on the Field Tree and deselect Display Filters in Filters
Folder from the context menu.
The
selected option is not immediately applied but appears the next
time you view a Field Tree.
Tip: These
options are also available from the Reporting tab of the Developer Studio
Options dialog box.
x
Reference: Applying Mandatory Filters to Fields
If
the Access Property NEED_VALUE option is specified for fields in
the Master File being used in Report Painter, the Object Inspector
indicates the fields that require a mandatory filter in the report.
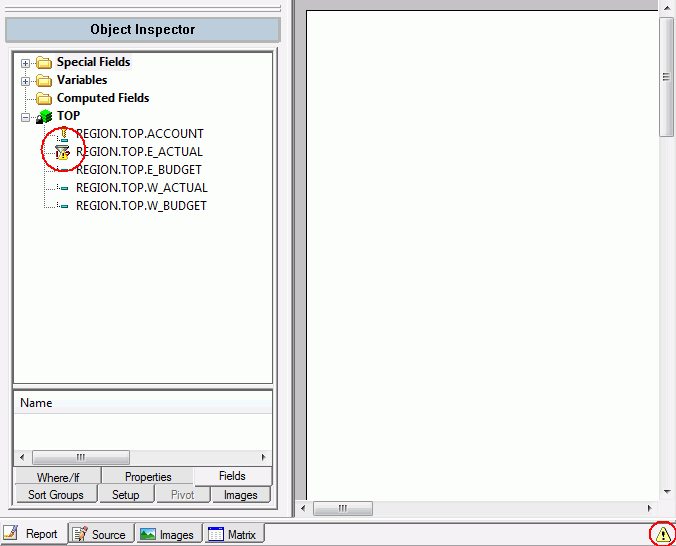
The following image shows
an Alert icon for the City field in the Object Inspector and on
the Report Painter status bar.
The items circled in red are
the mandatory field indicators, as shown in the following image.

Note: The
Alert icon is removed from the Object Inspector and status bar after
a filter is applied to the NEED_VALUE field.
x
Procedure: How to Find a Field in the Fields List
-
Right-click
anywhere on the fields list and click the Find Item option.
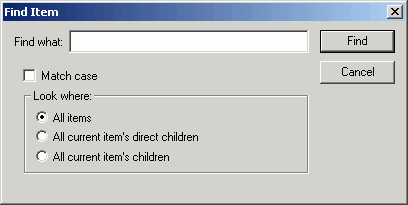
The Find Item dialog box opens.
-
Enter a
search field in the Find what input field.
-
Click Find to
search for the field. The item is highlighted in the fields list.
-
Right-click
on the fields list again and click Find Next Item to
find the next occurrence of the item in the fields list. The next
item is highlighted in the fields list. If no item is found, a message appears.
x
Reference: Find Item Dialog Box

-
Find what
-
The Find Item search field input area.
-
Match case
-
Searches for the field name exactly as entered. The search
field is case-sensitive.
-
Look where
-
All items
-
Looks for the search field in the entire fields list.
-
All current item's direct children
-
Looks for the search field in all children fields of the
parent hierarchy.
-
All current item's children
-
Looks for the search field in all children fields of every hierarchy.
Note: For
more information about hierarchical data sources, see Hierarchal Reporting in Developer Studio in
the Creating Reporting Applications With Developer Studio manual.
xViewing Column Properties
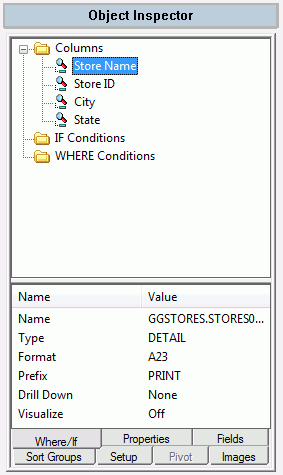
You can view and modify the column properties in the
Report Painter window from the Where/If tab in the Object Inspector,
which is shown in the following image.

Select a column in the Where/If tab to display the column properties
in the bottom pane of the Object Inspector (if showing details).
These properties include column name, sort type, format, prefix
operator status, drill-down status, and visualize status. There
is a descriptive icon to the left of each column indicating the
sort status of the column. For details, see Viewing and Manipulating Sort Groups.
Note: Right-click and click Hide Details section to show
or hide details anywhere in the Object Inspector.
Right-click a column and click Options from
the context menu to open the Field Properties dialog box where you
can format and style your column, and apply drill down capabilities.
Any changes made to the column properties are reflected in the Report
Painter window.
x
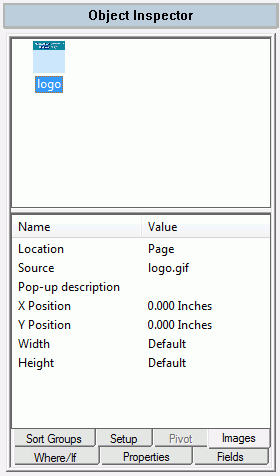
You can view properties of an image in the Report Painter
window from the Images tab in the Object Inspector, as shown in
the following image.

Select the thumbnail of the image in the Images tab to display
the image properties in the bottom pane of the Object Inspector.
These properties include the location of the image, image name,
positioning on page, and size.
Note: Right-click and click Hide Details section to show
or hide details anywhere in the Object Inspector.
Double-click the image to edit these properties in the Image
Properties dialog box.
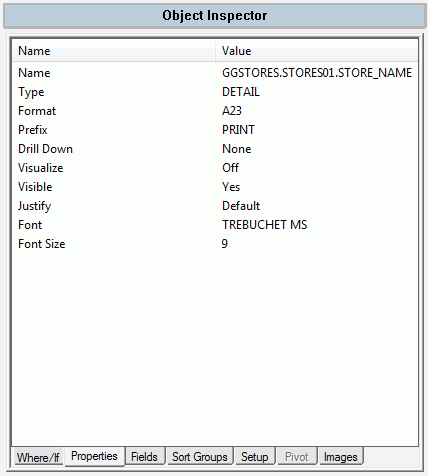
xViewing the Object Properties of a Report
When you select the object of a report (column, heading,
footing, or entire report) in the Report Painter window, its properties
are reflected in the Properties tab in the Object Inspector, as
shown in the following image.

x
Procedure: How to View the Properties of the Entire Report
Place
your cursor in a blank space in the Report Painter window.
The
report properties appear in the Properties tab in the Object Inspector.
xViewing and Manipulating Sort Groups
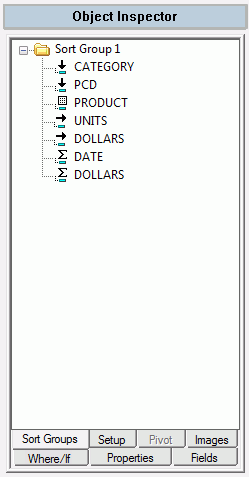
You can view and modify the sorting properties of fields
in the Report Painter window from the Sort Groups tab in the Object
Inspector, as shown in the following image.

The Sort Groups tab displays the sorting method being applied
to each column in the Report Painter window. You can change the
sorting method (for example, from By to Across or from Detail to
Sum) from the Sort Groups pane. The changes are reflected in the
Object Inspector Where/If and Sort Groups panes, and in the Report
Painter window.
You can also create reports that include both detail and summary
information from the Sort Groups pane. For details, see Sorting in Groups to Create a Combined Detail/Summary Report.
x
Reference: Sort Type Icons
The icons
in the first column to the left of the field name display the type
of sort field. The icons and their meanings are defined in the following
table.
|
Icon
|
Definition
|
|---|
|

|
Across field.
|
|

|
By field.
|
|

|
Sum field.
|
|

|
Detail field.
|
|

|
For field.
|
|

|
Hierarchy field.
Note: This
option is only available when using a multi-dimensional data source.
For more information, see Sorting Hierarchical Data in the Creating
Reporting Applications With Developer Studio manual.
|
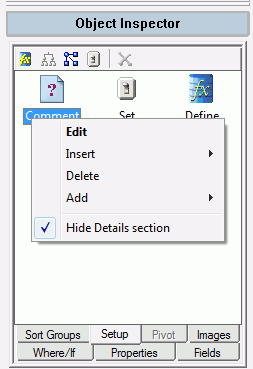
xOpening Report Components
You can open components that precede the report component
from the Setup tab on the Object Inspector. Double-click a component
in the Setup tab to open the tool that created the component, as
shown in the following image. Right-click a component in the Setup
tab and select Hide Details section to display
the syntax for that component in the bottom pane of the Object Inspector.
