How to: |
The advantage of using a Guided Report is that you can create one streamlined, highly parameterized report and from that one report, you can generate thousands of different report outputs at run time. It requires no knowledge of code to customize the final report with the data you want displayed.
A page with controls for the Guided Report parameters appears so you can customize and run different versions of the report dynamically, as shown in the following image.
Note: Autoprompt is not recommended because variables are not displayed in the correct context.
Being a part of the same parameter group means those fields will appear in the same control.
Note:
One variable for each selected column creates one control for every selected column with all the selected field names as values. In this example, we are creating a parameter group for two sort fields and another parameter group for two sum fields. There will be four controls, two having COUNTRY and CAR (sort fields) and the other having RETAIL_COST and DEALER_COST (sum fields).
 .
Each column title has an ampersand in the top-left to signify
that it is a member of a parameter group. In this mode, each field
has a different color scheme. For example, COUNTRY has a blue background
with a yellow ampersand and CAR has a blue background with a white
ampersand.
.
Each column title has an ampersand in the top-left to signify
that it is a member of a parameter group. In this mode, each field
has a different color scheme. For example, COUNTRY has a blue background
with a yellow ampersand and CAR has a blue background with a white
ampersand.
In this example, RETAIL_COST and DEALER_COST make up the second parameter group, as shown in the following image.
Note that RETAIL_COST has a white background with a blue ampersand, and DEALER_COST has white background with a red ampersand.
The page is displayed, as shown in the following image.
Selecting different options from the controls and clicking Run will display different results, as shown in the following images.
At least one field must be selected. Otherwise, a message will appear instead of the output.
In the following image, COUNTRY, CAR, RETAIL_COST, and DEALER_COST are displayed.
In the following image, only CAR and RETAIL_COST are displayed.
The Edit Variable Fields option is available when one column is selected or multiple columns of the same parameter group are selected.
This is a scaled-down version of the Variable Editor. You can change the variable type only to Single Select or Multiselect (Single Select is the default). You can reorder the fields, add or delete fields, edit display and return values, edit prompt text, and change the variable name suffix. The scaled-down version of the Variable Editor is shown in the following image.
You can edit the display and return values to have user-friendly values or more sophisticated WebFOCUS syntax. For example:
Display Value: TOP 5 CAR SALES
Return Value: HIGHEST 5 SALES
Note: Autoprompt is not recommended because variables are not displayed in the correct context.
Being a part of the same parameter group means those fields will appear in the same control.
Note:
One variable for all selected column creates one control for all selected columns with all the selected field names as values. In this example, there will be two controls. One control will have COUNTRY and CAR as options, the other will have RETAIL_COST and DETAIL_COST as options.
.
Each column title has an ampersand in the top-left to signify
that it is a member of a parameter group. In this mode, each parameter
group is assigned the same color scheme. For example, both COUNTRY
and CAR have a blue background with a yellow ampersand.
In this example, RETAIL_COST and DEALER_COST make up the second parameter group, as shown in the following image.
Note that RETAIL_COST and DEALER_COST will both have a white background with a blue ampersand.
The page is displayed, as shown in the following image.
Selecting different options from the controls and clicking Run will display different results, as shown in the following images.
At least one field must be selected. Otherwise, a message will appear instead of the output.
In the following image, COUNTRY, CAR, RETAIL_COST, and DEALER_COST are displayed.
In the following image, only CAR and DEALER_COST are displayed.
The Edit Variable Fields option is available when one column is selected or multiple columns of the same parameter group are selected.
The Guided Variable Definition dialog box allows you to edit the prompt text, reorder the fields, edit the display and return values, and change the variable field suffix. Note that you cannot add or delete fields. The Guided Variable Definition dialog box is shown in the image below.
Multiselect is the default for One control for all selected columns mode. This can be changed to Single select if you want.
You can edit the display and return values to have user-friendly values or more sophisticated WebFOCUS syntax. For example:
Display Value: TOP 5 CAR SALES
Return Value: HIGHEST 5 SALES
Note: Autoprompt is not recommended because variables are not displayed in the correct context.
Note:
.
In this example, the CAR field was selected. CAR is a vertical (By) sort field.
The Field Properties window is displayed.
For non-sort fields in one control for all selected columns mode only, the chosen options affect the last field selected in the control at run time. The WebFOCUS syntax representation of this is shown below.
TABLE FILE CAR
PRINT DEALER_COST RETAIL_COST SALES NOPRINT
END
Because SALES is the last column in the request, any options will be applied only to SALES.
If these fields are a parameter group and you select DEALER_COST, then NOPRINT is applied to just DEALER_COST. If you select DEALER_COST and RETAIL_COST, then NOPRINT is applied to RETAIL_COST because it is last.
PRINT <DETAIL_COST, RETAIL_COST> NOPRINT
For sort fields, any options applied to that parameter group will be applied to all fields.
The Sorting, Grouping, and Actions tabs have options that can be variable or added as real values (not variable). The grouping tab will only display for a numeric field.
In One control for each selected column mode, all options affect any field selected in the control for the report column that was used to create the options.
Note: The Sort tab and the Actions subtab are only available for sort fields. Some of the options you can select for a sort field are: Underline, Skip Line, No Split, Page Break, and Restart Page Numbering. For detail and sum fields, options can be selected from the General tab. Some of the options you can select are Skip Line and Fold Line.
Putting options on a sort field in One control for all selected columns mode will apply the options to all sort fields in the parameter group regardless of which one was used to create the options.
Clicking the ampersand button for an option will open the Guided Variable Definition dialog box, as shown in the following image.
You can change the Display Values and Return Values for an option, reorder values, and add or delete values, as shown in the following image.
In this example, DEALER_COST and RETAIL_COST make up the second parameter group, as shown in the following image.
The page is displayed with both the parameter groups and report options, as shown in the following image.
Select different options from the controls and click Run to display different results.
At least one field must be selected. Otherwise, a message will appear instead of the output.
In the following image, CAR, COUNTRY, DEALER_COST, and RETAIL_COST are displayed with all options turned on.
In the following image, CAR, COUNTRY, DEALER_COST, and RETAIL_COST are displayed with all options turned off.
The Field Properties dialog box opens.
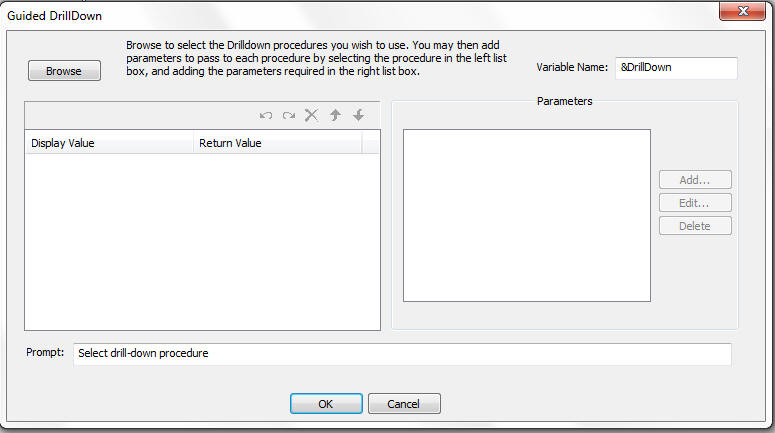
From the Guided DrillDown dialog box, you can:
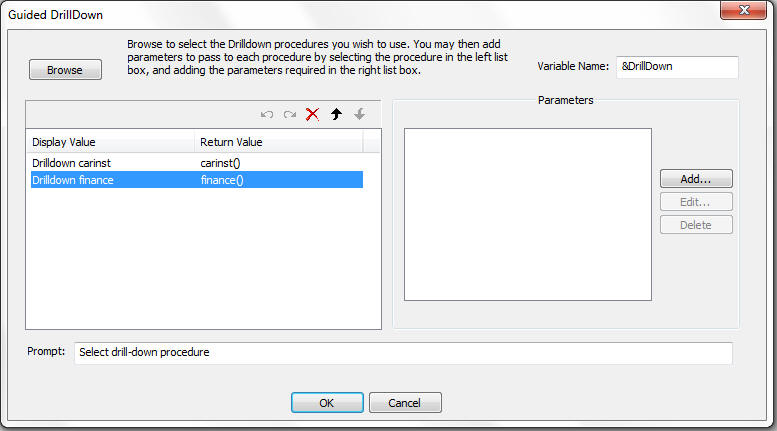
The return values and display values for the procedures are added to the Display Value and Return Value columns, as shown in the following image.
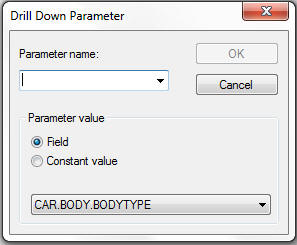
You must select the procedure for which the parameters will apply on the left side before clicking the Add button on the right side.
The Drill Down Parameter dialog box opens, as shown in the following image.
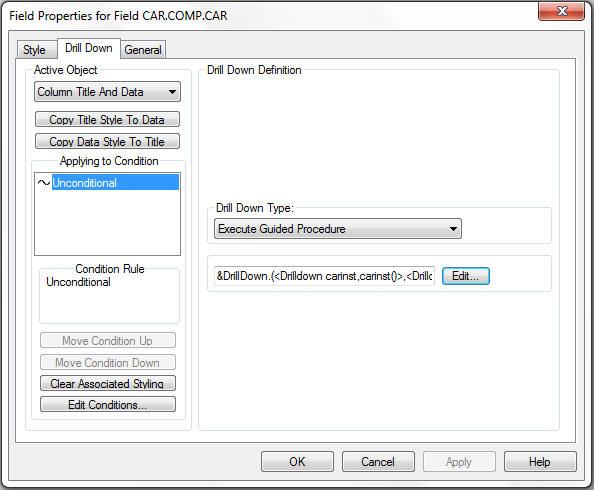
The drill-down procedures are added to the field properties box, as shown in the following image.
The user will be prompted with a list of drill-down procedures from which to choose from at run time, as shown in the following image.
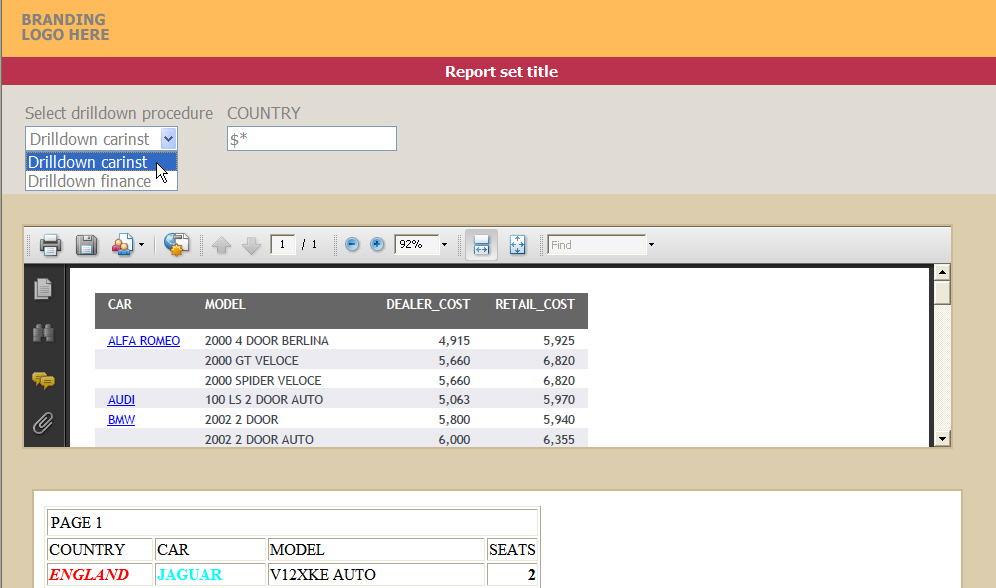
When the user selects a procedure, they can click the hyperlink in the report to perform the drill down to the selected procedure.
| WebFOCUS |