Navigating Sort Groups From a Table of Contents
You can enhance navigation within a large HTML report by adding
a dynamic HTML-based Table of Contents (TOC). To take advantage
of this feature, the report must contain at least one vertical sort
(BY) field. If you include more than one sort field in a report,
the hierarchy is determined by the order in which the sort fields
are specified in the request.
Note: The Table of Contents option is available
for the HTML, HTML active report, active report with Adobe Flash
Player (FLEX), Excel, Default, and User output formats.
The TOC also enhances the display of groups of data. You can
view one section (or page) of a report at a time, or you can view
all sections at once. You can control this feature with a page break.
For more information, see Customizing Report Sections for Display.
The TOC displays all values of the first (highest level) vertical
sort field, as well as the values of any lower level By fields designated
for inclusion. These values appear as an expandable series of links
or as a series of list controls. Unless otherwise specified in the request,
a new section begins when the highest level sort field changes.
The display of data for a lower level sort field is controlled
by your selection of a higher level sort field value. For example,
in a report sorted first by country and then by car model, if you
choose Italy from the TOC for country, you will only see a listing
of Italian car models in the TOC for cars. Cars produced in other
countries are not displayed.
Using the TOC, you can:
- View any section
of a report by clicking the associated link.
- Toggle between
a single section and the entire report content.
- Remove the
TOC. This feature is useful when printing the report from the browser. Double-click
anywhere in the report to restore it and continue navigation.
The TOC itself is an object that initially appears in the upper-left
corner of the report, or as one or more drop-down lists in a page
heading or footing or a report heading or footing.
For more information, see:
x
Procedure: How to Add a TOC or Disable the TOC Feature
-
From Report Painter, right-click a
By column in the report and click Table
of Contents. A cascading menu appears.
-
Choose one of the following options:
or
- Right-click
the first By column in the Report Painter window and select Options.
The Field Properties dialog box opens.
- Click the General tab.
- Click Report or Heading in
the Table of Contents section of the tab.
- To turn the
TOC feature off, click None in this section
of the tab.
Example: Adding a Single-Level TOC to a Report or Page Heading
You may add a single-level TOC to a Report or to a Page
Heading.
- After selecting
the Centord data source to report against, open Report Painter.
Tip: To verify that the output format is set
to HTML, click the Options button and ensure
that HTML appears in the Select Format drop-down list.
- Add the following
fields from the Object Inspector: PLANT, PRODCAT,
and LINEPRICE.
- Select the LINEPRICE column
in the Report Painter window and click the Sum button.
- Select the PLANT and PRODCAT columns
and click the By button.
- Right-click
the first By column (PLANT)
and click Table of Contents, then choose Report (for
a Report) or Heading (for a Page Heading)
from the cascading menu.
Note: If heading
is selected, the PLANT field is inserted into the page heading.
- Enter SALES
REPORT as the page heading, change the font size to 10, and center the
heading.
Note: If adding a TOC as a page
heading, enter SALES REPORT before the <PLANT field.
- Run the report.
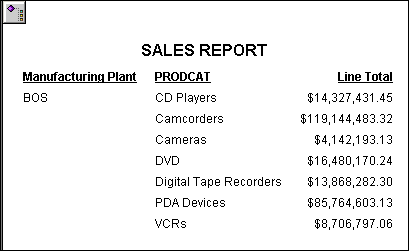
For
a Report, the TOC object appears in the upper-left corner, as shown
in the following image.
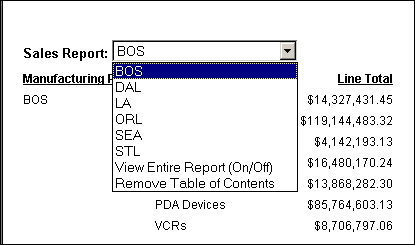
For a Page Heading, the TOC appears
in the page heading drop-down list. Expand the drop-down list to
display the sort values for PLANT and the viewing options.
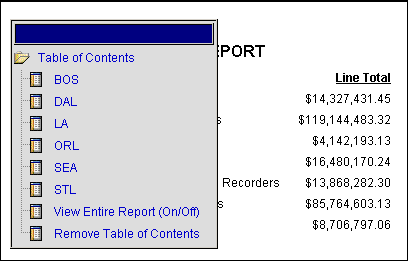
- Double-click
the TOC icon (for a Report) to display a list of the sort values
for PLANT, with two viewing options.
You can move the TOC anywhere on
the screen by clicking the blue area above the Table of Contents
and then dragging the TOC. You can also move it by double-clicking
a location in the report at which to position the TOC.
- On the TOC,
click each plant (city) to see the related information. The selected
plant flashes to highlight it in the window. You can display any
portion of the report by clicking that value in the TOC.
You
have the following options:
- Click View
Entire Report to display all data values in the report.
- Click Remove
Table of Contents to remove the TOC.
- Double-click
anywhere in the report area to redisplay the TOC.
- For a TOC in
a Report, click Table of Contents to collapse
the TOC list. Click Table of Contents again
to expand it.
Tip: You can customize the look and feel of the TOC
object by editing a .css file. Go to \ibi\DevStudioxx\ibi_html\javaassist\intl\En\toc.css.
Do not forget to make a backup copy.
Note: To display all columns of data so that they have the
same width, use one of the following options:
xNavigation Behavior in a Multi-Level TOC
If you select a value in a multi-level TOC, that value
flashes (it is highlighted in gray) to draw attention to it. It
also moves to the top of the window for viewing.
If the selected value is already viewable in the window, and
the remaining report will fit in the window, the value flashes,
but the report does not scroll.
x
Procedure: How to Navigate Sorted Data From a Multi-Level Report TOC
In this example, you will add a dynamic HTML TOC as an
object in the upper-left corner of a report and display a hierarchy
consisting of multiple levels of sort fields, beginning with the
highest level.
-
After
selecting the Short data source to report against, open Report Painter.
Tip: To verify
that the output format is set to HTML, click the Options button,
and ensure that HTML appears in the Select Format drop-down list.
-
Add
the following fields from the Object Inspector: PROJECTED_RETURN, CONTINENT, REGION, COUNTRY, HOLDER,
and TYPE.
-
Select
the CONTINENT, REGION, COUNTRY, HOLDER,
and TYPE columns and click the By button.
-
Select
the PROJECTED ANNUALIZED RETURN column and
click the Sum button.
-
Right-click
the fifth By column (TYPE)
and choose Table of Contents, then choose Report from
the cascading menu.
-
Run
the report.
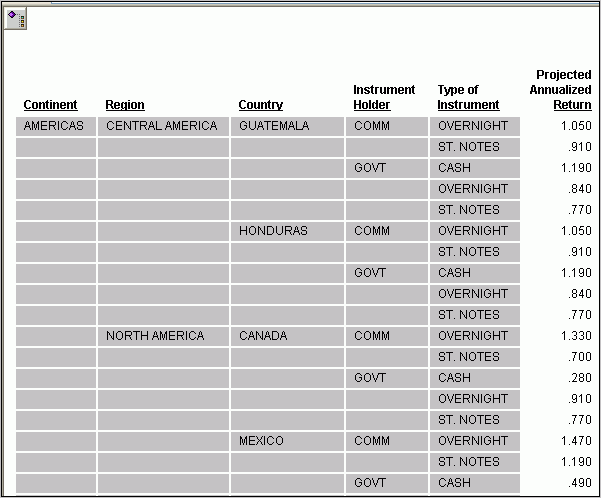
The TOC appears in the upper-left corner,
as shown in the following image.
-
Double-click
the TOC. Select View Entire Report and scroll
down to see the data for the three continents.
Scroll back to the top of the report. Select AMERICAS. Your
selection flashes to highlight it in the window. If you scroll down
now, you will see that the report contains values only for the Americas.
-
Click
the plus sign (+) next to AMERICAS in the TOC,
and then click the plus sign (+) next to
SOUTH AMERICA, as shown in the following image.
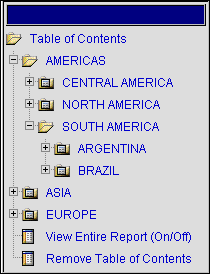
The field values ARGENTINA
and BRAZIL are listed in the TOC. These are values of COUNTRY. To
see the field name of a value in the TOC, place the cursor over
that value.
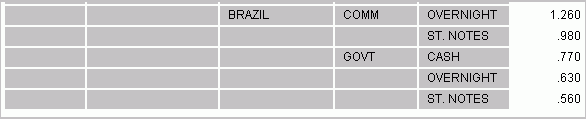
-
Select BRAZIL.
BRAZIL flashes, and the associated data moves into the window, as
shown in the following image.
-
Continue
to drill down to the detail you want to view by choosing values at
any sort level in the TOC:
- Clicking a
plus sign (+) expands the field to display its values in the TOC.
- Clicking an
actual value (link) in the TOC momentarily highlights that value
in the report and, if necessary, adjusts the report display to move
the value into view.
- If you click Table
of Contents, the TOC collapses, but you can continue
to scroll through the data, expand the TOC again, and make additional
selections.
x
Procedure: How to Navigate Sorted Data From a Multi-Level Page Heading TOC
To
generate a lengthy report for the purpose of illustration, this
example prints the field PROJECTED_RETURN (that is, it uses the
Detail function for the field).
-
After
selecting the Short data source to report against, open Report Painter.
Tip: To verify
that the output format is set to HTML, click the Options button,
and ensure that HTML appears in the Select Format drop-down list.
-
Add
the following fields from the Object Inspector: PROJECTED_RETURN, CONTINENT, REGION, COUNTRY, HOLDER,
and TYPE.
-
Select
the CONTINENT, REGION, COUNTRY, HOLDER,
and TYPE columns and click the By button.
-
Right-click
the first three By columns (CONTINENT, REGION, and COUNTRY) one
at a time and choose Table of Contents, then choose Heading from
the cascading menu.
These fields are inserted in the page heading.
Note: When adding TOC
to a heading, add additional page breaks to lower-level sort fields
to group the hierarchical data correctly.
-
Enter
the following text in the page heading so that the heading looks like
this:
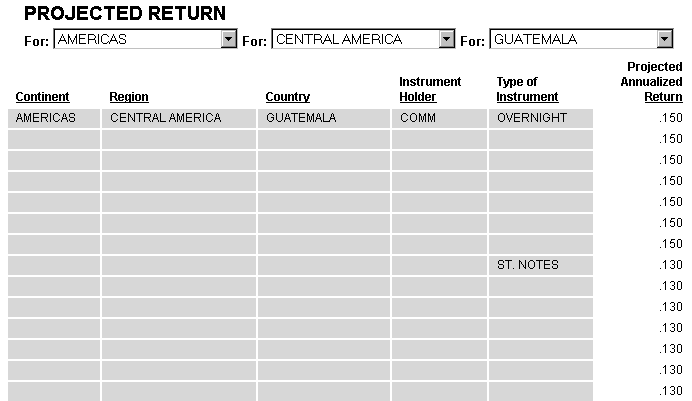
PROJECTED RETURN
For: <SHORT.SHORT.CONTINENT For: <SHORT.SHORT.REGION For: <SHORT.SHORT.COUNTRY
Change the font size of the second line to 10.
-
Run
the report. It contains three HTML TOCs in the drop-down lists in the
second line of the page heading, one for each sort field specified
in the request, as shown in the following image.
-
Click
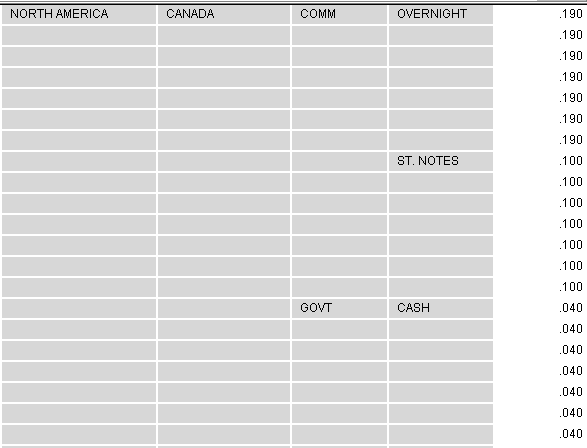
the arrow in the second TOC drop-down list and select NORTH AMERICA.
Keep in mind that the values in this drop-down list are related
to those in the higher and lower level drop-down lists. Said another
way, they are all part of the same higher level sort group, and,
therefore, within the same page break.
The selected value, NORTH AMERICA, flashes
and moves to the top of the window. From there you can scroll to
see the related data, as shown in the following image.
If you select information already
in your field of view, the value will flash to draw your attention
to that location, but the display will not change.
-
Choose
ASIA from the first TOC list. This selection changes your highest level
sort group, and affects all of the lists below it. ASIA flashes
and moves to the top of the window, where you see information for
the first city (HONG KONG) in the FAR EAST region.
-
Continue
to experiment with other selections.
xCustomizing Report Sections for Display
Data in a report with a TOC is grouped into sections
based on the sort fields.
You can customize each section with a page break. By default,
a page break is included in the first (highest level) sort field.
You can add page breaks to create additional sections and group
the data based on a lower level sort field.
Example: Customizing Report Sections
To generate a lengthy report for the purpose of illustration,
this example prints the field PROJECTED_RETURN (that is, it uses
the Detail function for the field).
- After selecting
the Short data source to report against, open Report Painter.
Tip: To verify that the output format is set
to HTML, click the Options button and ensure
that HTML appears in the Select Format drop-down list.
- Add the following
fields from the Object Inspector: PROJECTED_RETURN, CONTINENT, REGION, COUNTRY, HOLDER,
and TYPE.
- Select the CONTINENT, REGION, COUNTRY, HOLDER,
and TYPE columns and click the By button.
- Right-click
the column Instrument Holder and click Options from
the menu. On the Field Properties dialog box, click the Sort tab.
From the Actions tab, click On from the Page
Break drop-down list. Click OK to close the
dialog box.
This step generates a page break on the report each
time the value of HOLDER changes.
- Right-click
the fifth By column (Type of Instrument)
and choose Table of Contents, then choose Report from
the cascading menu.
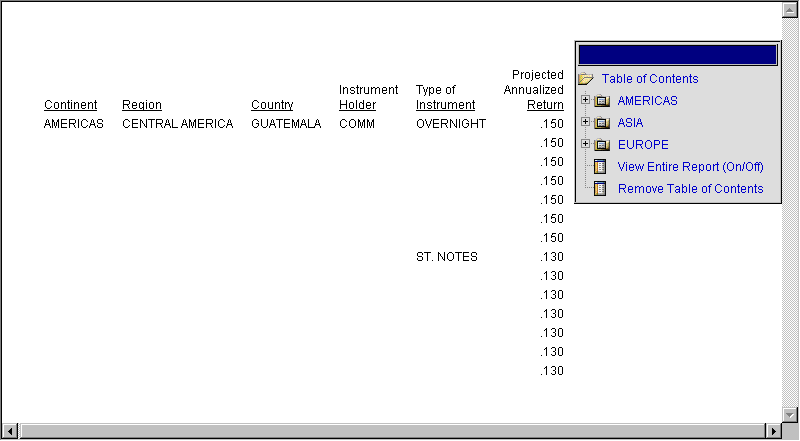
- Run the report.
The TOC appears in the upper-left corner, and only one section of the
report (the data for the instrument holder COMM) appears.
Double-click
the TOC to expand it, and move it outside the report data, as shown in
the following image.
x
The TOC feature:
- Applies to
HTML, HTML active report, active report with Adobe Flash Player (FLEX),
Excel, Default, and User output formats.
- Is supported
with Internet Explorer® Version 5.5 and later.
- Does not support
the Dialogue Manager command -HTMLFORM.
- Designates
a TOC for a By field without also specifying a TOC for its parent
(By) fields. The reason for this is that the TOC controls are interdependent
and require the physical presence of each parent control to operate
correctly. For example, if the request contains BY COUNTRY BY CAR
BY MODEL, a report cannot include a TOC control for CAR without
also including one for COUNTRY.
Note:
- The size of
a TOC-enabled report is limited to the memory available on the WebFOCUS
Client.
- If you have installed
ReportCaster, you can distribute a report with an HTML TOC by including
the commands SET BASEURL=HTTP://webserver and ON TABLE PCHOLD
FORMAT HTML BYTOC [n] in the report request.