How to: |
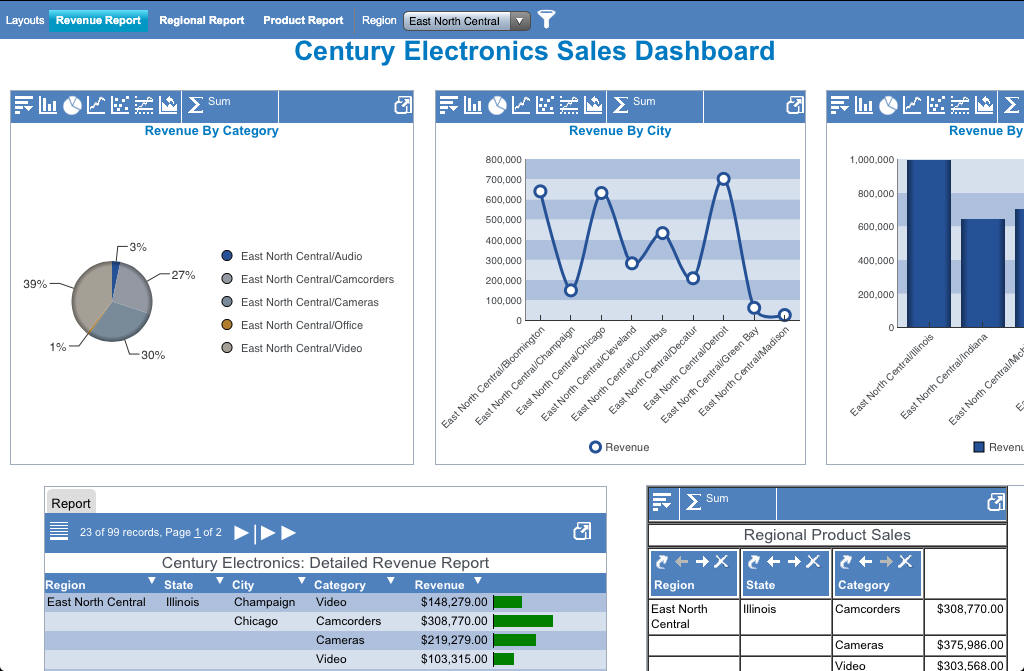
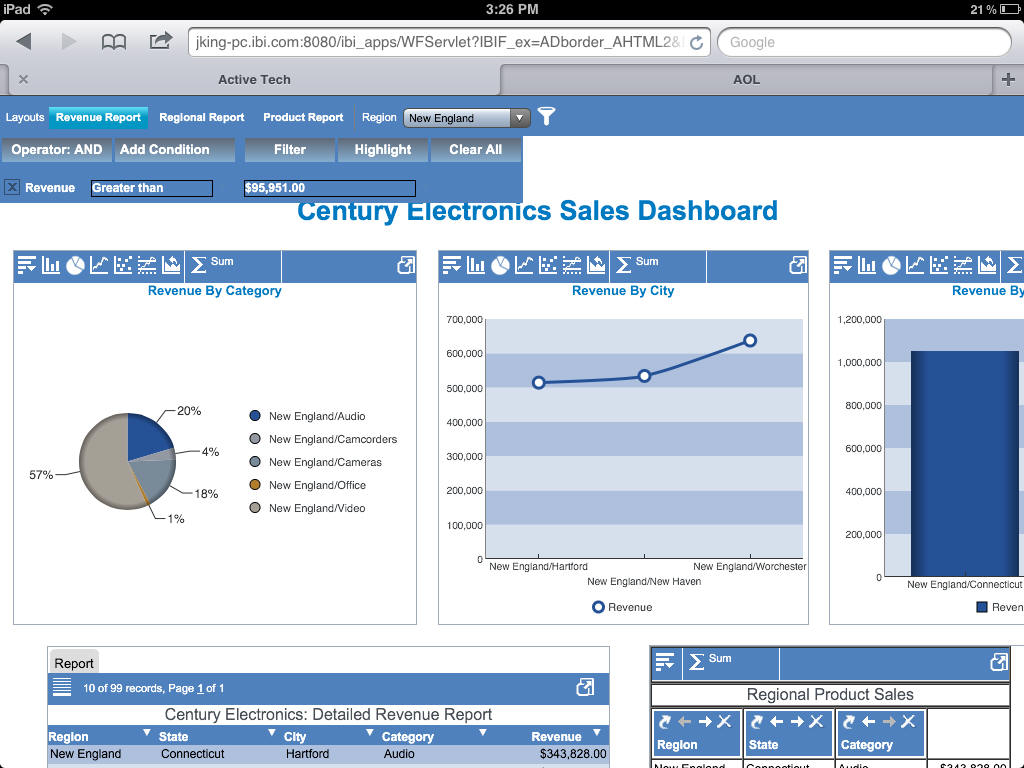
The following image shows a sample active dashboard that is running on an iPad.
The dashboard bar at the top of an active dashboard contains the page layout tabs and global filter drop-down list. On mobile devices, the bar is floating instead of fixed, making the available functions always accessible, no matter where you move within the dashboard.
You can use standard gestures on an active dashboard to scroll left and right or up and down, or zoom in and zoom out.
You can tap the Fullscreen View
 icon on the right edge of the pagination bar for an individual grid
or on the right edge of a chart tool bar or pivot tool bar to view
the grid, chart, rollup table, or pivot table on the dashboard in
full-screen mode.
icon on the right edge of the pagination bar for an individual grid
or on the right edge of a chart tool bar or pivot tool bar to view
the grid, chart, rollup table, or pivot table on the dashboard in
full-screen mode.
 icon
to apply a filter to the dashboard.
icon
to apply a filter to the dashboard.
The Global Filter dialog box opens under the dashboard bar.
Note: The list of available fields when you click on Add Condition depends on which fields are common to all report or chart components in the dashboard. If multiple fields are common, then those fields will appear in the list.
| WebFOCUS |