Dashboard Designer
|
In this section: |
|
How to: |
The Dashboard Designer is available to the user if the user was given Administrator rights to the dashboard.
To access the Dashboard Designer, from the Today page, click the dashboard icon ![]() , select Content, and then click the Edit Dashboard icon
, select Content, and then click the Edit Dashboard icon ![]() .
.
The Dashboard Designer opens, as shown in the following image.

Dashboard Designer includes:
- A canvas, which is the surface on which you position and configure gadgets.
- The Gadgets catalog, which provides a list of the available gadgets currently registered with PMF. Each gadget is represented by a thumbnail preview image that lets you see how the gadget looks and works. A scroll bar directly to the right of the gadgets enables you to view the entire list of available gadgets. From the list, you can drag and drop individual gadgets onto the canvas.
- The WebFOCUS catalog, which provides a list of WebFOCUS content and folders which you can easily drag onto any dashboard.
- A toolbar, from which you can click the following icons:
- Save Dashboard icon
 ,
to save the current dashboard, including the gadgets that you added
to the dashboard and their position on the page. For a new dashboard,
you are prompted for a name when you click Save for
the first time. If this option can be changed, you can also indicate
whether the dashboard is public or private. A public dashboard is accessible
to all PMF users at the site. A private dashboard is accessible
only to you.
- Save as Dashboard icon
 ,
to save the dashboard under a new name.
- Reset dashboard icon
 ,
to reset Dashboard user preferences back to the default
preferences in the original dashboard design.
- Exit Edit icon
 , to exit the Dashboard Designer.
- Save Dashboard icon
Dashboard Design Tips
When designing a dashboard, use the following guidelines:
- Provide enough space for gadgets. Configure and position your gadgets to provide enough space to display properly in the dashboard.
- Avoid scroll bars. The best designed dashboards show all of the important Information without requiring the use of scroll bars. If scrolling is required, place the most important information and indicators in the most significant locations of the dashboard, either close to the top left corner or near the center of the dashboard.
- Design for different screen resolutions. The PMF Dashboard Designer enables you to design for any target screen resolution, but cannot automatically reconfigure and deploy your dashboard design to a lower resolution screen. Make sure you know the target resolutions your consumers will be using, and design alternate versions of the dashboards as needed.
- Mix contexts so users can see everything. Where possible, avoid requiring users to switch flags or options to see all of the data that is important to them. PMF enables you to configure each dashboard by owner, scorecard, or gadget, so you can point different gadgets to different contexts and avoid making users perform unnecessary clicks.
- Appropriate metrics. PMF can automatically detect and display valid metrics for each dashboard and scorecard. However, because PMF cannot select the most appropriate metric to display for a scorecard, you should set up appropriate default metrics for each scorecard.
Procedure: How to Design a New Dashboard
- From the Today page, click
the dashboard icon
 and then click the Add Dashboard icon
  .
. The Gadgets catalog opens, as shown in the following image.

- Use the
scroll bar to display the
entire list of available gadgets. You can also search for a specific
gadget by clicking the Gadget Preferences icon
 and typing its name in the search field.
To see more detailed information about the available gadgets, hover over the gadget. A tooltip opens, which shows information about the gadget, such as its accepted filters and whether it can receive a broadcast. The following image shows an example of the tooltip.

- Drag the
desired gadget or gadgets onto the design canvas.
PMF retrieves the default size for each gadget that you add to the canvas.
- Perform
the following actions to achieve the desired result.
- To reposition a
gadget on the canvas, click anywhere inside the gadget and
drag the gadget to the desired location.
Dashboard Designer automatically aligns the top edges of gadgets that are in proximity.
- To resize a gadget on the canvas, click the lower-right corner of the gadget and drag the borders of the gadget to the desired height and width.
- To delete a gadget
from the dashboard, click the Delete Gadget icon
 on the title bar of the gadget.
- To change the values
used to display the data for a gadget, click the Gadget Preferences icon
 on the title bar of the gadget. Make your selections from available list items. For details, see Changing Dashboard
Gadgets and Preferences.
- To add WebFOCUS content, click the WebFOCUS panel button and select the folder that contains the content you want to use. Drag the content to the desired location on the dashboard.
- To reposition a
gadget on the canvas, click anywhere inside the gadget and
drag the gadget to the desired location.
- Optionally,
click the Listens to filters icon
 to specify whether or not run-time changes will affect the selected gadget.
For details on Broadcast, see Setting Up Broadcast on a Dashboard.
- On the side toolbar,
click the Save Dashboard icon
 when you are satisfied with your
design.
 The following image shows the Save Dashboard window.

- Type a name for the new dashboard and select whether the dashboard is public
or private in the check box.
If you select the Private checkbox, the dashboard will be visible only to the owner who created it. You can create a private dashboard with Edit or higher dashboard access. If you leave the dashboard as public, it will be visible to all owners in PMF. Administrator access is required to create a public dashboard.
Note: If you exit the designer without saving your changes, you will be prompted to either save or cancel your changes.
Procedure: How to Edit an Existing Dashboard
- From the Today page, click
the dashboard icon
 and then click the Edit Dashboard icon
  .
. The dashboard opens in the Dashboard Designer.
- Make any desired changes to the
dashboard, such as adding or deleting gadgets, moving the position of the gadget, or adding WebFOCUS content. To rename the
dashboard, click the title bar with the Scorecard - Dashboard name. A Rename Dashboard window opens, as shown in the following
image.

Note: You can also rename a dashboard using the Looks and Properties panel. For more information, see Styling the Dashboard.
- On the side toolbar,
click the Save Dashboard
 or Save As Dashboard icon
  when you are satisfied with your
design.
when you are satisfied with your
design.Note: If you exit the designer without saving your changes, you will be prompted to either save or cancel your changes.
Controlling the Look of a Gadget
You can make changes to a gadget when its title bar appears. To display the title bar, hover anywhere over the gadget.
The gadget controls include the following:
- Moving. You can position the anchor point of any gadget. To move a gadget, click inside the gadget and drag the gadget to the desired position.
- Resizing. You can interactively adjust the height and width of a gadget. Click the lower-right corner of the gadget and drag the borders of the gadget to resize it as desired.
- Deleting. The
Delete Gadget icon
 removes the selected gadget from the canvas.
- Gadget Preferences. A
separate Gadget Preferences icon
 exists for each gadget on a dashboard. The icon opens a panel
on which you can change the values used to display the data for
that gadget. For more information on specifying preferences for
a gadget, see Changing
Dashboard Gadgets and Preferences.
- Renaming the gadget. You
can change the default title of a gadget and rename it by going
to the Dashboard Designer and clicking the title bar of the gadget. Enter
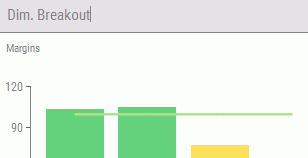
the new title, as shown in the following image.

Procedure: How to Search the Gadget Catalog
There is a built-in search capability in the Gadget Catalog, which makes it easier to find specific gadgets for your dashboard.
To search for a gadget:
- In the Dashboard Designer, click Gadgets.
- Click the more icon
 .
.The Gadgets panel button expands, as shown in the following image.

- In the search field,
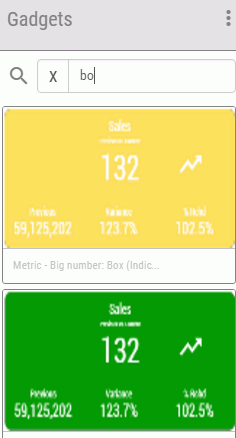
enter the first few letters of the gadget type, as shown
in the following image.

- Select the desired gadget from the list that appears.
To clear the search and show all available gadgets, delete the search term in the field.
Editing a Gadget
|
How to: |
Gadgets can be edited directly from the catalog in the Dashboard Designer. Gadgets that are edited and configured from the catalog are immediately available to use in dashboard designs.
Procedure: How to Editing a Gadget From Inside the Catalog
From the Dashboard Designer:
- Click Gadgets.
- Click the Edit Gadget icon
 next to a gadget in the catalog.
The Edit Gadget Designer panel opens, as shown in the following image.

- Complete the fields in the Edit Gadget Designer panel, as described in the following table.
Field
Description
Name
Type the name of the gadget.
Scorecard filters
Specify whether the current scorecard filters should be used.
Preview image
Shows the preview image of the gadget.
Receive Broadcasts
Select to enable the broadcast feature for the gadget.
Enable Moonbeam
Select to enable the moonbeam feature.
Content Type
Select which type of content will be added as the gadget.
Content Display
Select which type of content will be displayed.
Aggregation at Level
Select the appropriate level of the dimension at which data will be aggregated.
Reset Dashboard defaults
Select to reset Dashboard default values.
Description
Type a description of the gadget.
Custom Parameters
Allows you to pass WebFOCUS parameters to your gadget.
Display
Select from the following Display elements, to include in the gadget being created.
- Actual
- Benchmark
- Forecast
- Stretch Target
- Target
Groupings
Select up to three Groupings elements to include in the gadget being created. Use the drop-down menu next to each element to select Required or Optional.
The following options are available:
- Perspective
- Theme
- Objective
- Measure
- Project
- User Specified Dimension
- Time
Filters
Select up to three Filters elements to include in the gadget being created. Use the drop-down menu next to each element to select Required or Optional.
The following options are available:
- Perspective
- Theme
- Objective
- Measures
- Projects
- User Specified Dimension
- Time
- Scorecard
- Red and Yellow indicators only
- Red indicators only
- After you have entered your data in the fields of the Edit Gadget Designer panel, click Save.
Resetting Dashboard User Preferences
|
How to: |
Dashboard user preferences can be reset to the default preferences in the original dashboard design.
The dashboard preferences control settings a user sees, such as metrics and dimensional filters. Preferences are stored for each of the following:
- User
- Dashboard
- Scorecard
Default preferences are stored for each dashboard in the system. These preferences are set during the dashboard design process in the Dashboard Designer.
Users can override preferences set for a dashboard by saving their changes in the Preference panel in the dashboard.
User preferences can be reset from many areas within PMF. Where the reset is performed determines the scope of where those preferences are overridden.
Procedure: How to Reset Dashboard Preferences From the Dashboard Designer
While working with Dashboards, any preferences that are changed from within the Dashboard Designer changes the default preferences for that dashboard, as well as each scorecard that can be selected and configured.
If
a user has administrator rights in a dashboard, they have the
ability to clear user preferences for any of their dashboard designs and restore the dashboard back to the default values
that were designated by the Designer. Dashboard preferences can easily be reset by clicking the Reset dashboard icon ![]() .
.
The Reset Dashboard icon is located on the toolbar of the drawer on the Today page, as seen in the following image.
You can also access the toolbar with this icon by clicking the Edit Dashboard icon ![]() to enter the Dashboard Designer.
to enter the Dashboard Designer.


 on the tracking menu. The gadget view will change, as shown in the
following image.

 in the title bar.