App Studio is a Windows-based GUI development environment
for creating WebFOCUS applications. App Studio provides innovative
features and functions that simplify development, thereby allowing
you to concentrate on interface design, business logic, and data
manipulation. Features include data visualization, color exception
reporting, intelligent drill downs, and the ability to generate HTML
pages without writing code.
xAuthenticating Through a Local PIV (Personal Identity Verification)
You can now authenticate App Studio users through a local PIV
(Personal Identity Verification) PKI (Public Key Infrastructure)
certificate.
PIV was created for use by U.S. federal agencies as a secure
and interoperable credential for user authentication. PKI is a
protocol for managing, distributing, and revoking digital certificates
for public-key encryption.
xSupport for WebFOCUS Environments Using SAML or CAS
As of Release 8.1 Version 05M, App Studio offers support
for the following new single sign on (SSO) providers, when developing
against WebFOCUS environments that are configured to use these providers
for pre-authentication:
- Security Assertion Markup Language (SAML)
- Central Authentication Service (CAS)
Both SAML and CAS options are now available from the list of
supported authentication providers in the WebFOCUS Environments
Properties dialog box, which is shown in the following image.

x
Procedure: How to Configure a WebFOCUS Environment Using SAML or CAS
-
On the Home tab, in the Utilities group,
click Environments.
The Environments list dialog box opens.
-
Click Add.
The WebFOCUS Environment Properties dialog box opens.
-
Complete the Description fields and the appropriate fields
in the Web Component area, including the Host Name, Protocol, Port
and HTML Alias fields that are used by WebFOCUS.
-
On the Web Component Authentication area, click the drop-down
menu, and then click SAML or CAS.
-
Click OK to continue.
A Web Logon form opens, as shown in the following image.

-
Type the appropriate Username and Password and click
Login to validate the connection information.
If the connection is successful, a message similar to the
following image appears.

Note: If
the connection is not successful, click Cancel,
and ensure that you are connecting to a properly configured WebFOCUS
environment that uses SAML or CAS.
-
Click Done to proceed and save settings.
-
In the WebFOCUS Environments Properties dialog box, click OK.
The new WebFOCUS environment appears in the Environments
Tree panel.
During
configuration of the environment, if you are using HTTPS and certificates
are self-signed, you are prompted with confirmation messages that
need to be accepted to proceed.
Note:
- When using Chrome or Firefox as the output viewer, WebFOCUS
needs to be configured to allow multiple simultaneous sign ins per
user, which is the default configuration. Additionally, you will
be prompted to sign in when running a request. If you close the
browser window, you will be prompted to sign in the next time you
run a request.
- When you sign in to an environment, your connection is in effect
for the duration of the App Studio session. If you sign out from
an environment, you will not terminate the session connection.
- When using SAML or CAS providers, sign-in credentials cannot
be saved in the Environment Properties dialog box. You will be prompted
to login each time you access the environment in a new App Studio session.
xResponsive Design Framework Add-on
You can now benefit
from the flexibility of responsive web design by using the Responsive Design
Framework Add-on (RDF Add-on) for WebFOCUS App Studio. The RDF
Add-on makes it easy for you to create responsive content that automatically
adapts for display on different window sizes and devices. You are
not required to know JavaScript or CSS in order to use the RDF Add-on.
If you are familiar with JavaScript and CSS, you can leverage
the RDF Add-on using the grid CSS file and a theme CSS file to further
control the responsiveness and the look and feel of content created
using the add-on.
The RDF Add-on includes 26 App Studio compatible templates that
you can use to quickly assemble responsive dashboards or responsive
InfoApps.
For more information, see Getting Started with the
Responsive Design Framework Add-on for WebFOCUS App Studio.
xForecast Conditional Formatting
You can now create
conditional formatting and data visualizations for forecast data.
This makes it easy to distinguish between actual and forecast values
in a column.
Use the new Forecast selection from the Traffic Lights drop-down
to create Forecast conditional formatting, as shown in the following
image. You can also use this to preview Forecast formatting when
the report is open in the Report canvas.
Use the new Data Visualization Conditional Styling dialog box
to set visualizations for forecasts, as shown in the following image.
xUsing the Autosize Children Option
The Autosize Children
option resizes all components on an HTML page to automatically fit the
maximum available screen space on any monitor or device where it
might be viewed. For example, a single component will take up one
hundred percent of the available space, while two components will
take up fifty percent each.
This option is used so that when your HTML page is run on different
devices, components and controls do not appear off the screen and
have to be scrolled to in order to use them. To accommodate this,
the orientation of components may be different on different devices.
For example, a report and chart that appear side-by-side when run
on a desktop monitor, may appear stacked one above the other when
run on a tablet.
You can prevent the component from becoming too small, using
the Autosize: min width and Autosize: min height options. Type the
minimum number of pixels for the width, height, or both, in the
appropriate fields. When a component reaches the minimum width or height
that you specified, a scroll bar appears and the size of the component
does not decrease further.
The following image shows a report component and a chart component
on the HTML canvas where Autosize children is enabled. Both components
share the available space equally.
For more information, see the App Studio Online Help.
xCalling a Procedure From Another Procedure Using Execute
The Execute component
allows one procedure to execute or call another procedure. The called
procedure behaves as a completely separate procedure, with its own
context. The Execute component allows you to view and select available
procedures, supply values for parameters in the called procedure,
and test the called procedure.
Once this procedure is specified, Execute displays these parameters
and prompts you to provide values for them. You can provide values
for all parameters in the procedure, or you can choose to provide
values for only some of the parameters. If you provide values for only
some of the parameters, you must provide values for the other parameters
using another method. For example, values are passed from another
part of the application. After providing parameter values, you can
test the called procedure. Execute is available from all development
areas of the product.
You can add the Execute component to a procedure from the Procedure
View panel. Right-click the component that you want to create the
Execute component after, point to New, and
then click Execute, as shown in the following
image.
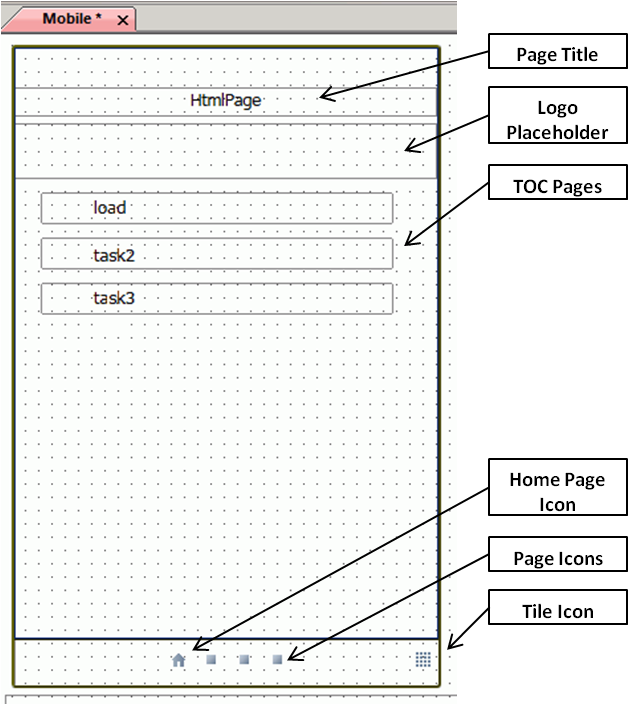
xDesigning Content for Smartphones in the HTML Canvas
You can design
content specifically to be used on smartphones, in the App Studio
HTML canvas, using the new mobile layout options and enhancements.
Content designed in this way is automatically sized, and takes full
advantage of the page-swipe navigation and touch-screen capabilities
of smartphones.
There are two different layouts for designing HTML output for
smartphones, Basic and Advanced.
Basic Mobile Layout. Enables you to build simple smartphone
pages that you can navigate using graphical icons and page-swipe.
The Basic Mobile Layout displays individual frames from your HTML
canvas on individual mobile pages, by default. You can change this
as needed.
Advanced Mobile Layout. Offers the same features as the
Basic, but also gives you the additional ability to add a table
of contents with or without a logo, and add a logo on each page.
You can use the options that are available with these two layouts
to modify and view your mobile layout. In addition, you can switch
between the two layouts to determine which design fits your application
requirements. Both layouts can be applied to new or existing HTML
pages.
For more information, see the App Studio Online Help.
xSaving Control Selections in a Browser Session
When working with controls on HTML pages, you can link the controls
so that they automatically default to the same selected value when
you switch between multiple pages in the same browser session. To
link the controls, you need to assign a common value to the Global
name property for each control that you want to link,
as this field enables you to save control selections within a browser
session.
This functionality enables you to link controls based on commonality.
For example, you may have two HTML pages that contain controls with
information that relates to regional sales. You can assign a value
to the Global name property, such as Region,
to each of the controls that you want to link. When you run those
pages in the same browser session, and choose a value from one of
the linked controls, such as Southeast, the
controls on the other pages will refresh and display the information
for the Southeast, by default.
When you select a control on an HTML page, you can access the Global name field
in the Properties panel, under Miscellaneous. Once you have defined values
for the Global name property for the controls
that you want to link, save the HTML page.
Note: A selected value is retained as the default only
during a single browser session. The value is not retained after
you close the browser.
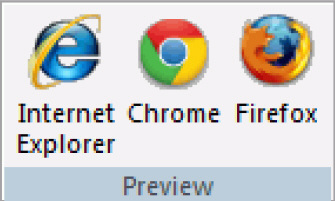
xPreviewing HTML Output Across Different Browsers
You can now preview your HTML output in different browsers using
the icons that are available in the Preview group on the Utilities
tab. This allows you to review how your output will display across
different browsers, and verify that your content displays correctly.
The Preview group contains browser icons based on those that
you have installed locally. For example, if you do not have a local
installation of Firefox, the Firefox browser icon is unavailable
(grayed out) in the Preview group.
Easy access to the three standard browsers (Internet Explorer,
Chrome, and Firefox) makes it easy to compare the display of your
HTML output, as shown in the following image.
x
With Precision reports, you can create perfectly aligned PDF,
PS, and DHTML output for a pre-printed form, such as a Bill of Sale.
Precision reports offer all of the benefits of the Report canvas,
as well as access to specific tools for controlling items on a form,
including fields, images, and other objects required by the form.
It also offers additional tools and tabs that enable you to precisely
match the format of your pre-printed form.
Precision reports are created in the Precision Report canvas
by using the Data Matrix layer as the reporting object, and by inserting
objects in the other layers as fields. You can then build the layout
of the form, and add headings or footings to it, including embedded fields.
You can access the Precision Report canvas by converting an existing
report or by creating a new Precision report. The report displays
on the Precision Report canvas, as shown in the following image.
xAnalyzing Procedures Using Impact Analysis
Impact Analysis enables you to generate a list that identifies
the procedures that access a specific Master File or a single field
within a Master File. This allows you to analyze the potential impact
of modifying or deleting Master Files or fields and enables you
to analyze data, control search criteria, save reports, and interactively
open and edit procedures based on search results.
Impact Analysis searches Business Views in addition to WebFOCUS
procedures. This enables you to see if changes in the original Master
File will impact fields used in the Business View.
Impact Analysis is accessible from the Content and Data Servers
development areas of the Configured Environments tree.
xShort Last Modified Date Format
A new option, Use short Last Modified date format, is
selected in the App Studio Options dialog box, by default, as shown
in the following image.
This option displays the last modified date information for a
file or folder, in a short format, mm/dd/yyyy hh:mm AM/PM.
This date information is available in the Open File dialog box and
the Environments Detail panel, as shown in the following image.
x
Visualizations centralize information by providing different
views of data that are pertinent to a particular objective. For
example, reviewing trends or fluctuations in data over a period
of time or within a region. A visualization provides you with a
quick glance of information on a single screen. Visualizations support
the use of different types of charts, maps, and grids. For example,
you may want to use a bar, pie, and line chart to show different
views of the same data. Alternatively, you may want to offset a
particular visual by showing other types of related data that employ
a different type of visual. You can also add a text cell to your
visualization to provide explanatory text or information that other
users can reference. Visualizations allow you to monitor changes
in data. They also serve to provide information in real-time, based
on changes in underlying data or other components. A visualization
can be updated, changed, or revised at any time to account for shifts
in data needs.
To access the online Help for visualizations, click the InfoDiscovery Help icon  , located in the upper-right corner
of the InfoDiscovery Workbench.
, located in the upper-right corner
of the InfoDiscovery Workbench.
x
Procedure: How to Create a New Visualization
-
From the Content node in the Environments
Tree panel or Environments Detail panel, right-click a folder, point
to New, and click Visualization.
-
Select a Master File from the list and click Open.
The WebFOCUS InfoDiscovery Workbench opens, as shown in
the following image, where you can create charts, maps, and grids
to visually represent your data.
x
You can now authenticate App Studio users through a
local PIV (Personal Identity Verification) PKI (Public Key Infrastructure)
certificate.
PIV was created for use by U.S. federal agencies as a secure
and interoperable credential for user authentication. PKI is a
protocol for managing, distributing, and revoking digital certificates
for public-key encryption.