How to: Reference: |
You can set the color of most graph objects. A color can be defined as rgb values or hex values that specify the intensities of the red, green, and blue components of the color. For some objects, such as rectangular series risers and chart backgrounds, you can also define a transparency value for the fill color.
setobjectColor(new Color(newValue));
where:
- setobjectColor
Is the API call to set the color for the specified object.
- newValue
Is the default color value in one of the following formats:
r, g, b is the desired intensity of red, green, and blue, respectively. The values are on a scale of 0 to 255, where 0 is the least intense and 255 is the most intense.
r, g, b, t is the desired intensity of red, green, and blue, respectively, and a transparency value. The values are on a scale of 0 to 255, where 0 is the least intense and 255 is the most intense. For transparency, 0 is fully transparent and 255 is fully opaque.
#hexcolor is the hexadecimal color code, preceded by a pound sign (#). The hexadecimal color value has two hexadecimal digits each for the combination of red, green, and blue color values (RGB). The lowest value for each component is 0 (hex 00). The highest value is 255 (hex FF).
For example, black is #000000, which corresponds to rgb(0,0,0) . Red is #FF0000, which corresponds to rgb(255,0,0). White is #FFFFFF, which corresponds to rgb(255,255,255).
The following request sets the chart frame fill color to aqua (rgb 0,255,255):
GRAPH FILE WF_RETAIL_LITE
SUM COGS_US REVENUE_US GROSS_PROFIT_US
BY PRODUCT_CATEGORY
ON GRAPH PCHOLD FORMAT PNG
ON GRAPH SET LOOKGRAPH VBAR
ON GRAPH SET STYLE *
*GRAPH_SCRIPT
 setFillColor(getFrame(),new Color(0,255,255));
setPlace(true);
*END
 ENDSTYLE
 END
The output is:
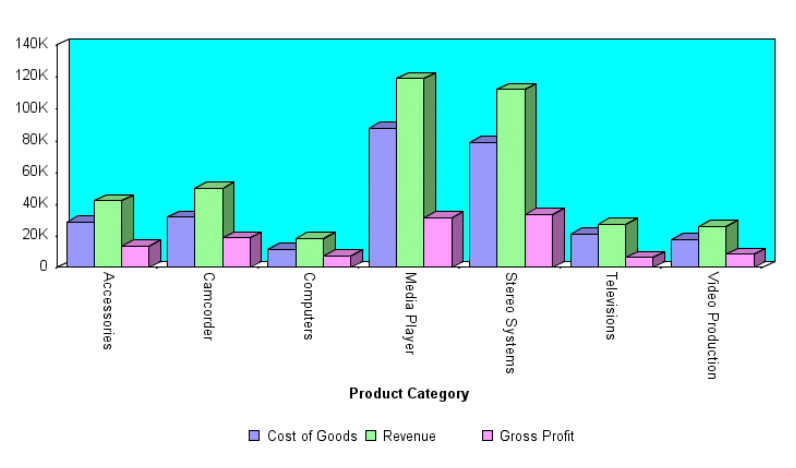
To express the color as a hex value, the equivalent API call is:
setFillColor(getFrame(),new Color(#00FFFF));
Color transparency support is limited and only applies to transparent rectangular regions (so, for example, it is not supported for pie slices). In addition:
- Transparent background fill colors are supported only when the background color is transparent. The border color of the background should also be transparent, if you are going to use a transparent fill color for the background.
- Transparency is only supported for PNG or GIF chart formats.
- Transparent colors are supported in 2D charts, but not in 2.5D or 3D charts. In some cases, they may be usable in 2.5D charts but are not officially supported.
- Transparent colors are useful for alternate format regions, to have grid lines show up more clearly.
The following request sets the series 0 (cost of goods) fill color to fully transparent (transparency 0):
GRAPH FILE WF_RETAIL_LITE
SUM COGS_US REVENUE_US GROSS_PROFIT_US
BY PRODUCT_CATEGORY
ON GRAPH PCHOLD FORMAT PNG
ON GRAPH SET LOOKGRAPH VBAR
ON GRAPH SET STYLE *
*GRAPH_SCRIPT
setFillColor(getSeries(0),new Color(192,192,192,0));
setPlace(true);
*END
 ENDSTYLE
 END
The output is:
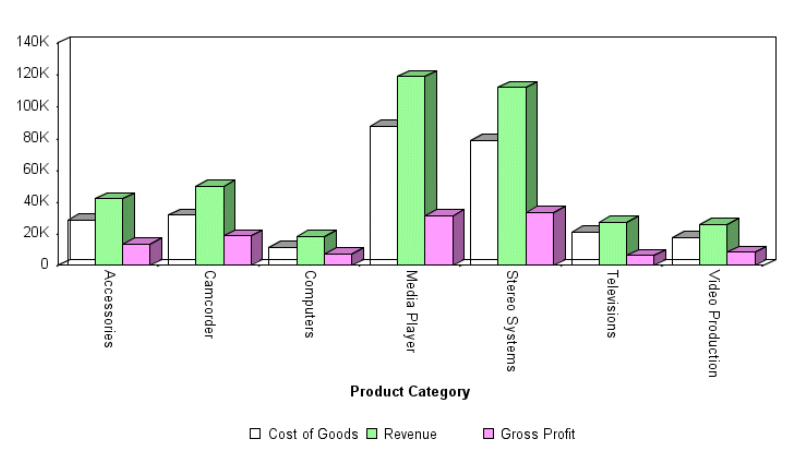
Changing the transparency value to 255 makes the fill totally opaque:
setFillColor(getSeries(0),new Color(192,192,192,255));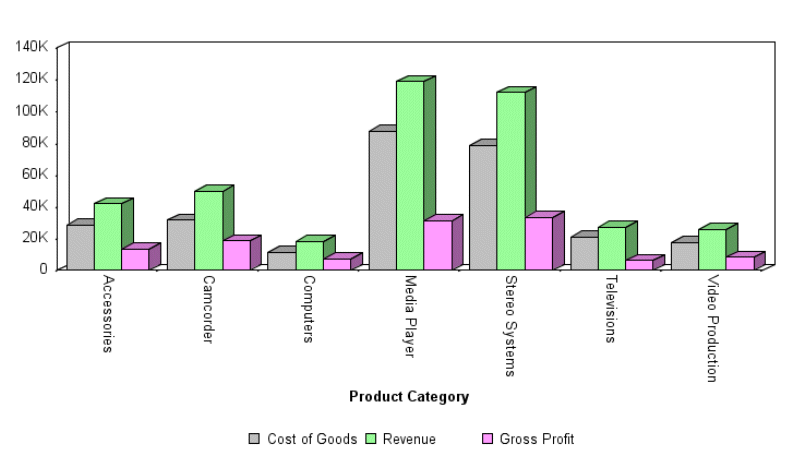
Changing the transparency value to 100 makes the fill partially transparent:
setFillColor(getSeries(0),new Color(192,192,192,100));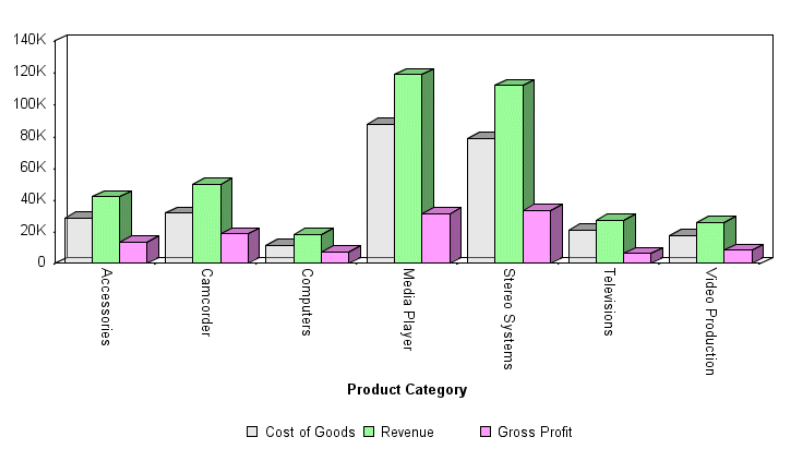
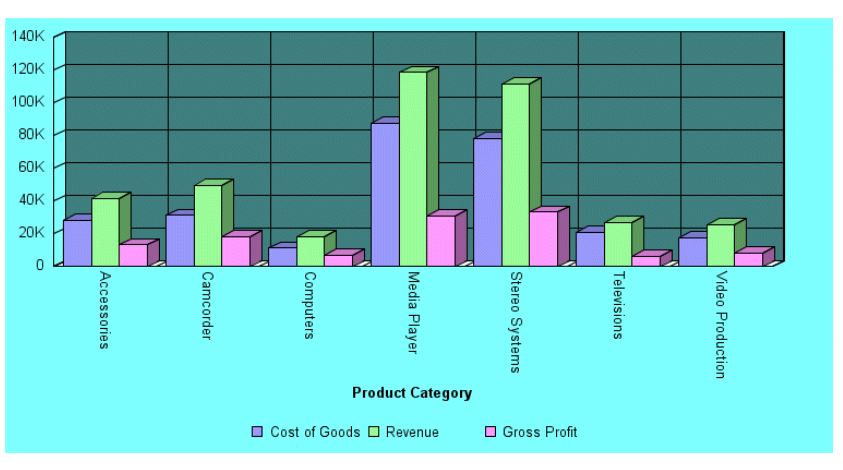
The following request makes the chart frame black with a transparency value of 128, makes the chart background aqua with a transparency value of 128, and uses the transparent fill color for the frame side:
GRAPH FILE WF_RETAIL_LITE
SUM COGS_US REVENUE_US GROSS_PROFIT_US
BY PRODUCT_CATEGORY
ON GRAPH PCHOLD FORMAT PNG
ON GRAPH SET LOOKGRAPH VBAR
ON GRAPH SET STYLE *
*GRAPH_SCRIPT
  setFillColor(getFrame(),new Color(0,0,0,128));
  setFillColor(getChartBackground(),new Color(0,255,255,128));
  setTransparentFillColor(getFrameSide(),true);
setO1AxisLineDisplay(true);
setO1MajorGridDisplay(true);
setO1MajorGridStyle(0);
setY1AxisLineDisplay(true);
setY1MajorGridDisplay(true);
setY1MajorGridStyle(0);
setPlace(true);
*END
 ENDSTYLE
 END
The output is:
