[TYPE=REPORT,] ... PAGECOLOR={colorcolor|RGB(r g b)|RGB(#hexcolor)},$where:
- TYPE=REPORT
Is optional. If omitted, TYPE defaults to REPORT.
- color
Is a supported color. For a list of supported colors see the Creating Reports With WebFOCUS Language manual.
- RGB{r g b)
Specifies the font color using a mixture of red, green, and blue.
(r g b) is the desired intensity of red, green, and blue, respectively. The values are on a scale of 0 to 255, where 0 is the least intense and 255 is the most intense. Note that using the three color components in equal intensities results in shades of gray.
- RGB(#hexcolor)
Is the hexadecimal value for the color. For example, FF0000 is the hexadecimal value for red. The hexadecimal digits can be in upper or lower case and must be preceded by a pound sign (#).
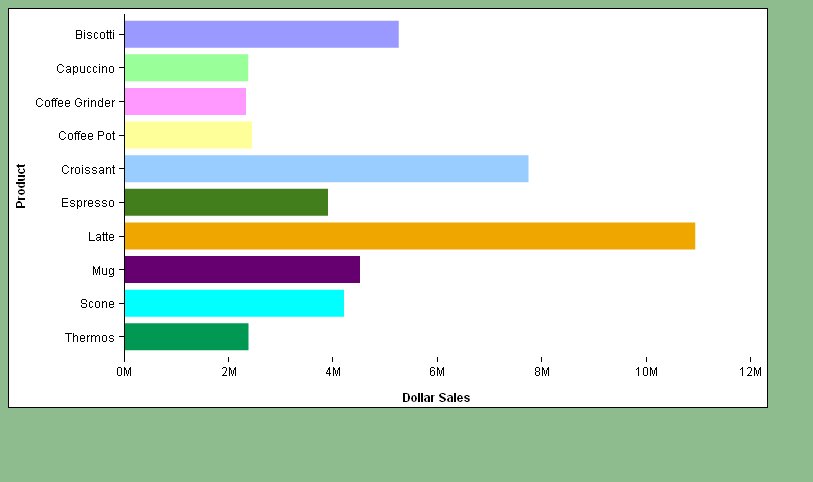
The following request against the GGSALES data source sets the color of the page to pale green.
GRAPH FILE GGSALES
SUM DOLLARS
BY PRODUCT
ON GRAPH PCHOLD FORMAT JSCHART
ON GRAPH SET STYLE *
PAGECOLOR=PALE GREEN,$
END
The resulting chart is surrounded by a pale green HTML page: