Syntax: How to Control the Appearance of a Bullet Chart
bulletProperties: {
   drawFirstValueAsBar: boolean},
where:
- drawFirstValueAsBar: boolean
Valid values are:
- true, which draws the first data value as a bar. This is the default value.
- false, which draws the first data value as a marker.
Example: Controlling the Appearance of a Bullet Chart
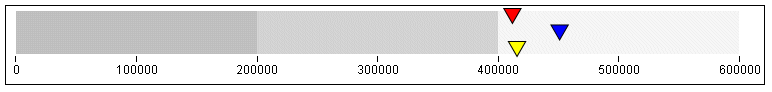
The following request creates a bullet chart using the default value (true) for the drawFirstValueAsBar property
GRAPH FILE WF_RETAIL_LITE
SUM COGS_US
BY TIME_DAYNAME
WHERE TIME_DAYNAME EQ 'FRI' OR 'SAT' OR 'SUN'
ON GRAPH PCHOLD FORMAT JSCHART
ON GRAPH SET VAXIS 80
ON GRAPH SET LOOKGRAPH CUSTOM
ON GRAPH SET STYLE *
*GRAPH_JS
chartType: 'bullet',
bulletProperties:
   {drawFirstValueAsBar: true},
yaxis: {
   colorBands: [
     {start: 0,stop: 200000,color: 'silver'},
     {start: 200000,stop: 400000,color: 'lightgrey'},
     {start: 400000,stop: 600000,color: 'whitesmoke'}
       ],
},
series: [
{series: 'all', showDataValues: false},
{series: 0, group: 0, color: 'yellow',
  marker: {size: 15, position: 'bottom'}},
{series: 0, group: 1, color: 'red',
  marker: {size: 15, position: 'top'}},
{series: 0, group: 2, color: 'blue',
  marker: {size: 15, position: 'middle'}}
]
*END
ENDSTYLE
END
On the chart, the first data value is represented by a yellow bar, and the other data values are represented by red and blue triangles:
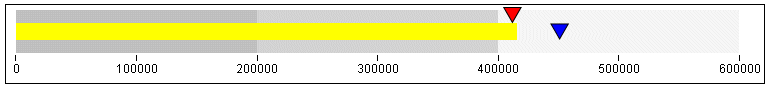
Changing the value of drawFirstValueAsBar to false generates a chart on which the yellow marker is now a triangle: