axisname: {
  swapChartSide: boolean  }
where:
- axisname
Can be:
- xaxis
- xaxisOrdinal (deprecated, use xaxis)
- xaxisNumeric (deprecated, use xaxis)
- yaxis
- swapChartSide: boolean
Can be:
- true, which swaps axis label and body line locations.
- false, which uses the default axis locations. This is the default value.
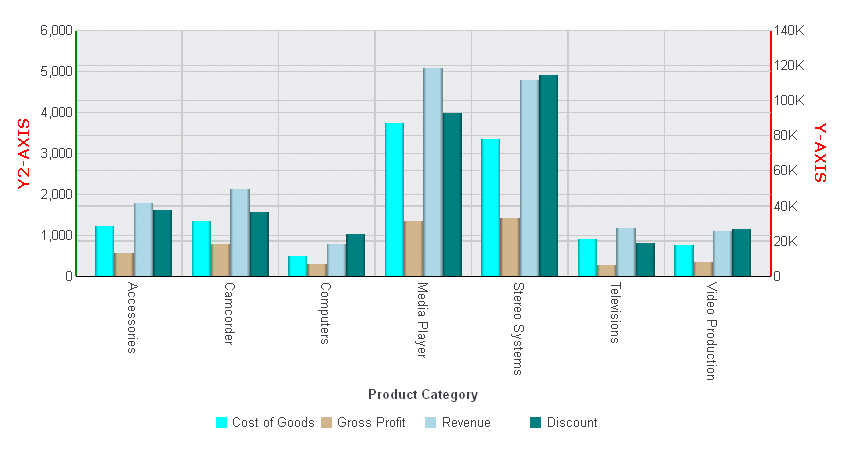
The following request assigns series 3 to the y2-axis and swaps the y2-axis with the y-axis:
GRAPH FILE WF_RETAIL_LITE
SUM COGS_US GROSS_PROFIT_US REVENUE_US DISCOUNT_US
ACROSS PRODUCT_CATEGORY
ON GRAPH PCHOLD FORMAT JSCHART
ON GRAPH SET LOOKGRAPH VBAR
ON GRAPH SET STYLE *
INCLUDE=IBFS:/FILE/IBI_HTML_DIR/javaassist/intl/EN/ENIADefault_combine.sty,$
*GRAPH_JS
yaxis: {title: {visible: true, color: 'red',
  font: 'bold 10pt Verdana',text: 'Y-AXIS'},
  bodyLineStyle: {width: 2, color: 'red'},
  swapChartSide: true},
y2axis: {title: {visible: true, color: 'red',
  font: 'bold 10pt Verdana',text: 'Y2-AXIS'},
  bodyLineStyle: {width: 2, color: 'green'}},
series: [
  {series: 0, color: 'cyan'},
  {series: 1, color: 'tan'},
  {series: 2, color: 'lightblue'},
  {series: 3, color: 'teal', yAxisAssignment: 2}]
*END
ENDSTYLE
END
On the output, the y-axis has been moved to the right side of the chart, and the y2-axis is on the left:

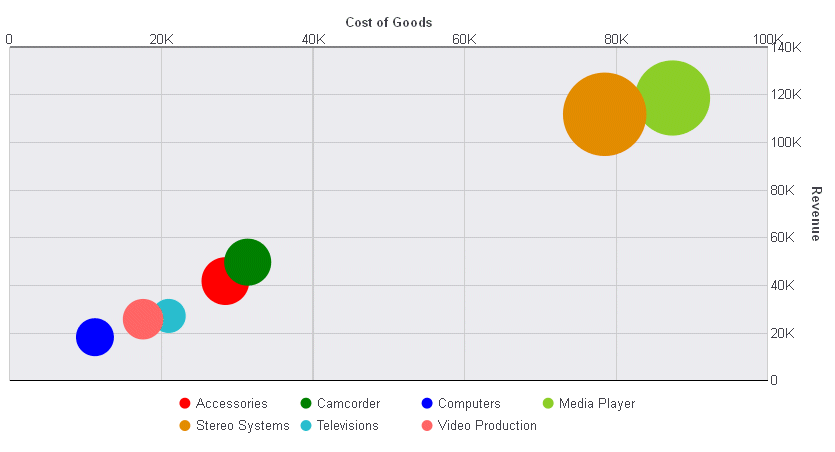
The following request generates a bubble chart with the y-axis on the right, and the x-axis on the top:
GRAPH FILE WF_RETAIL_LITE
SUM COGS_US REVENUE_US DISCOUNT_US
BY PRODUCT_CATEGORY
ON GRAPH PCHOLD FORMAT JSCHART
ON GRAPH SET LOOKGRAPH BUBBLE
ON GRAPH SET STYLE *
INCLUDE=IBFS:/FILE/IBI_HTML_DIR/javaassist/intl/EN/ENIADefault_combine.sty,$
*GRAPH_JS
yaxis: {swapChartSide: true},
xaxis: {swapChartSide: true},
series: [
    {series: 'all', marker: {shape: 'circle'}},
    {series: 0, color: 'red'},
    {series: 1, color: 'green'},
    {series: 2,  color: 'blue'}
]
*END
ENDSTYLE
END
The output is:
