Syntax: How to Fill Alternate Segments of Axis Grid Lines With a Specified Color
axisname:
{
  altFrameColor: color},
where:
- axisname
Can be:
- xaxis
- xaxisOrdinal (deprecated, use xaxis)
- xaxisNumeric (deprecated, use xaxis)
- yaxis
- y2axis
- zaxis
- zaxisOrdinal (deprecated, use zaxis)
- altFrameColor: color
Can be:
- A color defined by a color name or numeric specification string, or a gradient defined by a string.
- A JSON gradient definition.
For information about defining colors and gradients, see Colors and Gradients.
Example: Filling Alternate Segments of Axis Grid Lines With a Specified Color
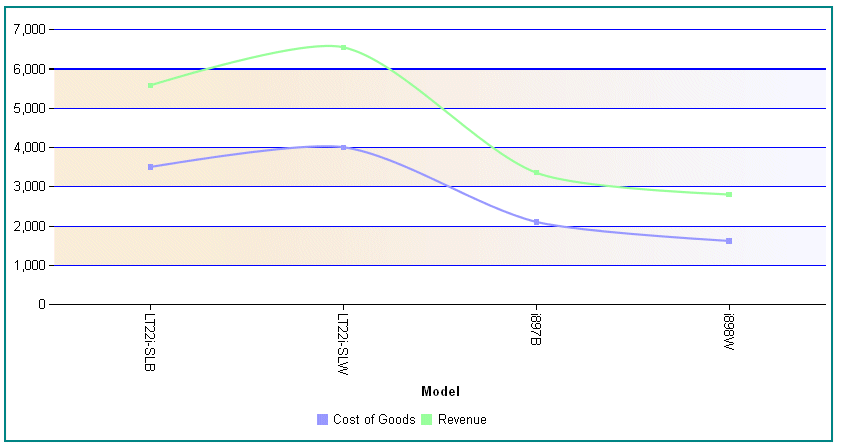
The following request against the WF_RETAIL_LITE data source generates a vertical line chart in which the sections between the yaxis major grid lines alternate between being transparent and having a gradient fill that transitions from antique white to ghost white:
Note: Applying a gradient fill to the altFrameColor property may cause the chart to not run properly in the Chart canvas or other user interface. However, the procedure can still be run directly from the text editor.
GRAPH FILE WF_RETAIL_LITE
SUM COGS_US REVENUE_US
BY MODEL
WHERE PRODUCT_CATEGORY EQ 'Computers'
ON GRAPH PCHOLD FORMAT JSCHART
ON GRAPH SET LOOKGRAPH VLINE
ON GRAPH SET STYLE *
*GRAPH_JS
border: {width: 2, color: 'teal'},
blaProperties: {lineConnection: 'curved'},
yaxis: {altFrameColor:
'linear-gradient(0%,0%,100%,0%, 20% antiquewhite, 95% ghostwhite)',
  majorGrid: {visible:true,
  lineStyle: {width: 1,color: 'blue'}}
}
*END
ENDSTYLE
END
The output is:
