formatCallback: function(d,s,g, dataset){return expression;}
where:
- d
Is the data value argument. It is an object with properties that tell which type of data to return. The type of data returned (for example, the x-value or the y-value) is called the data mode and is dependent on the type of chart being generated.
In the expression to be returned by the function, if you are returning data values, you must specify which data mode to return. For example, to return the x-value, specify d.x in the expression.
The following table lists the data modes that can be used for each chart type. Note that any chart types not listed have default modes. These may include value, size, and color:
Chart Type
Data Modes
Boxplot
min, lower, median, upper, max
Polar
phi, r, size, color
Bubble
x, y, size
Scatter
x, y
Treemap
size, color
Control
value, sampleSize
Map
name, value (used when there are two arguments)
or
lng, lat, color (used when there are three arguments)
- s
Is the argument that returns the series number.
- g
Is the argument that returns the group number.
- dataset
Is the set of data for the series for this point. For some chart types, it can be the entire data set, and for others it is undefined. It is mostly useful for calculating the data series sum for stacked bars and pies.
- expression
Is an expression supported in a JavaScript function.
In addition to the arguments passed into the function, you can insert text and HTML tags into the expression, enclosed in single quotation marks ('). You can also use other objects, properties, operators, and functions supported in JavaScript functions.
Each component in the return value is separated from the next component by a plus sign (+). The expression must be terminated with a semicolon (;).
In addition, you can declare new variables and use any CSS style in a callback function. You can also retrieve the properties of any object passed as a parameter. For example, to retrieve the color property of series 0, when the series argument is called s, you can use the following:
'series': 0, color: 'green',
              tooltip: function(d,s,g){
                       var c = this.getSeries(s).color;
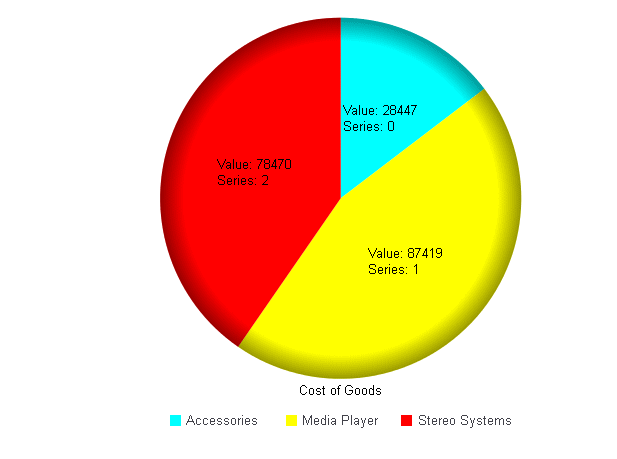
The following request generates a pie chart and shows the data labels. The labels are returned by a callback function which has two arguments, a (data) and b(series). In addition to returning the data value (a.value), the function returns text, which describes what is being displayed. It also includes an HTML line-break tag (<br>) to make the label display on two lines:
GRAPH FILE WF_RETAIL_LITE
SUM COGS_US
ACROSS PRODUCT_CATEGORY
WHERE PRODUCT_CATEGORY EQ 'Accessories' OR 'Stereo Systems'
  OR 'Media Player'
ON GRAPH PCHOLD FORMAT JSCHART
ON GRAPH SET LOOKGRAPH PIE
ON GRAPH SET STYLE *
INCLUDE=IBFS:/FILE/IBI_HTML_DIR/javaassist/intl/EN/ENIADefault_combine.sty,$
*GRAPH_JS
series: [{series:'all', showDataValues:true},
{series: 0, color: 'cyan', showDataValues:true},
   {series: 1, color: 'yellow', showDataValues:true},
   {series: 2, color: 'red', showDataValues:true}
   ],
dataLabels: {
  visible: true,
  position: 'middle',
  formatCallback: function(a,b){return 'Value: ' + a.value +
    '<br>Series: ' + b  ;}
    }
*END
ENDSTYLE
END
The output is:
The following request generates a stacked bar chart with two series. The tooltip for each series is returned by a callback function.
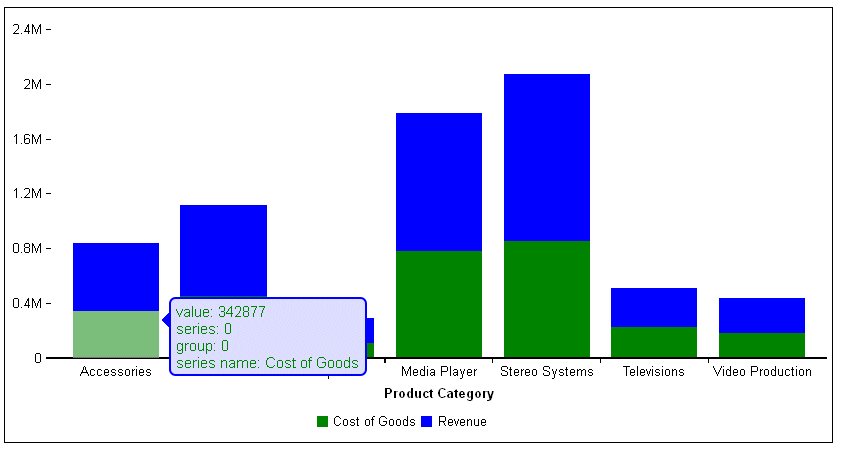
The callback function for series 0 retrieves the color and label for series 0 and returns those properties, using the series color as the text color for the tooltip. The <span object is a CSS style that formats the return values from the callback function, The backslash (\) in front of the double quotation mark (“) is an escape character that causes the callback function to return the double quotation mark instead of using it as a special character. The tooltip contains breaks (<br/>) to generate multiple lines:
 series: [
 {'series': 0, color: 'green',
   tooltip: function(d,s,g){
   var c = this.getSeries(s).color;
   var lbl = this.getSeries(s).label;
   return '<span style=\"color: ' + c + '\">value: ' + d + '<br />series: ' + s + '<br />group: ' + g + '<br />series name: ' + lbl +'</span>'; }
     }
The callback function for series 1 retrieves the color and label from series 1. It also retrieves the data values from both series and adds them together to get a total value:
{'series': 1, color: 'blue',
tooltip: function(d,s,g){
var c = this.getSeries(s).color;
var lbl = this.getSeries(s).label;
var total =this.data[0][g].value +
this.data[1][g].value;
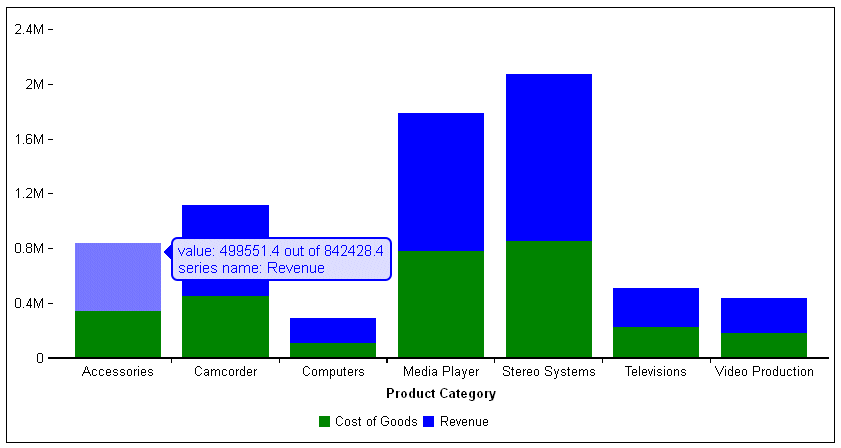
return '<span style=\"color: ' + c + '\">value: ' + d + ' out of ' + total + '<br />series name: ' + lbl +'</span>';}
}The tooltip is visualized as an HTML tooltip with a blue border and a lighter blue (#DDDDFF) fill color.
Note: The return values are enclosed in single quotation marks. Although the string may break onto separate lines on the page in this manual, it must be all on one line in the request. Therefore, in order to run the example, you must remove the breaks in the return values.
The request follows:
GRAPH FILE WF_RETAIL_LITE
SUM COGS_US REVENUE_US
BY PRODUCT_CATEGORY
ON GRAPH PCHOLD FORMAT JSCHART
ON GRAPH SET LOOKGRAPH VBRSTK1
ON GRAPH SET STYLE *
*GRAPH_JS
series: [
 {'series': 0, color: 'green',
   tooltip: function(d,s,g){
     var c = this.getSeries(s).color;
     var lbl = this.getSeries(s).label;
      return '<span style=\"color: ' + c + '\">value: ' + d + '<br />series: ' + s + '<br />group: ' + g + '<br />series name: ' + lbl +'</span>'; }
     },
 {'series': 1, color: 'blue',
   tooltip: function(d,s,g){
    var c = this.getSeries(s).color;
    var lbl = this.getSeries(s).label;
    var total =this.data[0][g].value +  this.data[1][g].value;
    return '<span style=\"color: ' + c + '\">value: ' + d + ' out of  ' +
    total +
    '<br />series name: ' + lbl +'</span>';}
     }
    ],
htmlToolTip: {
    snap: true,
    fill:  '#DDDDFF',
    border: { color: 'blue'}
          }
END
The following image shows a tooltip for series 0:
The following image shows a tooltip for series 1: