referenceLines: [
   {
   value: number,
   axis: 'string',
   line: {
      color: 'string',
      width: number,
      dash: 'string'
   },
   label: {
      text: 'string',
      font: 'string',
      color: 'string'
   },
   anchor: 'string',
   showValue: boolean   }
]
where:
- value: number
Is a number or string that defines where on the axis to draw the line.
- For a numeric axis, the number must be a value that is visible on the axis, and a string must represent a percentage between '0%' and '100%'.
- For the ordinal axis, a string must be a group label that is visible on the axis, and a number must be between 0 and 1 (for example, .5 will draw the reference line in the center of the chart).
- axis: 'string'
Is a string that defines the axis on which to draw the line: 'x', 'y', 'y2', or undefined (do not draw line).
- line:
Defines the properties of the reference line.
- color: 'string'
Is a color defined by a color name or numeric specification string that defines the color of the line. The default is 'black'.
- width: number
Is a number that defines the width of the line in pixels. The default is 1.
- dash: 'string'
Is a string that defines the dash style of the line. Use a string of numbers that defines the width of a dash followed by the width of the gap between dashes (for example, dash: '1 1' draws a dotted line). Use '' for a solid line.
- label:
Defines the properties of the reference line label.
- text: 'string'
Is an optional string that defines the label to draw beside a reference line. Use '', or undefined Empty string, or undefined, to draw no label.
- font: 'string'
Is a string that defines the size and type face of the label. The default is '7.5pt Sans-Serif'.
- color: 'string'
Is a color defined by a color name or numeric specification string that defines the color of the label.
- anchor: 'string'
Is a string that defines where to draw the reference label relative to the line. Valid values are: 'start' (same side as axis labels) or 'end' (opposite side).
- 'start', which draws the reference label on the same side as axis labels.
- 'end', which draws the reference label on the side opposite the axis labels. This is the default value.
- showValue: boolean
Enables or disables showing the reference line value. Valid values are:
- true, to draw the value at the specified anchor location relative to the line.
- false, to not draw the value. This is the default value.
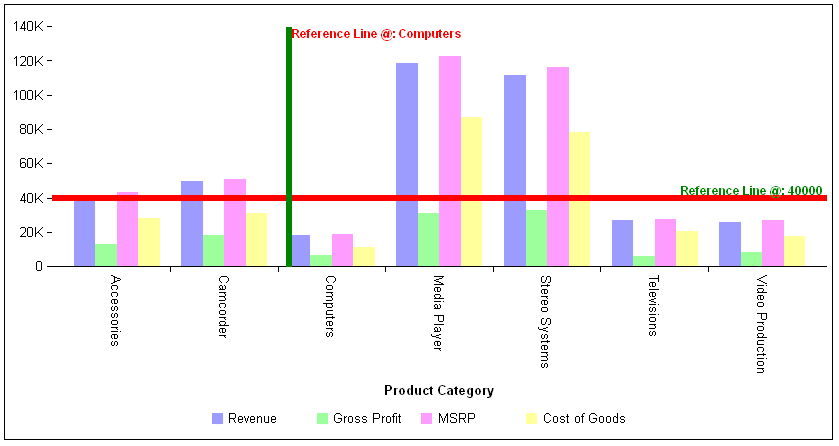
The following request generates a vertical bar chart with two reference lines. The y-axis reference line is a red line drawn at the value 40,000, with a green label that shows the value as part of the label. The x-axis reference line is a green line drawn at the value Computers, with a red label that shows the value as part of the label:
GRAPH FILE WF_RETAIL_LITE
SUM REVENUE_US GROSS_PROFIT_US MSRP_US COGS_US
BY PRODUCT_CATEGORY
ON GRAPH PCHOLD FORMAT JSCHART
ON GRAPH SET LOOKGRAPH VBAR
ON GRAPH SET STYLE *
*GRAPH_JS
referenceLines: [
   {value: 40000,
      axis: 'y',
      line: {color: 'red', width: 6,dash: '' },
      label: {text: 'Reference Line @:',
         font: 'bold 8pt Sans-Serif',
         color: 'green' },
      anchor: 'end',
      showValue: true
   } ,
{value: 'Computers',
      axis: 'x',
      line: {color: 'green', width: 6,dash: '' },
      label: {text: 'Reference Line @:',
         font: 'bold 8pt Sans-Serif',
         color: 'red' },
      anchor: 'end',
      showValue: true
   }]
*END
ENDSTYLE
END
The output is:
