In this section: |
If you click the Console icon, as shown in the following image, the following options are available:
![]()
Displays user login status and browser-related information. Login status information includes user name, group, and role, location of all profiles (user, group, and role) if they exist, and type of authentication (explicit or cookie). HTTP information reflects the properties of the current browser session, for example, the cookie.
Stops the server.
Restarts the server.
Quiesces or stops the server from accepting new connections. A custom message can be displayed for new connections when the server is quiesced. For more information, see How to Quiesce the Server and Set a Custom Message.
Enables traces to provide diagnostics assistance. For more information, see Tracing Server Activity.
Provides an option to gather, package, and ship trace files and other diagnostic information for Customer Support Services. For more information, see Gathering Diagnostic Information for Customer Support Services.
Provides the ability to run stress tests on the server. For more information, see Recording and Reproducing User Actions.
Provides options to show your privileges, change your password, manage agents, save your last report, and edit your profile. For more information, see My Console Options.
Enables you to indicate preferences for Run Options, Column Management, Synonym Editor, Dimension View Display, Web Console Appearance, and Reporting Options.
Run Options are Default Data Service, as shown in the following image. The choices are DEFAULT, WF_DEFAULT, SCHED_DEFAULT, and DFM_DEFAULT.
The Column Management section is shown in the following image.
The Column Management options are:
The Synonym Editor section is shown in the following image.
The Synonym Editor options are:
The Dimension View Display section is shown in the following image.
The Dimension View Display option is Show Easy View.
The Web Console Appearance section is shown in the following image.
The Web Console Appearance options are:
The Browser Support section shows the appearance modes supported for each browser version.
The Reporting Options section is shown in the following image.
The Reporting Options are:
Indicate your preferences, and click Update.
The main menu bar also includes Sign In As Different User. When you click this console option, the dialog box shown in the following image is displayed. Supply the requested information, and click Sign in.
The My Console options are available from the Console icon. They provide users with functionality that supports the tasks they are authorized to perform. The options that a user has under My Console depend on the user role and general privileges assigned to the user.
In the descriptions that follow, each option applies to the user who is connected to the current Web Console session.
Show My General Privileges. Shows the privileges set by the Server Administrator for the user who is logged in to the current Web Console session. Privileges can be customized for each role, group, or user. See General Privileges, for details on the information supplied on the General Privileges pane.
Change My Password. Enables you to specify a new password to replace your current password. When you click this console option, the dialog box shown in the following image is displayed. Supply the requested information, and click Update.
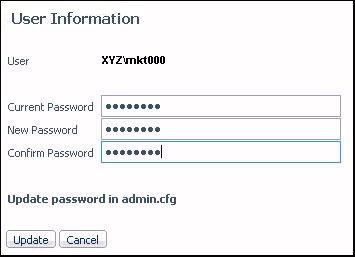
Note: The LDAP security mode also allows you to change your password in the LDAP directory.
Manage My Agents. Enables you to monitor and manage Data Service Agents, based on your role and privileges. For example, if you are a Basic user, by default you can monitor and manage your own agents (that is, the agents that match your user ID). If granted the applicable privileges, you can also monitor, or monitor and manage, the agents of the other users in your group (that is, users with the same group ID).
When you click Manage My Agents, a Performance Report for Data Service Agents is displayed, showing statistics for the agents that you are authorized to see. You can customize and filter the report to display only those statistics that you are interested in.
To determine your privileges, click Show General Privileges from the Web Console menu bar. See General Privileges for details on the information supplied on the General Privileges pane.
Save My Last Report. Saves the last report (procedure) that you ran with the values that you chose for the amper variables. The report is saved as a new, separate procedure. You can run the saved report without having to manually supply the values for the amper variables as you did before.
When you click this console option, you can select for the application directory in which to save the report and enter a file name for the report.
Edit My Profile. Enables you to make changes to your current user profile settings.
| iWay Software |