Whether you access frame and background options from the ribbon, or the right-click menu, you are presented with the Frame & Background dialog box of options for formatting the frame and background of a chart. The Frame & Background dialog contains the following tabs:
- Frame
- Frame Edge
- Background
The Frame & Background dialog box and pertinent tabs are discussed in this section for the following types of charts:
- 2D Charts and 2D Charts with 3D Effects (Frame and Frame Edge tabs)
- Pie Charts (Frame and Frame Edge tabs)
- 3D Charts (Left Wall, Right Wall, Floor, and Advanced tabs)
Note: The options in the Frame tab vary based on the chart type selected.
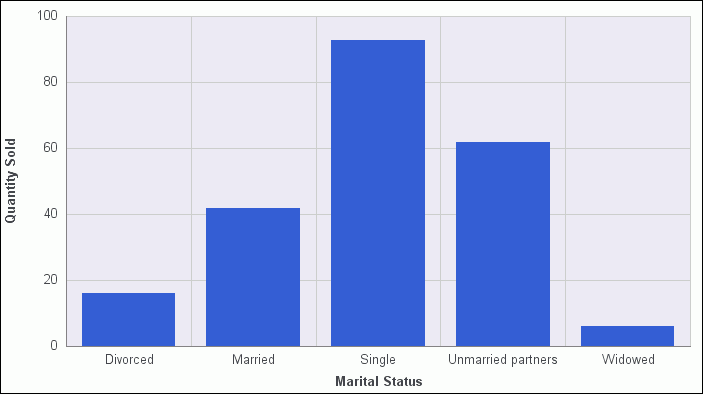
Use the Frame tab for 2D charts and 2D charts with 3D effects to set a frame depth angle and depth radius, select a fill for a frame, and set a shadow for a frame for these types of charts. The Frame tab for 2D charts and 2D charts with 3D effects is shown in the following image.
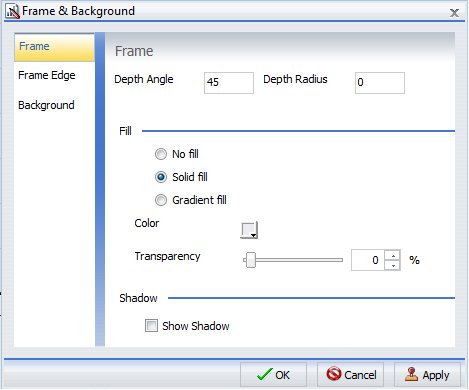
The Frame tab for 2D charts and 2D charts with 3D effects contains the following options:
- Depth Angle. Enter the angle from the front of the chart to the back where the chart risers and frames are drawn. You can set the depth angle from zero to 180 degrees, but it must be used along with Depth Radius.
- Depth Radius. Enter how far out the extruded frame will be extended. Small values, such as zero, produce very narrow charts. Large values, the maximum being 100, produce thicker charts.
Fill
- No fill. (Default). Select this option to keep the legend colorless.
-
Solid fill. Select
this option to display the Color and Transparency options.
- Color. Click this icon to open the Color dialog box, where you can select a color for a frame.
- Transparency. Move the slider to make the frame opaque (0%) or transparent (100%). The default is 0%.
-
Gradient fill. Select
this option to display the direction of the gradient, the color
pattern of the gradient, and the degrees of transparency for the
two colors that make up the gradient. A gradient is a smooth color
transition or blending of one color to another. The number of colors
to use in a gradient is defined by the stop or pin elements.
-
Direction. Select
from this drop-down menu to set the direction of the gradient fill.
The options are:
- Gradient right
- Gradient left
- Gradient down
- Gradient up
- Gradient down left
- Gradient up left
- Gradient down right
- Gradient up right
- Radial
- Radial top left
- Radial top right
- Radial bottom left
- Radial bottom right
- Radial pie
- Radial pie inverted
-
Direction. Select
from this drop-down menu to set the direction of the gradient fill.
The options are:
Gradient style
- Color Pattern. Select the color pattern for the data series. The color pattern option on the left is an AB wash that uses two colors in the pattern color1 - color2, for example, red-green. The color pattern option on the right is an ABA wash that uses two colors in the pattern color1 - color2 - color1, for example, red-green-red.
- First Color. Click this icon to open the Color dialog box, where you can select a color for the first color.
- Second Color. Click this icon to open the Color dialog box, where you can select a color for the second color.
Shadow
- Show Shadow. Select this option to set a shadow.
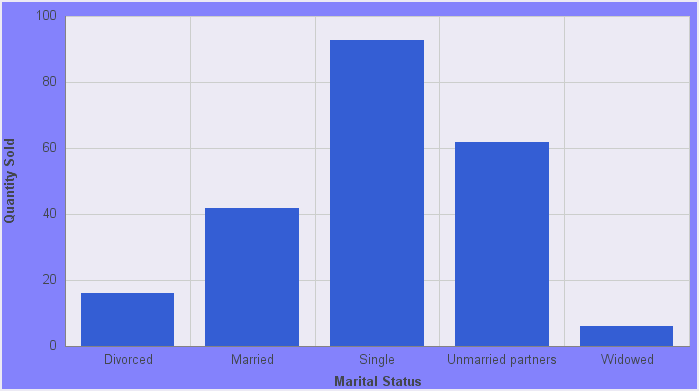
Use the Frame Edge tab for 2D charts and 2D charts with 3D effects to set a frame depth angle and depth radius, select a fill for a frame, and set a shadow for a frame for these types of charts. The Frame Edge tab is shown in the following image.
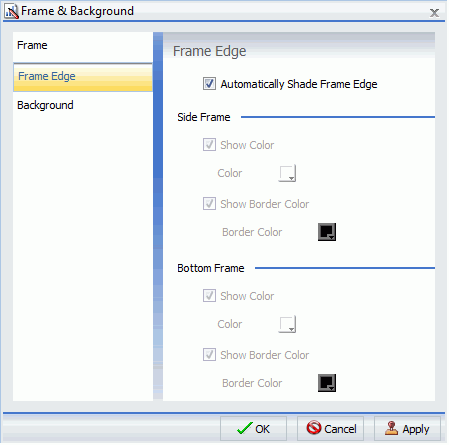
The Frame tab for 2D charts and 2D charts with 3D effects contains the following options:
- Automatically Shade Frame Edge. Select this option to automatically shade the frame edge. Clear this option to enable the Side Frame and Bottom Frame options.
Side Frame
- Show Color. Select this option to show the color of the side frame.
- Color. Click this icon to open the Color dialog box, where you can select a color for the side frame.
- Show Border Color. Select this option to show the color of the border of the side frame.
- Border Color. Click this icon to open the Color dialog box, where you can select a color for the border of the side frame.
Bottom Frame
- Show Color. Select this option to show the color of the bottom frame.
- Color. Click this icon to open the Color dialog box, where you can select a color for the bottom frame.
- Show Border Color. Select this option to show the color of the bottom frame.
- Border Color. Click this icon to open the Color dialog box, where you can select a color for the border of the bottom frame.
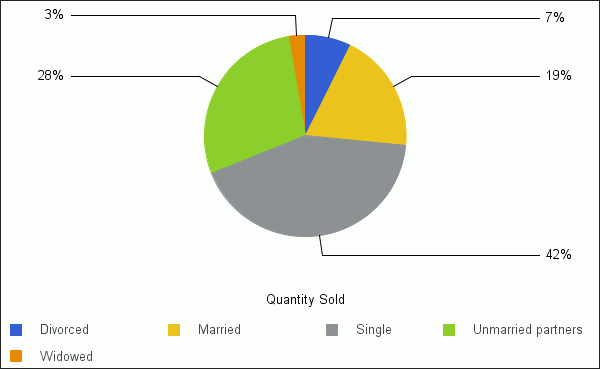
Use the Frame tab for pie charts to set pie depth and tilt, select a fill and color for a pie frame, and set a shadow for the frame. The Frame tab is shown in the following image.
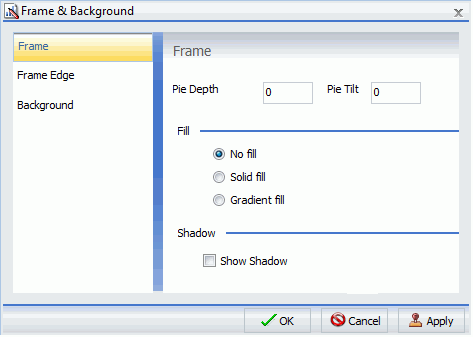
The Frame tab for pie charts contains the following options:
- Pie Depth. Set the depth of the edge of a pie chart. You can select a value from zero to 100 to set the thickness of an edge.
- Pie Tilt. Set the tilt of the pie chart. The smaller the value you add, the flatter the pie chart appears. The larger the value you add, more of the pie edge appears.
Fill
- No fill. (Default). Results in no color added to the edge of the pie.
-
Solid fill. Select
this option to display the Color and Transparency options.
- Color. Click this icon to open the Color dialog box, where you can select a color for the frame.
- Transparency. Move the slider to make the fill opaque (0%) or transparent (100%). The default is 0%.
-
Gradient fill. Select
this option to display the direction of the gradient, the color
pattern of the gradient, and the degrees of transparency for the
two colors that make up the gradient. A gradient is a smooth color
transition or blending of one color to another. The number of colors
to use in a gradient is defined by the stop or pin elements.
-
Direction. Select
from this drop-down menu to set the direction of the gradient fill.
The options are:
- Gradient right
- Gradient left
- Gradient down
- Gradient up
- Gradient down left
- Gradient up left
- Gradient down right
- Gradient up right
- Radial
- Radial top left
- Radial top right
- Radial bottom left
- Radial bottom right
- Radial pie
- Radial pie inverted
-
Gradient Style
- Color Pattern. Select the color pattern for the data series. The color pattern option on the left is an AB wash that uses two colors in the pattern color1 - color2, for example, red-green. The color pattern option on the right is an ABA wash that uses two colors in the pattern color1 - color2 - color1, for example, red-green-red.
- First Color. Click this icon to open the Color dialog box, where you can select a color for the first color.
- Second Color. Click this icon to open the Color dialog box, where you can select a color for the second color.
-
Direction. Select
from this drop-down menu to set the direction of the gradient fill.
The options are:
Shadow
- Show Shadow. Select this option to set a shadow around the frame.
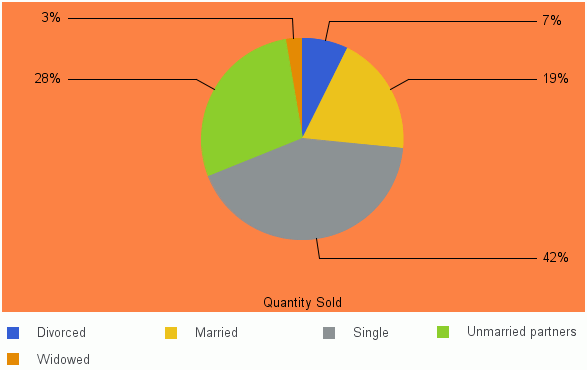
Use the Frame Edge tab for pie charts to set the edge of a pie frame. The Frame Edge tab is shown in the following image.
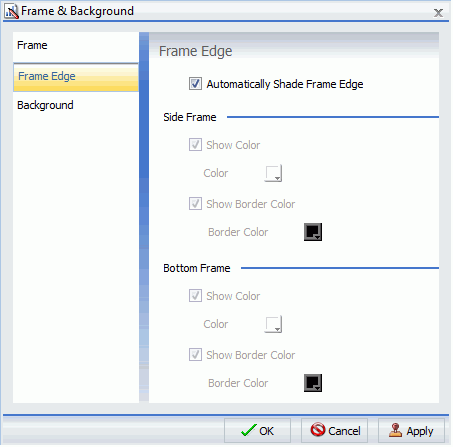
The Frame Edge tab for pie charts contains the following options:
- Automatically Shade Frame Edge. Select this option to automatically shade the frame edge. Clear this option to enable the Side Frame and Bottom Frame options.
- Show Color. Select this option to show the color of the side frame.
- Color. Click this icon to open the Color dialog box, where you can select a color for side frame.
- Show Border Color. Select this option to show the color of the border of the side frame.
- Border Color. Click this icon to open the Color dialog box, where you can select a color for the border of the side frame.
Bottom Frame
- Show Color. Select this option to show the color of the bottom frame.
- Color. Click this icon to open the Color dialog box, where you can select a color for the bottom frame.
- Show Border Color. Select this option to show the color of the bottom frame.
- Border Color. Click this icon to open the Color dialog box, where you can select a color for the border of the bottom frame.
Use Wall and Floor tabs to set the walls and floor of a 3D chart. The Left Wall tab is shown in the following image.
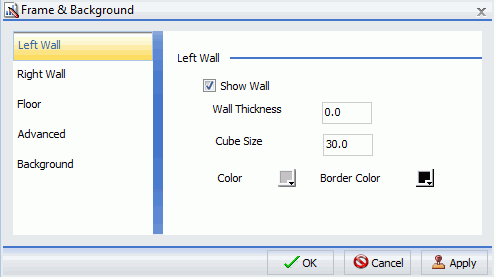
These Wall and Floor tabs contain the following options:
- Show Wall or Show Floor. Select this option to show the wall or floor (depending on the tab) of the 3D chart.
- Wall Thickness. Specify the thickness of the wall or floor.
- Cube Size. Specify the cube size of the wall or floor.
- Color. Click this icon to open the Color dialog box, where you can select a color for the wall or floor.
- Border Color. Click this icon to open the Color dialog box, where you can select a color for the border of the wall or floor.
- Show Wall (Left Wall). Select this option to show the left wall.
- Show Wall (Right Wall). Select this option to show the right wall.
- Show Floor. Select this option to show the floor.
Use the Advanced tab for 3D charts to modify additional properties for 3D frames. The Advanced tab for 3D charts is shown in the following image.
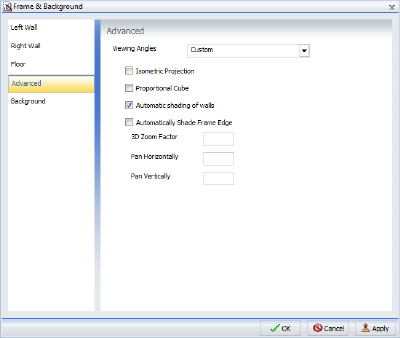
The Advanced tab contains the following options:
-
Viewing Angles. Select
from a drop-down menu of viewing angles for three-dimensional charts.
The options are:
- Standard
- Group View
- Series View
- Distorted Value
- Isometric Standard
- Distorted Standard
- Emphasize Group
- Blast-O-Vision
- Thin Wall
- Isometric Group View
- Isometric Group View #2
- High Backed
- Upward Distorted
- Down Tilt
- Narrow Isometric
- Isometric view by groups
- Custom
- Isometric Projection. Select this option to ignore perspective distortion in a project graph cube from an isometric view.
- Proportional Cube. Select this option to define the axis size proportional to the number of series or groups.
- Automatic shading of walls. Select this option to shade chart walls.
-
Automatically Shade Frame Edge. Select
this option to automatically shade the frame edge.
- 3D Zoom Factor. Enter a value in the text box to set the global scaling factor for zooming in and out in a 3D chart. Smaller values zoom out and produce a smaller display of the chart within a frame. Larger values zoom in and produce a larger display of the chart within a frame.
- Pan Horizontally. Enter a value in the text box to pan a 3D chart in the horizontal direction. Smaller values move the frame of the chart to the left. Larger values move the frame of the chart to the right.
- Pan Vertically. Enter a value in the text box to pan a 3D chart in the vertical direction. Smaller values move the frame of the chart upward. Larger values move the frame of the chart downward.
Use the Background tab to set and customize a border for a chart. The Background tab is shown in the following image.
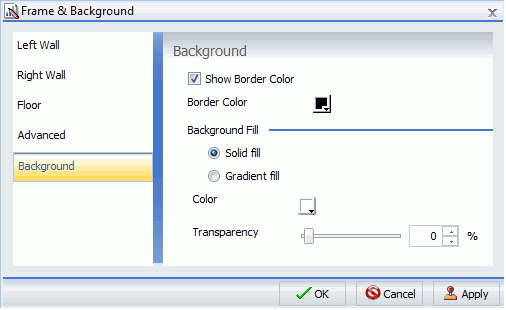
The Background tab contains the following options:
- Show Border Color. Select this option to show the color of the border.
- Border Color. Click this icon to open the Color dialog box, where you can select a color for the border.
-
Solid fill. Select
this option to display the Color and Transparency options.
- Color. Click this icon to open the Color dialog box, where you can select a color for the frame.
- Transparency. Move the slider to make the background opaque (0%) or transparent (100%). The default is 0%.
-
Gradient fill. Select
this option to display the direction of the gradient, the color
pattern of the gradient, and the degrees of transparency for the
two colors that make up the gradient. A gradient is a smooth color
transition or blending of one color to another. The number of colors
to use in a gradient is defined by the stop or pin elements.
-
Direction. Select
from this drop-down menu to set the direction of the gradient fill.
The options are:
- Gradient right
- Gradient left
- Gradient left
- Gradient down
- Gradient up
- Gradient down left
- Gradient up left
- Gradient down right
- Gradient up right
- Radial
- Radial top left
- Radial top right
- Radial bottom left
- Radial bottom right
- Radial pie
- Radial pie inverted
-
Direction. Select
from this drop-down menu to set the direction of the gradient fill.
The options are:
Gradient Style
- Color Pattern. Select the color pattern for the data series. The color pattern option on the left is an AB wash that uses two colors in the pattern color1 - color2, for example, red-green. The color pattern option on the right is an ABA wash that uses two colors in the pattern color1 - color2 - color1, for example, red-green-red.
- First Color. Click this icon to open the Color dialog box, where you can select a color for the first color.
- Second Color. Click this icon to open the Color dialog box, where you can select a color for the second color.
For instructions on how to open this dialog box, see the procedures in Using Frame and Background Properties.