Creating an Active Technologies Report
An active report provides customizable
options for creating an HTML-formatted report that enables users
to experience features similar to those found in Excel workbooks.
An active report is designed for distribution to users to perform
offline analysis and interactive functions without any connection
to a server. All of the data and JavaScript code are stored within
the HTML file, which also makes the output highly compressible for
email and transparent to security systems.
Tip: Whenever the term active
reports is mentioned, it includes active reports for Adobe Flash
Player and for PDF, unless otherwise noted. Use AHTML (HTML
active report), FLEX (active report for Adobe
Flash Player), or APDF (active report for
PDF) as the report output format.
Specific WebFOCUS
StyleSheet commands enable developers
to set the initial state of the report and control the options available
to users. When you develop active reports, the options that you
can control include:
- Viewing
reports in either tabular or expandable formats.
- Applying calculations
to columns and choosing the location to display results.
- Controlling the display
of data by hiding or freezing columns.
- Limiting the number
of rows displayed per page.
- Adding a graphic
visualization column to compare column values.
- Customizing the colors
for most of the report components.
x
Syntax: How to Create an Active Technologies Report
To create an HTML active report, use
ON TABLE {PCHOLD|HOLD|SAVE} FORMAT {AHTML|FLEX|APDF}
where:
-
PCHOLD
-
Displays the report output in a web browser in the format
specified. PCHOLD is the default value.
- HOLD
-
Saves the report output to a temporary file
for later use.
- SAVE
-
Saves the report output to a file for later
use.
- AHTML
-
Creates an HTML version of the report.
- FLEX
-
Creates an Adobe Flash Player version of
the report (Adobe Flash file).
- APDF
-
Creates an Adobe Flash Player version of
the report (Adobe Flash file), embedded in a PDF file.
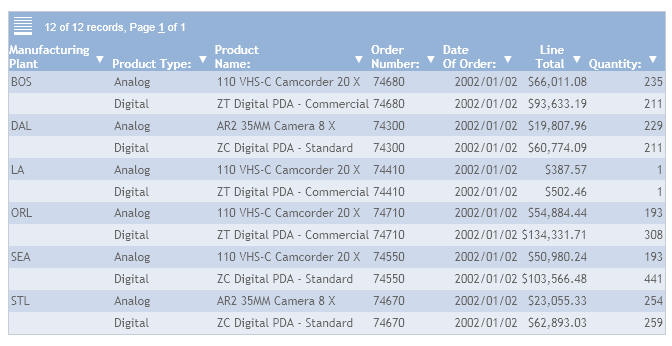
Example: Creating an Active Technologies Report
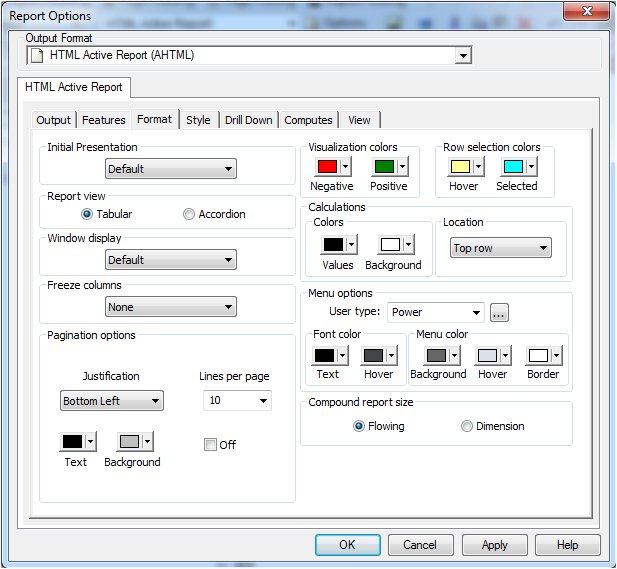
The following code generates an HTML
active report.
All customized (non-default) values and
corresponding keywords, used to specifically format an HTML active
report, are shown in bold.
TABLE FILE CENTURYSALES
SUM
     ORDERNUMBER
     ORDERDATE
     QUANTITY
     LINEPRICE
     BY PLANTCODE AS 'Plant'
ON TABLE SET PAGE-NUM OFF
ON TABLE SET BYDISPLAY ON
ON TABLE NOTOTAL
ON TABLE PCHOLD FORMAT AHTML
ON TABLE SET STYLE *
     UNITS=IN,
     SQUEEZE=ON,
     ORIENTATION=PORTRAIT, $
TYPE=REPORT,
     GRAPHCOLOR='GREEN',
     GRAPHCOLORNEG='RED', $
TYPE=REPORT,
     FONT='ARIAL',
     SIZE=9,
     COLOR='BLACK',
     BACKCOLOR='NONE',
     STYLE=NORMAL,
     FREEZE-WIDTH=AUTO,
     LINES-PER-PAGE=30,
     CALC-LOCATION=BOTTOM,$
TYPE=TITLE, STYLE=BOLD, $
TYPE=REPORT,
     OBJECT=MENU,
     COLOR=RGB(0 51 102),
     HOVER-COLOR='WHITE',
     BACKCOLOR=RGB(51 204 204),
     HOVER-BACKCOLOR='PURPLE',
     BORDER-COLOR='FUCHSIA', $
TYPE=REPORT,
    OBJECT=STATUS-AREA,
    COLOR=RGB(153 51 0),
    BACKCOLOR='AQUA', $
TYPE=REPORT,
    OBJECT=CURRENT-ROW,
    HOVER-BACKCOLOR=RGB(255 255 153),
    BACKCOLOR=RGB(255 153 0), $
TYPE=REPORT,
    OBJECT=CALC-AREA,
    COLOR=RGB(153 51 0),
    BACKCOLOR=RGB(255 204 153), $
TYPE=REPORT, COLUMN=N2, CALCULATION=CNT, $
TYPE=REPORT, COLUMN=N4, CALCULATION=SUM, $
ENDSTYLE
END
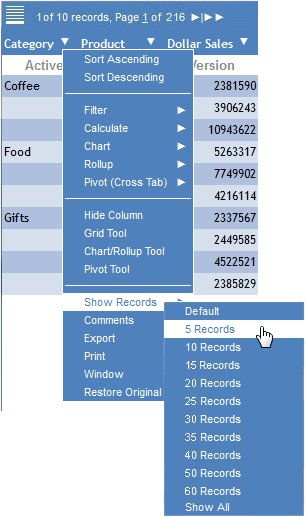
The output is:
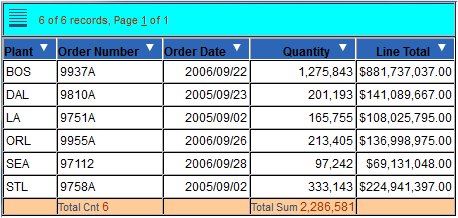
Starting at the top of the report, notice
the customized background colors, the record status and page navigation
bar, and the calculation row at the bottom.
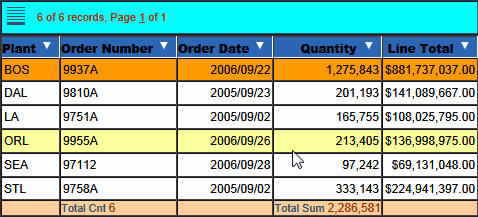
The
following image shows the same report in which the first data row
is highlighted. The mouse is pointing to the fourth data row.
xControlling Formatting Options for Active Technologies Reports
Some of the formatting options can only be controlled
or implemented from the user menus in the output of an active report.
For more information about these options, see User-Controlled Options in an Active Technologies Report.
You can set the initial state of an active report by customizing
many report options with WebFOCUS
t syntax. You can enable
or disable some options prior to distribution to users. The following
syntax sections describe the options you can control.
x
Syntax: How to Control the Report View Options
To control the report view options, which determine whether
a tabular or expandable report is created, use
ON TABLE SET EXPANDABLE={ON|OFF}
where:
- ON
-
Creates an expandable report.
-
OFF
-
Creates a tabular report. OFF is the default
value.
The pagination and freeze options are not available with
the expandable report view option.
Tip: When you use active reports, it is recommended that
you set the system font display to normal to
ensure that the menu icons display correctly.
To
set the system font display, right-click anywhere on the desktop,
select Properties from the pop-up menu, select
the Settings tab in the Display Properties
dialog box, click the Advanced button, set
the Font Size to Small Fonts, and click OK.
These steps are for Windows 2000. They may vary by operating system.
x
Syntax: How to Control the Window Display Option
To control how windows display in the report output when
multiple windows are open in the web browser, use
TYPE=REPORT, WINDOW-DISPLAY=coldesc, $
where:
-
coldesc
-
Enables the report to display multiple
open windows as tabs or cascaded windows in the web browser. Multiple
windows are created in the browser when viewing data as a chart,
a roll-up table, and so on.
Valid values
are CASCADE or TAB.
x
Syntax: How to Control the Row Selection Colors
To control the colors of the row
being selected or pointed to, use
TYPE=REPORT, OBJECT=CURRENT-ROW, HOVER-BACKCOLOR=hovercolor,
BACKCOLOR=selectcolor, $
where:
- CURRENT-ROW
-
Specifies the object, which is the current
row where the mouse is clicked or is pointing.
-
hovercolor
-
Specifies the background color of the row
where the mouse is pointing. The default value is RGB(255 252 204),
which is a shade of yellow. Valid values can be either a preset
color name in single quotes, for example, 'YELLOW', or the RGB (red
green blue) numeric values, for example, RGB(255 255 153).
-
selectcolor
-
Specifies the background color of the row
selected (click anywhere within a row). The default is RGB(51 255
204), which is a mix of green and blue. Valid values can be either
a preset color name in single quotes, for example, 'BLUE', or the
RGB (red green blue) numeric values, for example, RGB(153 53 0).
x
Syntax: How to Control User Menu Options
To control the user menu options,
which determine the location and color characteristics of the user
menu in the report, use the appropriate syntax section that follows.
To control all of the colors of the
user menu, use
TYPE=REPORT, OBJECT=MENU, COLOR=textcolor,
HOVER-COLOR=hovertextcolor,BACKCOLOR=backcolor,
HOVER-BACKCOLOR=hoverbackcolor,BORDER-COLOR=bordercolor, $
where:
- MENU
-
Specifies the object, which is the user
menu.
-
textcolor
-
Specifies the color of the text (font)
in the user menu. BLACK is the default value. Valid values can be
either a preset color name in single quotes, for example, 'YELLOW', or
the RGB (red green blue) numeric values, for example, RGB(153 153
153).
-
hovertextcolor
-
Specifies the color for the hover text
in the user menu. BLACK is the default value. Valid values can be
either a preset color name in single quotes, for example, 'RED',
or the RGB (red green blue) numeric values, for example, RGB(255
255 153).
-
backcolor
-
Specifies the color for the background
(non-text) areas in the user menu. SILVER is the default value.
Valid values can be either a preset color name in single quotes,
for example, 'GOLD', or the RGB (red green blue) numeric values,
for example, RGB(153 51 0).
-
hoverbackcolor
-
Specifies the color
for the background area of the user menu where your mouse is pointing.
WHITE is the default value. Valid values can be either a preset
color name in single quotes, for example, 'ORANGE', or the RGB (red
green blue) numeric values, for example, RGB(51 204 204).
You can use this, along with the hover text color,
to visually contrast the menu option where the mouse is currently
pointing from the rest of the menu.
-
bordercolor
-
Specifies the color for the borders of
the user menu. WHITE is the default value. Valid values can be either
a preset color name in single quotes, for example, 'BLUE', or the
RGB (red green blue) numeric values, for example, RGB(255 255 153).
x
Syntax: How to Control the Calculation Options
To control the calculation options,
which determine the column and the calculation you want to perform,
along with the styling characteristics of the calculation results
row, use the appropriate syntax section that follows.
- To perform column
calculations, use
TYPE=REPORT, COLUMN=coldesc, CALCULATION=calc, $
where:
-
coldesc
-
Specifies the description (column name
or identifier) of the column where you want to perform a calculation.
-
calc
-
Specifies the
calculation to be performed. The default is no calculation.
For columns containing
numeric data, select from: SUM, AVE, MIN, MAX, CNT, CNT.DST, PCT.TOT.
PCT.TOT values appear
in a separate column adjacent to the column for which it is calculated,
and styling is inherited from the visualization column.
For columns containing text (alphanumeric) data,
select from: CNT, CNT.DST.
- To control the location
of the calculation results row, use
TYPE=REPORT, CALC-LOCATION={TOP|BOTTOM}, $
where:
-
TOP
-
Specifies the top row of the report
as the location of the calculation results. TOP is the default value.
- BOTTOM
-
Specifies the bottom row of the report
as the location of the calculation results.
- To control the colors
of the calculation results row, use
TYPE=REPORT, OBJECT=CALC-AREA, COLOR=color, BACKCOLOR=backcolor, $
where:
- CALC-AREA
-
Specifies the object, which is the
calculation results row.
-
color
-
Specifies the color for the calculation
values in the calculation results row. The default value is BLACK
and is inherited from the column title font color. Valid values
can be either a preset color name in single quotes, for example,
'RED', or the RGB (red green blue) numeric values, for example,
RGB(255 255 153).
-
backcolor
-
Specifies the color for the background
in the calculation results row. The default value is WHITE and is
inherited from the column title background color. Valid values can be
either a preset color name in single quotes, for example, 'GOLD',
or the RGB (red green blue) numeric values, for example, RGB(153
51 0).
x
Syntax: How to Control the Visualization Color Options
To control the colors of the graphic
values used with the visualization option, use
TYPE=REPORT, GRAPHCOLOR=positivecolor, GRAPHCOLORNEG=negativecolor, $
where:
-
positivecolor
-
Specifies the color for the positive values
displayed in the optional visualization column. BLACK is the default
value. Valid values can be either a preset color name in single
quotes, for example, 'BLUE', or the RGB (red green blue) numeric
values, for example, RGB(255 255 153).
-
negativecolor
-
Specifies the color for the negative values
displayed in the optional visualization column. BLACK is the default
value. Valid values can be either a preset color name in single
quotes, for example, 'VIOLET', or the RGB (red green blue) numeric
values, for example, RGB(153 153 153).
x
Syntax: How to Control the Freeze Column Options
To
control the freeze column options, which determine the column (and
all columns to the left) that will freeze when scrolling to the
right to view other columns in the report output, use
TYPE=REPORT, FREEZE-COLUMN=coldesc, $
or
TYPE=REPORT, FREEZE-WIDTH=AUTO, $
where:
-
coldesc
-
Specifies the description (column name
or identifier) of the column you want to freeze. You can only specify
one freeze column, which must be a BY sort field. The default value
is none (no freeze column).
- AUTO
-
Enables the report to freeze at a particular
column that is automatically determined by WebFOCUS
for optimal viewing.
If you can view
the entire report output on the screen without scrolling, the freeze
is not applied.
The freeze
option is not available with the expandable report view option.
x
Syntax: How to Control the Hide Column Options
To control the hide column options, which determine the
columns that are hidden from view in the report output, repeat the
following for each column you want to hide.
TYPE=REPORT, COLUMN=coldesc, HIDE={ON|OFF}, $
where:
-
coldesc
-
Specifies the description (column name
or identifier) of the column you want to hide. You can hide multiple
columns, but you cannot hide all columns (at least one column must
always be visible).
- ON
-
Enables the option.
-
OFF
-
Disables the option. OFF is the default
value.
x
Syntax: How to Display NOPRINT Fields in an Active Technologies Report Menu
To control the display of NOPRINT fields in the active
report drop-down menu, use
TYPE=REPORT, ALLOW-NOPRINT={ON|OFF}, $
where:
- ON
-
Displays all NOPRINT fields in the active
report menu.
-
OFF
-
Suppresses the display of NOPRINT fields
in the active report menu. This is the default value.
Note: This
setting does not affect fields that are hidden using HIDE=ON syntax.
In order to simply hide a field, but make it available for later
use in an active report drop-down menu, use HIDE=ON syntax.
x
Syntax: How to Show or Hide Individual Active Technologies Report Menu Options
To control individual active report menu options available
to the users, use
TYPE=REPORT, ALLOW-feature={ON|OFF}, $
where:
-
feature
-
Specifies the feature. Select from:
PAGINATION to
enable the use of show record options.
FILTER to enable the use of filtering
or highlighting options.
FREEZE to enable the use of freeze column options.
CALC to
enable the use of calculation options.
HIDE to enable the use of hide
column options.
CHART to
enable the use of chart creating options.
EXPORT to enable the use of exporting options.
VISUALIZE to
enable the use of graphical visualization options.
SORT to enable the
use of sorting options.
ROLLUP to enable the use of rollup table options.
PIVOT to
enable the use of pivot table options.
COMMENTS to enable the use of
comment options.
WINDOW to
enable the use of window type options.
RESTORE to enable the use of
restore options.
SENDEMAIL to
enable the use of send as e-mail options.
SAVECHANGE to enable the use
of save changes options.
PRINT to enable the use of print options.
ACCORDION to
enable the use of accordion options.
TOOLS to enable the use of Chart/Rollup
Tool, Pivot Tool, and Grid Tool options.
-
ON
-
Enables the option. ON is the default value
for all user-controlled options.
- OFF
-
Disables the option.
x
Syntax: How to Completely Hide the Active Technologies Report Menu From the Product
This option applies to active reports with the AHTML output
format.
The active report drop-down menu with
its drop-down arrow image is always shown by default. To completely
hide the menu and arrow from the product, use:
TYPE=REPORT, MENU-LOCATION=OFF, $
This setting suppresses the display of the entire active
report drop-down menu and arrow image. You can display the menu
and arrow again by removing the preceding setting from the active
report procedure.
x
Syntax: How to Control the Active Technologies Cache Option
Because all post-retrieval processing is performed in
the memory of the web browser, an active report has a processing
limit of approximately 5,000 records or 100 pages of output. The
active cache option enables you to send only the first page of active
report output to the browser and retrieve subsequent pages from
a temporary cache on the WebFOCUS Reporting Server. The server also
becomes the resource for performing all calculations, sorting, and
filtering when active cache is enabled. Since active cache uses on-demand
paging functionality, WebFOCUS Viewer is not supported.
To enable active cache for
active reports, use
ON TABLE SET WEBVIEWER {ON|OFF}
ON TABLE SET CACHELINES {n|100}
where:
- ON
-
Runs the active report with active cache
enabled.
-
OFF
-
Will not enable active cache when the active
report is run. OFF is the default value.
-
n|100
-
Specifies the number of rows from cache.
The default is 100.
Tip: It
is recommended that you set the number of rows retrieved five times
greater than the number of lines retrieved per page (as indicated
in SET LINES). The minimum number of rows retrieved is 100. Setting
LINES greater than 200 with the AHTML output format produces a report
with no output. If editing the SET LINES syntax for a procedure
with AHTML, it is recommended that you code SET LINES equal to or
less than 200 since the Internet Explorer JavaScript engine is slower
than any other browser (such as Firefox, Opera, Google Chrome, and
so on).
Usage Notes for the Active Technologies Cache Option
The following apply when the active cache option is enabled:
- The Restore Original menu option is not supported for an active report that contains data visualization
bars.
- The Export menu option does not
export a calculation applied to a tabular active report.
- Comments for an
accordion active report are cleared if you sort output with the
Sort
Ascending or Sort Descending
command.
x
Syntax: How to Export an Active Technologies Report to an Excel Worksheet
You can use the SET AREXPEXCEL command to export an active
report to an Excel worksheet with the specified format.
The syntax is
SET AREXPEXCEL = {XLSX|EXL2K}
where:
- XLSX
- Exports an active report to an Excel worksheet with the extension xlsx. To use this feature, run the active report, and select Export, Excel, All records from a column drop-down menu. Respond to the prompt to open the Excel worksheet in a new window with all records displayed.
If a filter is applied to the active report, you can click Filtered only instead of All records to export the filtered data instead of the entire report.
This setting applies when the active
cache option is enabled. To enable active cache in a report request,
include the command ON TABLE SET WEBVIEWER ON.
-
EXL2K
- Exports an active report to a file with an Excel extension. Run the active report, and select Export, XML (Excel), All records from a column drop-down menu. The Excel worksheet opens in a new window with all records displayed. You can optionally perform any available Excel function. For example, click the Save icon to open the Save As dialog box. Supply the name of the folder in which the file will be saved, the name of the file, and the type of file.
If a filter is applied to the active report, you can click Filtered only instead of All records to export the filtered data instead of the entire report.
To use this feature, you must enable ActiveX in your browser security settings.
EXL2K is the default setting for the AREXPEXCEL command.
As noted for both settings, the Excel worksheet opens in a new window. Some users may need to provide the browser with permission to allow pop-ups.
x
Syntax: How to Embed an HTML Active Technologies Report in an Existing HTML Document
When
you extract and save report output with the HOLD or SAVE command,
you can specify FORMAT AHTMLTAB to create an output file that contains
only data and parameters used in an HTML active report (output format
AHTML). The output produced is not a complete HTML active report.
However, you can include the output file in another HTML document
using the Dialogue Manager command -HTMLFORM.
- For details on the
HOLD and SAVE commands, see Chapter 8, Saving and Reusing
Your Report Output, in the Creating Reports With WebFOCUS Language manual.
- For details on the
-HTMLFORM command, see the documentation on Dialogue Manager in
the Developing Reporting Applications manual.
The
syntax for creating a HOLD file with output format AHTMLTAB is
ON TABLE HOLD [AS filename] FORMAT AHTMLTAB [MISSING {ON|OFF}]
where:
- HOLD
- Extracts and saves report output. The output is saved with an
associated Master File.
-
filename
-
Specifies a name for the HOLD file. If you do not specify
a file name, HOLD becomes the default. Since each subsequent HOLD
command overwrites the previous HOLD file, it is advisable to code
a distinct file name in each request to direct the extracted data
to a separate file, thereby preventing it from being overwritten
by the next HOLD command. The name can contain up to the maximum
number of characters supported by your operating system. For more
information, see the topic Naming a Master File, in
Chapter 1, Understanding a Data Source Description,
in the Describing Data With WebFOCUS Language manual.
- MISSING
-
Controls whether fields with the attribute MISSING=ON in
the Master File are carried over into the HOLD file. MISSING ON
is the default attribute. If the HOLD command specifies MISSING
OFF, fields with the MISSING attribute are not carried over. For
related information, see Chapter 13, Handling Records With
Missing Field Values, in the Creating Reports With
WebFOCUS Language manual.
Note: When
issuing HOLD AS filename FORMAT AHTMLTAB to embed an HTML
active report in another HTML document, you must include Active
Technologies JavaScript code in the HTML BODY using:
<BODY>
!IBI.OBJ.ACTIVEREPORTJS;
The syntax for creating
a SAVE file with output format AHTMLTAB is
ON TABLE SAVE [AS filename] FORMAT AHTMLTAB [MISSING {ON|OFF}]
where:
-
filename
-
Specifies a name for the SAVE file. If you do not specify
a file name, SAVE is used as the default. Since each subsequent
SAVE command overwrites the previous SAVE file, it is advisable
to code a distinct file name in each request to direct the extracted
data to a separate file, thereby preventing it from being overwritten
by the next SAVE command.
You can also include a path, enclosed
in single quotation marks, indicating where to store the SAVE file.
For example:
ON TABLE SAVE AS filename 'install_dir:\dir\filename.ext' FORMAT AHTMLTAB
- MISSING
-
Ensures that fields with the MISSING attribute set to ON
are carried over into the SAVE file. MISSING OFF is the default
attribute. For more information, see Chapter 13, Handling
Records With Missing Field Values, in the Creating Reports
With WebFOCUS Language manual.
x
Syntax: How to Control the Generation of the Active Technologies for HTML Output File
The SET AROUTPUT command enables you to control how and
where the Active Technologies for HTML output file is generated.
For
example, because all JavaScript processing is performed in the memory
of the web browser, an active report has a processing limit of approximately
5,000 records or 100 pages of output. The SET AROUTPUT = EXTJS command
enables you to use external JavaScript files instead of embedding
the JavaScript within the HTML output file, in order to improve
performance at run time.
The SET AROUTPUT command applies to active reports
with the AHTML output format.
The syntax for the command is as follows.
You can add the command to the profile (edasprof.prf) or to the
WebFOCUS procedure that generates the active report.
SET AROUTPUT = {EXTJS|ALL|DATALOOK}
where:
- EXTJS
-
Uses external JavaScript files instead
of embedding the JavaScript within the HTML output file.
This
option generates styling structures, data structures, images, and
the JavaScript that launches the active report. Active Technologies
JavaScript is called using external SCRIPT tags and is downloaded
from the middle tier at run time.
The EXTJS option:
- Applies only to connected
mode.
- Requires the installation
of WebFOCUS Release 8.0 Version 01 or higher.
-
ALL
-
Generates and embeds all items within the
HTML output file, including Active Technologies JavaScript, styling
structures, data structures, images, and the JavaScript that launches
the active report. Maintains disconnected mode for an active report.
ALL is the default value.
Note: Starting with WebFOCUS Release 8.0 Version 01, make
sure to use the command SET AROUTPUT = ALL to allow users to save
an active report or document with the browser Save as option. For
more information on saving active reports and documents, see Saving, Exporting, and Sending Active Technologies Reports.
- DATALOOK
-
Generates styling structures and data
structures. This option is similar to AHTMLTAB. The output produced
is not a complete HTML active report. However, you can include the
output file in another HTML document using the Dialogue Manager command
-HTMLFORM. Always use this option with ACTIVEREPORTJS.
For
more information on AHTMLTAB and the !IBI.OBJ.ACTIVEREPORTJS; command,
see the reference section on FORMAT AHTMLTAB, in the topic Choosing
Output File Formats, in Chapter 8, Saving and Reusing Your
Report Output, of the Creating Reports With WebFOCUS Language manual.
xControlling the Pagination Options
For active reports, you can:
- Determine the number
of rows displayed per page and the styling characteristics of the
record status and page navigation bar. For details, see Determining the Number of Rows Per Page and Styling Characteristics.
- Customize the pagination
bar to display the range of records that appear on the current page
of the report, instead of displaying the default filtered number
of records and total number of records. For example, the pagination
bar on the first page of an active report might display the following
sample values:
1-25 records, Page 1 of 4
You can display the range of records that appear on
a page by creating a JavaScript file that overwrites the default
display. For details, see Displaying the Range of Records on a Page.
- Suppress the display
of the pagination bar. For details, see Suppressing the Display of the Pagination Bar.
x
Determining the Number of Rows Per Page and Styling Characteristics
This topic describes the syntax for determining the number of
rows displayed per page and the styling characteristics of the record
status and page navigation bar.
x
Syntax: How to Determine the Number of Rows Per Page and Styling Characteristics
Use the appropriate syntax that
follows.
- To control the number
of rows displayed per page in the output, use
TYPE=REPORT, LINES-PER-PAGE={n|UNLIMITED},$
where:
-
n
-
Specifies the number of rows displayed
on each HTML page. The default value is 20 rows when the LINES-PER-PAGE
option is used. Otherwise, the server default value is 57 rows.
- UNLIMITED
-
Specifies that you want to show all
the results on one HTML page.
You
can also issue the command within a request using:
ON TABLE SET LINES {n|UNLIMITED}
- To control the position,
justification, and colors of the record status and page navigation
bar, use
TYPE=REPORT, OBJECT=STATUS-AREA,PAGE-LOCATION={TOP|BOTTOM},JUSTIFY={LEFT|CENTER|RIGHT},
COLOR=textcolor, BACKCOLOR=backcolor,$
where:
- STATUS-AREA
-
Specifies the object, which is the
record status and page navigation bar.
The record status and page navigation bar show row and page
information, where your cursor is positioned, relative to the total
number of rows and pages in the report (for example, 10 of 100 records
(10.00%), Page 1 of 3).
- PAGE-LOCATION
-
Specifies the location of the record
status and page navigation bar, which is either at the top of the
report above the report header, or at the bottom of the report below the
report footer. TOP is the default value.
- JUSTIFY
-
Specifies whether you want the information
in the record status and page navigation bar to be centered, left-justified,
or right-justified. CENTER is the default value.
-
textcolor
-
Specifies the text color for the
record status and page navigation bar. BLACK is the default value.
Valid values can be either a preset color name in single quotes,
for example, 'GREEN', or the RGB (red green blue) numeric values,
for example, RGB(153 153 153).
-
backcolor
-
Specifies the background color for
the record status and page navigation bar. SILVER is the default
value. Valid values can be either a preset color name in single quotes,
for example, 'WHITE', or the RGB (red green blue) numeric values,
for example, RGB(51 153 102).
The
pagination options are not available with the expandable report
view option.
x
Displaying the Range of Records on a Page
By default, the strings and parameters
used to display the pagination bar are stored in the irpstr.js file.
The irpstr.js file is located in the \home\etc directory on the WebFOCUS
Reporting Server.
Starting with WebFOCUS Reporting Server Release 7.7 Version 04,
you must create an irpcusf.js file in your application folder and
add all your custom contents to this JavaScript file. This ensures
that there will not be any issues with the different versions of
JavaScript used between releases.
Upgrade requirement:
If an irpstr.js file created prior to WebFOCUS Reporting Server
Release 7.7 Version 04 already exists in your application folder,
you must remove it and move the custom contents into the irpcusf.js
file. The syntax used in the string section of the JavaScript file
remains unchanged in the irpstr.js file. You can verify the syntax
with the string section in the irpstr.js file found in the \home\etc
directory of the WebFOCUS Reporting Server.
Here is a summary of the steps that you follow.
- Search for irp*.js
files in your ibi\apps folder.
- Rename the files.
Do not delete them, as you need the customized contents from
these files.
- In your application
folder, create a new, empty text file, and name it irpcusf.js.
- In the irpcusf.js file, enter the code that customizes the pagination bar.
When a customized JavaScript file exists in an application folder,
the default pagination bar strings and parameters are overwritten
by the strings and parameters specified in the customized file.
You can have different customized irpcusf.js
files for each of your applications. This feature enables you to
update the active reports and active dashboards in your existing applications
with different pagination bars that meet your specific application needs.
x
Procedure: How to Display the Range of Records on a Page
-
In your application folder, create a new,
empty text file, and name it irpcusf.js.
Important: The
application folder must be the same one that contains the active
report or active dashboard. For example, from the Projects on localhost
area in Developer Studio, create the irpcusf.js file in the Other
subfolder of the project folder.
-
Using a text editor, open the irpstr.js file
in your application folder, and copy the following code into it. Combine the second and third lines shown here so that they are a single line.
ibiMsgStr={
'paglinetext':"<%^%frcs-%lrcs records, Page %inds of %pgs%>
<span id='smsg%tn'><\/span>"
};
-
Save the irpcusf.js
file, and close the text editor.
-
Run an active
report with format AHTML.
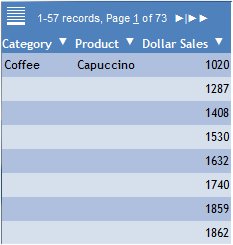
The pagination bar is displayed as follows.
By default, 57 records are displayed on each page. As a result,
the customized pagination bar displays a range of 1-57 records on
the first page.
-
To change the default number of records displayed on each page,
open the active report in Report Painter or InfoAssist.
-
Follow the steps for the tool that you are using.
-
If you are using Report Painter:
-
If you are using InfoAssist:
- With the active report
open in InfoAssist, click the Format tab.
- Click the Features group.
- Click the Active
Report Options button.
- Under Page Options
on the General tab, select the desired value from the Records Per
Page drop-down list: All, 10, 20, 30, 40, or 50. Alternatively,
you can type a value in the input field. The default value is 57.
- You can also set
other characteristics in the Page Information section under Page Options
on the General tab.
- Select Display
Page Information to display the pagination bar, or deselect
this check box to suppress the display of the pagination bar.
- Click the button
for the desired alignment of the pagination bar (left, center, or right).
- From the drop-down
list, select the desired location for the pagination bar (top row
or bottom row).
- Click OK on
the General tab.
-
Run the
active report.
The
pagination bar now displays 10 records per page, as shown in the
following image. Based on the styling characteristics supplied in Report Painter
, the pagination bar appears
at the bottom of the page, and the text inside the pagination bar
is left-justified.
Tip: You
can also specify the number of records to display per page when
a report is run. Click Show Records from
a drop-down menu on the report. In the following image, 5 Records
per page is selected.
x
Suppressing the Display of the Pagination Bar
You can suppress the display of the pagination bar using WebFOCUS
StyleSheet
code. This feature is available for active
reports with format AHTML, FLEX, or APDF.
ON TABLE SET STYLE *
TYPE=REPORT,
   OBJECT=STATUS-AREA,
   PAGE-LOCATION=OFF,
$
ENDSTYLE
Once you suppress the display of the pagination bar, you can
no longer navigate to a page after the first page if the number
of records in the report exceeds the records (lines) per page that
you set.
xUser-Controlled Options in an Active Technologies Report
The following options can be
implemented only from the user menus in the output of an active
report. Basic information for each of these options provides a more comprehensive
understanding of this type of report.
- Sorting
data
If the ALLOW-SORT option is enabled, you can sort columns
in either ascending or descending order. For string data types,
the sorting is alphabetical. For date data types, the sorting is
chronological.
When the report
view option is tabular, only single column sorts are supported. When
the report view option is expandable, an inner sort is also supported.
- Adding
visualization graphics to an HTML active report
If the ALLOW-VISUALIZE
option is enabled, you can display visualization graphics in a new
column inserted into the report to the right of the selected column.
Negative values appear with colored bars that extend to the left
of center, and positive values appear with colored bars that extend
to the right of center.
- Creating charts in
an active report
If the ALLOW-CHART option is enabled, you can
create charts using roll-up tables. All applied filters are respected,
and all calculation methods are available to create aggregation
charts. A selected BY sort field and a measure column are required.
There is also an option to open charts in separate browser windows.
- Exporting active
reports
If the ALLOW-EXPORT option is enabled, you can export
all data, or filtered data only. The export method only exports
data, not the JavaScript code, which makes exported reports static
without the interactive options available in an active report. The export
formats supported are: Save as HTML (formatting is preserved), XML
export to Excel (formatting is not preserved), and Save as CSV (formatting
is not preserved).
- Filtering or highlighting
data
If the ALLOW-FILTER option is enabled, you can filter or
highlight data. Filtering limits the output to display only data
that meets the criteria in the WHERE clause specified with the user
menus. Highlighting changes the color of the data in the output based
on the criteria in the WHERE clause specified with the user menus.
- Applying global filters
to multiple active reports
When multiple active reports are inserted
in the same HTML page, you can apply filters on all reports containing
a common BY sort field.
xControlling the Expiration of an Active Technologies Report
The AREXPIRE parameter enables you to specify when an
active report expires and the report output can no longer be displayed.
The syntax is
SET AREXPIRE = {yymmdd|xxxDAYS}where:
-
yymmdd
-
Is the expiration date in the format of a two-digit
year (yy), two-digit month (mm), and two-digit day
(dd). For example, if you want the report to expire after
June 30, 2013, specify the value 130630. Note that this is
the last valid date on which you can display the report. Starting
on July 1, 2013, you can no longer display it.
Use this option to set the expiration date for a report at run
time, or to set the expiration date for a saved report.
If you leave the report open in the browser, any user
interaction generates a check of the expiration date. The report
is disabled if it has expired.
-
xxx
-
Is the number of days from the current date
on which the report expires. Valid values are from 1 to 999.
This option does not apply to a report at run time.
Use this option to set the duration of a saved report, that is,
the length of time during which you can display the report.
For example, if you want the ability to display the
report for three days from the current date of August 1, specify
the value 3DAYS. You can display the report on August 1,
2, and 3. Starting on August 4, you can no longer display it.
You can also issue the command within a request using:
ON TABLE SET AREXPIRE {yymmdd|xxxDAYS}
xSetting a Password for an Active Technologies Report
The ARPASSWORD parameter enables you to set a password
that is required to view active report output. Prior to opening
the report output, the user is prompted to enter a password to unlock
the report.
The syntax is
SET ARPASSWORD = password
where:
-
password
-
Is a character string up to 32 characters in
length.
Only standard alphanumeric English characters
are allowed in the password for an active report in AHTML format.
National Language Support (NLS) characters are not allowed in the
password. Any NLS character in the password for an AHTML report
makes the password invalid.
The command can also be issued from within a request using:
ON TABLE SET ARPASSWORD password
xDisplaying Enhanced Images
The HTMLEMBEDIMG parameter on the SET command enables
you to embed an image in an Active Technologies report in HTML.
The syntax is
SET HTMLEMBEDIMG = {ON|OFF|AUTO}where:
- ON
-
Embeds the image in an Active Technologies
report in HTML using base-64 encoding. When the command is set to
ON, the HTML payload size of the Active Technologies report is smaller.
This feature is supported by Microsoft Internet Explorer version
8 and higher.
If you are replacing image files
for icons used in Active Technologies HTML, the size of each image
file is limited to 10 kilobytes (KB). The browser only supports
up to 32 KB of encoded images, and base-64 encoding triples the
actual image size. JPEG format is preferred, as it compresses the
files to the smallest size, but PNG is also supported.
- OFF
-
Embeds the image using the Active Technologies
image compression engine. Previous versions of an Active Technologies
report in HTML used this method.
-
AUTO
-
Embeds the image using both base-64 encoding
and the Active Technologies image compression engine. This is the
default value as of WebFOCUS Reporting Server Release 7.7 Version
04. This value supports Microsoft Internet Explorer version 6 and 7
browsers that do not support base-64 encoded images. The HTML payload
size of the Active Technologies report increases by default, as
the same images are embedded twice in the report.
You can also issue the command from a request using:
ON TABLE SET HTMLEMBEDIMG {ON|OFF|AUTO}
xDisplaying the Heading in a Rollup Table
When using a rollup table generated from a tabular active
report, you can either display the heading that is supplied by Active
Technologies, or display a custom heading that you supply in the
original tabular report procedure.
x
Syntax: How to Display the Heading in a Rollup Table
Use the following WebFOCUS StyleSheet syntax
ON TABLE SET STYLE *
TYPE=REPORT, ARDEFAULTHEAD={GENERATED|ORIGINAL},$
where:
- GENERATED
-
In the rollup table, this setting displays
the heading that is supplied by Active Technologies, whether or
not a custom heading is supplied in the original tabular report procedure.
If you do not supply a custom heading in the
original tabular report procedure, and you do not include the ARDEFAULTHEAD
attribute in the procedure, ARDEFAULTHEAD defaults to GENERATED.
- ORIGINAL
-
If you supply a custom heading in the original
tabular report procedure, this setting displays the custom heading
in the rollup table. If you do not supply a custom heading in the
original tabular report procedure, this setting displays the heading
supplied by Active Technologies.
If you
supply a custom heading in the original tabular report procedure,
but you do not include the ARDEFAULTHEAD attribute in the procedure,
the rollup table automatically displays the custom heading, that
is, ARDEFAULTHEAD defaults to ORIGINAL. To display the heading supplied
by Active Technologies, you must specify ARDEFAULTHEAD=GENERATED.
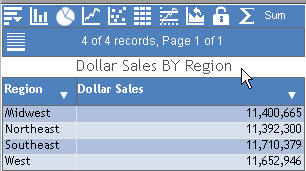
Example: Displaying the Heading Supplied by Active Technologies
Consider the following tabular report procedure:
TABLE FILE GGSALES
SUM UNITS DOLLARS BUDDOLLARS
BY REGION
HEADING
"ABC COMPANY CONFIDENTIAL"
ON TABLE PCHOLD FORMAT FLEX
ON TABLE SET STYLE *
.
.
.
ENDSTYLE
END
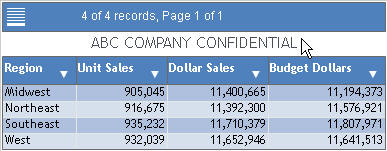
In this example, the procedure contains
a custom heading, ABC COMPANY CONFIDENTIAL. ARDEFAULTHEAD is not
included in the WebFOCUS StyleSheet code. By default, the tabular
report and the rollup table display the custom heading from the
tabular report procedure, as shown in the following two images.
The tabular report is:
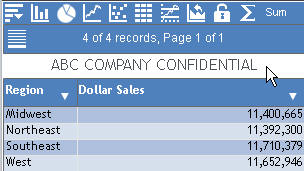
By default, the rollup table generated
from the tabular report is:
To display the heading supplied by
Active Technologies in the rollup table, you must add ARDEFAULTHEAD=GENERATED
to the tabular report procedure:
TABLE FILE GGSALES
SUM UNITS DOLLARS BUDDOLLARS
BY REGION
HEADING
"ABC COMPANY CONFIDENTIAL"
ON TABLE PCHOLD FORMAT FLEX
ON TABLE SET STYLE *
TYPE=REPORT, ARDEFAULTHEAD=GENERATED,$
ENDSTYLE
END
The following is the rollup table
generated from the tabular report:
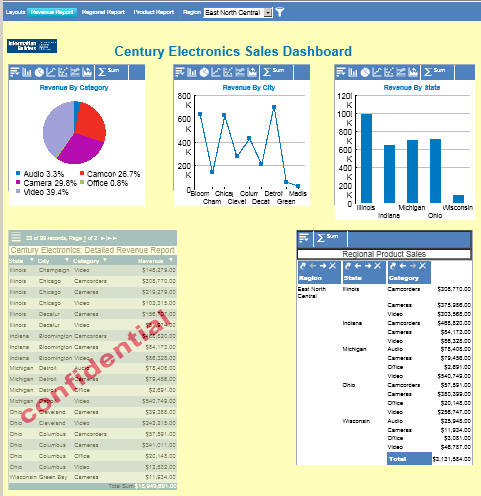
xSetting the ALPHA Background Color of an Active Technologies Report
You can set the ALPHA background color of an active
report or chart, and each report or chart object on an active dashboard,
so that the color is transparent. The ALPHA background color includes
the background color of the data in the report or chart, and alternating
background colors. This capability enables you to place an image
in the background of a report or chart. For example, you can add
a watermark behind a report.
This feature applies to all Active Technologies output formats
(AHTML, FLEX, and APDF).
In the remainder of this topic, the terminology active report or report includes
active chart.
In the following example, the ALPHA background color of the tabular
report on the left of the active dashboard is set so that the color
is transparent. The image of the message confidential is
placed in the background of the tabular report.
x
Syntax: How to Set the ALPHA Background Color in a TABLE or GRAPH Request
For a stand-alone active report, use the following WebFOCUS
StyleSheet syntax
ON {TABLE|GRAPH} SET STYLE *
TYPE=REPORT, ALPHA=alpha,$
TYPE=REPORT, OBJECT=IMAGE, IMAGE=image_file, POSITION=(x y),$
where:
-
alpha
-
Is a value from 0 to 100. It controls the
transparency of the background color of the report.
-
image_file
-
Is the name of the image file that you
want to place in the background of the report. The image may be
a watermark. GIF, JPG, and PNG image formats are supported.
-
x
-
Is the position of the image from the left
edge of the report, in the units of measurement set for the report
(for example, inches, centimeters, or points). You can set the units
of measurement for a report using the UNITS keyword in your WebFOCUS code
or using a graphical tool, such as Report Painter or InfoAssist.
For more information, see the applicable reporting language and
reporting tools manuals.
-
y
-
Is the position of the image from the top
edge of the report, in the units of measurement set for the report.
The following example sets the ALPHA
background color of an active report to 50.
ON TABLE SET STYLE *
TYPE=REPORT, ALPHA=50,$
TYPE=REPORT, OBJECT=IMAGE, IMAGE=confidential.png, POSITION=(1 1),$
x
Syntax: How to Set the ALPHA Background Color in a COMPOUND Request
Use the following syntax
COMPONENT='name_of_report',
.
.
.
ALPHA=alpha,$
where:
-
name_of_report
-
Is the name of the report.
-
alpha
-
Is a value from 0 to 100. It controls the
transparency of the background color of the report.
An example is:
COMPONENT='report1', TEXT='report1', TOC-LEVEL=2, POSITION=(1.250 0.522),
DIMENSION=(6.250 5.525), METADATA='Z-INDEX: 100; POSITION: absolute;
WIDTH: 6.25in; HEIGHT: 5.525in; TOP: 0.522in; LEFT: 1.25in', ALPHA=50,$
OBJECT=IMAGE, NAME='watermark', IMAGE=confidential.png,
POSITION=(2.186 1.454), DIMENSION=(8.150 6.150), METADATA='Z-INDEX: 100;
POSITION: absolute; WIDTH: 4.15in; HEIGHT: 3.15in; TOP: 1.454in;
LEFT: 2.186in',$
The following two examples
show the varying transparency generated from different values of
ALPHA. In the first example, the value of ALPHA is 40.

In the
next example, the value of ALPHA is 60.
xCustomizing Icons for an Active Technologies Report or Dashboard
Eight sets of icons for Active Technologies are packaged
with the product. You can specify the set of icons that will be
applied to an active report, chart, or dashboard by adding WebFOCUS
code to the report, chart, or dashboard procedure.
In addition to specifying one of the packaged icon sets, you
can:
- Create your own set
of icons by customizing the combination of packaged icons.
- Create new icons
and add your own custom icon set to your application folder.
For details on creating your own custom icon set and applying
it to an active report, chart, or dashboard, see Creating a Custom Icon Set for an Active Technologies Report or Dashboard.
x
Syntax: How to Customize Icons for an Active Technologies Report or Dashboard
Use one of the following
SET ARICONSET={DEFAULT|WHITE|WHITE2|REVERSE|REVERSE2|BLUE|BLUE2|ORIGINAL}
or
ON TABLE SET ARICONSET
   {DEFAULT|WHITE|WHITE2|REVERSE|REVERSE2|BLUE|BLUE2|ORIGINAL}
or
ON TABLE SET STYLE *
TYPE=REPORT, ARICONSET={DEFAULT|WHITE|WHITE2|REVERSE|REVERSE2|BLUE|BLUE2|ORIGINAL},$
where:
-
DEFAULT
-
Indicates the standard combination of icons.
It uses icons in dark blue, except that the active tabular report
menu drop-down icon, filter icon, window title bar icons, and pivot
icons are in white. This is the default value.
Note: A pivot icon that represents
an option that is currently inactive is in gray. An example is the
inactive option to move a leftmost column on a pivot table farther
to the left. This feature applies to all the icon sets.
- WHITE
-
Indicates that all the icons are white.
- WHITE2
-
Indicates that all the icons are white,
except that the window resize icon is dark blue.
- REVERSE
-
Indicates a reverse combination of icons.
It uses icons in white, except that the active tabular report menu
drop-down icon, filter icon, window title bar icons, window resize
icon, and pivot icons are in dark blue.
- REVERSE2
-
Indicates the same combination of icons
as REVERSE, except that the filter icon is white.
- BLUE
-
Indicates that all the icons are dark blue.
- BLUE2
-
Indicates that all the icons are dark blue,
except that the filter icon is white.
- ORIGINAL
-
Indicates the original set of Active Technologies
multi-colored icons.
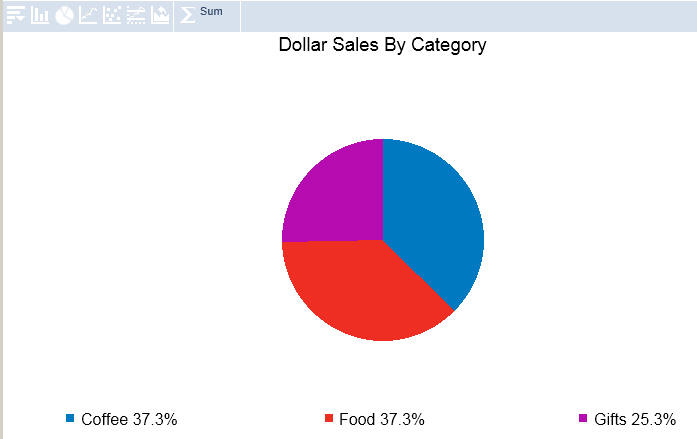
For example, the following code
ON TABLE SET STYLE *
TYPE=REPORT, ARICONSET=WHITE,$
is included
in the procedure that generates the following chart. All the icons
on the chart are white.
xStyling an Active Technologies Report or Dashboard Using Cascading Style Sheets
A default set of styles for an active report or dashboard
with the AHTML, FLEX, or APDF output format is supplied with the
product in a JavaScript file. Using cascading style sheets (CSS),
you can define your own custom styles that will be applied to an
active report or dashboard. You can then refer to your custom styles
by adding WebFOCUS code to the report or dashboard procedure.
To define your own custom styles, do the following:
- Create a JavaScript
configuration file named irpcfgu.js in your application folder.
- An original JavaScript
configuration file, named irpcfg.js, is packaged with the product.
Copy the contents of the style section from the original configuration
file (irpcfg.js) into the style section of irpcfgu.js.
- Rename the "default"
style section of the irpcfgu.js file. Assign a unique, descriptive
name, such as "mystyle".
- Customize the "mystyle"
section of the irpcfgu.js file.
- Refer to the "mystyle"
section of the irpcfgu.js file from your WebFOCUS procedure.
For details on defining custom styles in the irpcfgu.js file
and applying them to an active report or dashboard, see Defining Custom Styles for an Active Technologies Report or Dashboard.
x
Syntax: How to Apply Custom Styles to an Active Technologies Report or Dashboard
Use one of the following
SET ARSTYLESET={default|custom_style_name}
or
ON TABLE SET ARSTYLESET
   {default|custom_style_name}
or
ON TABLE SET STYLE *
TYPE=REPORT,
   ARSTYLESET={default|custom_style_name},$
where:
-
default
-
Is the name of the section in the supplied
irpcfg.js file that defines the default styles for an active report
or dashboard when no style sheet is specified in the report or dashboard
procedure. This is the default value.
-
custom_style_name
-
Is the name of the section in the irpcfgu.js
file that contains the custom styles for an active report or dashboard.
The name can be up to 48 characters long.
xUsage Notes for WebFOCUS
Commands and Features
The following apply when you use active reports.
Text Wrapping in a Tabular Active Technologies Report
Different types of browsers handle text wrapping differently
in the cells of a tabular active report when you do not specify
an explicit text wrapping option in the report procedure.
For more information on the available text wrapping options,
see the Creating Reports With WebFOCUS Language manual.
How a Browser Handles a Hyphen in Tabular Active Technologies Report Data
When displaying data in a tabular active report, different browsers
handle a hyphen (-) in the data in different ways.
For example, assume that the wrap and width are set for a column
in a tabular active report that contains the following data:
Marketing Supervisor (MS01224-1212)
If the column is not wide enough to accommodate the length of
this data:
- Internet Explorer
9 splits the single string (MS01224-1212) into the two strings (MS01224-
and 1212) in an attempt to wrap the data.
- Mozilla Firefox keeps
the single string (MS01224-1212) as one word and expands the column
width to accommodate it.
If there is a space before and after
the hyphen, as follows,
Marketing Supervisor (MS01224 - 1212)
Mozilla Firefox splits the data to respect the column
width.
For more information on the WebFOCUS StyleSheet attributes that
affect column wrapping (WRAP and SQUEEZE), see the Creating
Reports With WebFOCUS Language manual.
Unsupported Commands and Features
The following is a list of commands and features that are not
supported for HTML active reports:
- OVER, including Financial
Modeling Language (FML)
- PAGE-BREAK
- RECAP
- SKIP-LINE
- HTMLCSS
- Calling an external
cascading style sheet (CSS) file to style reports
- BORDER
- OLAP
- GRAPHLOOK,
including conditional styling