Manipulating Display Fields With Prefix Operators
You can use prefix operators
to perform calculations directly on the values of fields.
Note: Unless you change a column or ACROSS title with
an AS phrase, the prefix operator is automatically added to the
title. Without an AS phrase, the column title is constructed using
the prefix operator and either the field name or the TITLE attribute
in the Master File (if there is one):
- If there is no TITLE
attribute, the field name is used.
- If there is a TITLE
attribute in the Master File, the choice between using the field name
or the TITLE attribute depends on the value of the TITLES parameter:
- If SET TITLES =
ON, the TITLE attribute is used.
- If SET TITLES =
OFF or NOPREFIX, the field name is used.
For a list of prefix operators and their functions, see Functions You Can Perform With Prefix Operators.
x
This topic describes basic syntax and notes for using
prefix operators.
x
Syntax: How to Use Prefix Operators
Each prefix operator is applied to a
single field, and affects only that field.
{SUM|COUNT} prefix.fieldname AS 'coltitle'
{PRINT|COMPUTE} RNK.byfieldwhere:
- prefix
- Is any prefix operator.
- fieldname
- Is the name of the field to be displayed in the report.
- 'coltitle'
- Is the column title for the report column, enclosed in single
quotation marks.
- byfield
- Is the name of a vertical sort field to be ranked in the report.
x
Reference: Usage Notes for Prefix Operators
- Because PRINT
and LIST display individual field values, not an aggregate value,
they are not used with prefix operators, except TOT.
- To sort by
the results of a prefix command, use the phrase BY TOTAL to aggregate and
sort numeric columns simultaneously. For details, see Sorting Tabular Reports.
- The WITHIN
phrase is very useful when using prefixes.
- You can use
the results of prefix operators in COMPUTE commands.
- With the exception
of CNT. and PCT.CNT., resulting values have the same format as the
field against which the prefix operation was performed.
- Text fields
can only be used with the FST., LST., and CNT. prefix operators.
- PCT., TOT., PCT.CNT.,
RNK., and RPCT. are not supported with TABLEF and should
not be used with TABLEF.
x
Reference: Functions You Can Perform With Prefix Operators
The following table lists prefix operators
and describes the function of each.
|
Prefix
|
Function
|
|---|
ASQ. |
Computes the average sum of squares for
standard deviation in statistical analysis.
|
AVE. |
Computes the average value of the field.
|
CNT. |
Counts the number of occurrences of the
field. The data type of the result is always Integer.
|
CNT.DST. |
Counts the number of distinct values within
a field.
|
CT. |
Produces a cumulative total of the specified
field. This operator only applies when used in subfootings. For details, see Using Headings, Footings, Titles, and Labels.
|
DST. |
Determines the total number of distinct
values in a single pass of a data source.
|
FST. |
Generates the first physical instance of
the field. Can be used with numeric or text fields.
|
LST. |
Generates the last physical instance of
the field. Can be used with numeric or text fields.
|
MAX. |
Generates the maximum value of the field.
|
MDE. |
Computes the mode of the field values.
|
MDN. |
Computes the median of the field values.
|
MIN. |
Generates the minimum value of the field.
|
PCT. |
Computes a field percentage based on the
total values for the field. The PCT operator can be used with detail
as well as summary fields.
|
PCT.CNT. |
Computes a field percentage based on the
number of instances found. The format of the result is always F6.2
and cannot be reformatted.
|
RNK. |
Ranks the instances of a BY sort field in
the request. Can be used in PRINT commands, COMPUTE commands, and
IF or WHERE TOTAL tests.
|
ROLL. |
Recalculates values on summary lines using
the aggregated values from lower level summary lines.
|
RPCT. |
Computes a field percentage based on the
total values for the field across a row.
|
ST. |
Produces a subtotal
value of the specified field at a sort break in the report. This
operator only applies when used in subfootings. For details,
see Using Headings, Footings, Titles, and Labels.
|
SUM. |
Sums the field values.
|
TOT. |
Totals the field values for use in a heading
(includes footings, subheads, and subfoots).
|
xAveraging Values of a Field
The AVE. prefix computes the average value of a particular field.
The computation is performed at the lowest sort level of the display
command. It is computed as the sum of the field values within a
sort group divided by the number of records in that sort group.
If the request does not include a sort phrase, AVE. calculates the
average for the entire report.
Example: Averaging Values of a Field
This request calculates the average
number of education hours spent in each department.
TABLE FILE EMPLOYEE
SUM AVE.ED_HRS BY DEPARTMENT
END
The following shows the
output of the request.
            AVE
DEPARTMENT  ED_HRS
----------  ------
MIS          38.50
PRODUCTION   20.00
xAveraging the Sum of Squared Fields
The ASQ. prefix computes the average
sum of squares, which is a component of the standard deviation in
statistical analysis (shown as a formula in the following image).
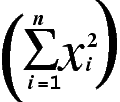
If the field format is integer and you get a large set of numbers,
the ASQ. result may be negative as a result of field overflow.
Example: Averaging the Sum of Squared
Fields
This request calculates
the sum and the sum of squared fields for the DELIVER_AMT field.
TABLE FILE SALES
SUM DELIVER_AMT AND ASQ.DELIVER_AMT
BY CITY
END
The following shows the
output of the request.
                              ASQ
CITY             DELIVER_AMT  DELIVER_AMT
----             -----------  -----------
NEW YORK                 300          980
NEWARK                    60          900
STAMFORD                 430         3637
UNIONDALE                 80         1600
xCalculating Maximum and Minimum Field Values
The prefixes MAX. and MIN. produce the maximum and minimum values,
respectively, within a sort group. If the request does not include
a sort phrase, MAX. and MIN. produce the maximum and minimum values
for the entire report.
Example: Calculating Maximum and Minimum
Field Values
This report request
calculates the maximum and minimum values of SALARY.
TABLE FILE EMPLOYEE
SUM MAX.SALARY AND MIN.SALARY
END
The following shows the
output of the request.
    MAX              MIN
    SALARY           SALARY
    ------           ------
$29,700.00        $8,650.00
xCalculating Median and Mode Values for a Field
You can use the MDN. (median) and MDE. (mode) prefix
operators, in conjunction with an aggregation display command (SUM,
WRITE) and a numeric or smart date field, to calculate the statistical
median and mode of the values in the field.
These calculations are not supported in a DEFINE command, in
WHERE or IF expressions, or in a summary command. If used in a multi-verb
request, they must be used at the lowest level of aggregation.
The median is the middle value (50th percentile). If there is
an even number of values, the median is the average of the middle
two values. The mode is the value that occurs most frequently within
the set of values. If no value occurs more frequently than the others,
MDE. returns the lowest value.
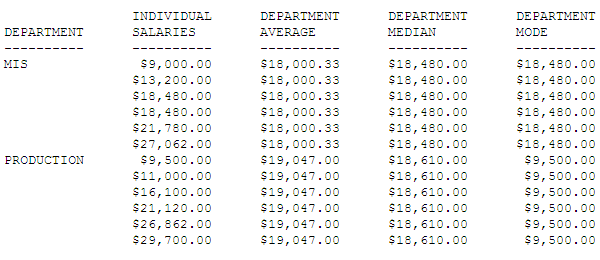
Example: Calculating the Median and Mode
The following request against the EMPLOYEE
data source displays the current salaries and calculates the average
(mean), median, and mode within each department.
TABLE FILE EMPLOYEE
SUM CURR_SAL AS 'INDIVIDUAL,SALARIES'
AVE.CURR_SAL WITHIN DEPARTMENT AS 'DEPARTMENT,AVERAGE'
MDN.CURR_SAL WITHIN DEPARTMENT AS 'DEPARTMENT,MEDIAN'
MDE.CURR_SAL WITHIN DEPARTMENT AS 'DEPARTMENT,MODE'
BY DEPARTMENT
BY CURR_SAL NOPRINT
BY LAST_NAME NOPRINT BY FIRST_NAME NOPRINT
ON TABLE SET PAGE NOPAGE
END
Both departments have
an even number of employees. For the MIS department, the two middle
values are the same, making that value ($18,480.00) both the median
and the mode. For the PRODUCTION department, the median is the average
of the two middle values ($16,100.00 and $21,120.00) and, since
there are no duplicate values, the mode is the lowest value ($9,500.00).
xCalculating Column and Row Percentages
For each individual value in a column, PCT. calculates what percentage
that field makes up of the column total value. You can control how
values are distributed down the column by sorting the column using
the BY phrase. The new column of percentages has the same format
as the original field.
You can also determine percentages for row values. For each individual
value in a row that has been sorted using the ACROSS phrase, the
RPCT. operator calculates what percentage it makes up for the total
value of the row. The percentage values have the same format as
the original field.
Example: Calculating Column Percentages
To calculate each employee share of
education hours, issue the following request:
TABLE FILE EMPLOYEE
SUM ED_HRS PCT.ED_HRS BY LAST_NAME
ON TABLE COLUMN-TOTAL
END
The output is:
                         PCT
LAST_NAME        ED_HRS  ED_HRS
---------        ------  ------
BANNING             .00     .00
BLACKWOOD         75.00   21.37
CROSS             45.00   12.82
GREENSPAN         25.00    7.12
IRVING            30.00    8.55
JONES             50.00   14.25
MCCOY               .00     .00
MCKNIGHT          50.00   14.25
ROMANS             5.00    1.42
SMITH             46.00   13.11
STEVENS           25.00    7.12

TOTAL            351.00  100.00
Since PCT. and RPCT. take
the same format as the field, the column may not always total exactly
100 because of the nature of floating-point arithmetic.
Example: Calculating Row Percentages
The following request calculates the
total units sold for each product (UNIT_SOLD column), and the percentage
that total makes up in relation to the sum of all products sold (RPCT.UNIT_SOLD
column) in each city.
TABLE FILE SALES
SUM UNIT_SOLD RPCT.UNIT_SOLD ROW-TOTAL
BY PROD_CODE
ACROSS CITY    WHERE
CITY EQ 'NEW YORK' OR 'STAMFORD'
END
The
output is:
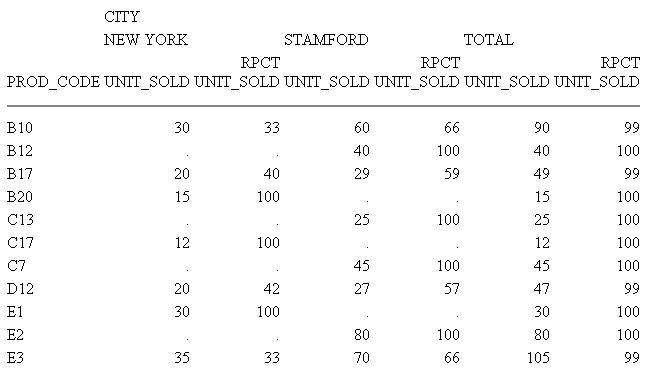
Because UNIT_SOLD has an integer format,
the columns created by RPCT. also have integer (I) formats. Therefore,
individual percentages may be truncated and the total percentage
may be less than 100%. If you require precise totals, redefine the
field with a format that declares decimal places (D, F).
xProducing a Direct Percent of a Count
When counting occurrences in a file,
a common reporting need is determining the relative percentages
of each row’s count within the total number of instances. You can
do this, for columns only, with the following syntax:
PCT.CNT.fieldname
The format is a decimal value of six digits with two decimal
places (F6.2).
Example: Producing a Direct Percent of
a Count
This request illustrates
the relative percentage of the values in the EMP_ID field for each
department.
TABLE FILE EMPLOYEE
SUM PCT.CNT.EMP_ID
BY DEPARTMENT
END
The output is:
| PCT.CNT |
DEPARTMENT
---------- | EMP_ID
------ |
MIS | 50.00 |
PRODUCTION | 50.00 |
xAggregating and Listing Unique Values
The distinct prefix operator (DST.) may be used to aggregate
and list unique values of any data source field. Similar in function
to the SQL COUNT, SUM, and AVG(DISTINCT col) column functions, it
permits you to determine the total number of distinct values in
a single pass of the data source.
The DST. operator can be used with the SUM, PRINT or COUNT commands,
and also in conjunction with the aggregate prefix operators SUM.,
CNT., and AVE. Multiple DST. operators are supported in TABLE and
TABLEF requests. They are supported in requests that use the BY,
ACROSS, and FOR phrases.
Note that in a request using the PRINT command and multiple DST
operators, you should issue the command SET PRINTDST=NEW. For more
information, see the Developing Reporting Applications manual.
x
Syntax: How to Use the Distinct Operator
command DST.fieldname
or
SUM [operator].DST.fieldname
where:
- command
- Is SUM, PRINT, or COUNT.
- DST.
- Indicates the distinct operator.
- fieldname
- Indicates the display-field object or field name.
- operator
- Indicates SUM., CNT., or AVE.
Example: Using the Distinct Operator
The procedure requesting a count of
unique ED_HRS values is either:
TABLE FILE EMPLOYEE
SUM CNT.DST.ED_HRS
END
or
TABLE FILE EMPLOYEE
COUNT DST.ED_HRS
END
The output is:
COUNT
DISTINCT
ED_HRS
--------
9Notice that the count includes records for both
employees with the last name SMITH, but excludes the second records
for values 50.00, 25.00, and .0, resulting in nine unique ED_HRS
values.
Example: Counting Distinct Field Values With Multiple Display Commands
The following request against the GGSALES
data source counts the total number of records by region, then the
number of records, distinct categories, and distinct products by region
and by state. The DST or CNT.DST operator can be used only with
the last display command:
TABLE FILE GGSALES
COUNT CATEGORY AS 'TOTAL,COUNT'
BY REGION
SUM CNT.CATEGORY AS 'STATE,COUNT'
CNT.DST.CATEGORY CNT.DST.PRODUCT
BY REGION
BY ST
ENDThe output is:
COUNT COUNT
TOTAL STATE DISTINCT DISTINCT
Region COUNT State COUNT CATEGORY PRODUCT
------ ----- ----- ----- -------- --------
Midwest 1085 IL 362 3 9
MO 361 3 9
TX 362 3 9
Northeast 1084 CT 361 3 10
MA 360 3 10
NY 363 3 10
Southeast 1082 FL 361 3 10
GA 361 3 10
TN 360 3 10
West 1080 CA 721 3 10
WA 359 3 10
x
Reference: Distinct Operator Limitations
- If you reformat
a column created using COUNT DST. or the CNT.DST operator, you must
reformat it to an integer (I) data type. If you specify another
data type, the following error occurs:
(FOC950) INVALID REFORMAT OPTION WITH COUNT OR CNT.
- The following
error occurs if you use the prefix operators CNT., SUM., and AVE.
with any other display command:
(FOC1853) CNT/SUM/AVE.DST CAN ONLY BE USED WITH AGGREGATION VERBS
- The following
error occurs if you use DST. in a MATCH command:
(FOC1854) THE DST OPERATOR IS ONLY SUPPORTED IN TABLE REQUESTS
- The following
error occurs if you reformat a BY field (when used with the PRINT command,
the DST.fieldname becomes a BY field):
(FOC1862) REFORMAT DST.FIELD IS NOT SUPPORTED WITH PRINT
- The following
error occurs if you use the DST. operator with NOSPLIT:
(FOC1864) THE DST OPERATOR IS NOT SUPPORTED WITH NOSPLIT
- The following
error occurs if you use a multi-verb request, SUM DST.fieldname BY field PRINT fld BY fld (a
verb object operator used with the SUM command must be at the lowest
level of aggregation):
(FOC1867) DST OPERATOR MUST BE AT THE LOWEST LEVEL OF AGGREGATION
- The DST. operator
may not be used as part of a HEADING or a FOOTING.
xRetrieving First and Last Records
FST. is a prefix that displays the first
retrieved record selected for a given field. LST. displays the last
retrieved record selected for a given field.
When using the FST. and LST. prefix operators,
it is important to understand how your data source is structured.
- If the record is in a segment with values
organized from lowest to highest (segment type S1), the first logical
record that the FST. prefix operator retrieves is the lowest value
in the set of values. The LST. prefix operator would, therefore,
retrieve the highest value in the set of values.
- If the record
is in a segment with values organized from highest to lowest (segment type
SH1), the first logical record that the FST. prefix operator retrieves
is the highest value in the set of values. The LST. prefix operator
would, therefore, retrieve the lowest value in the set of values.
For more information on segment types and file design, see the Describing Data With WebFOCUS Language manual. If you wish
to reorganize the data in the data source or restructure the data
source while reporting, see Improving Report Processing.
Example: Retrieving the First Record
The following request retrieves the
first logical record in the EMP_ID field:
TABLE FILE EMPLOYEE
SUM FST.EMP_ID
END
The output is:
FST
 EMP_ID
 ------
071382660
Example: Segment Types and Retrieving Records
The EMPLOYEE data source contains the
DEDUCT segment, which orders the fields DED_CODE and DED_AMT from
lowest value to highest value (segment type of S1). The DED_CODE
field indicates the type of deduction, such as CITY, STATE, FED,
and FICA. The following request retrieves the first logical record
for DED_CODE for each employee:
TABLE FILE EMPLOYEE
SUM FST.DED_CODE
BY EMP_ID
END
The output is:
           FST
EMP_ID     DED_CODE
------     --------
071382660  CITY
112847612  CITY
117593129  CITY
119265415  CITY
119329144  CITY
123764317  CITY
126724188  CITY
219984371  CITY
326179357  CITY
451123478  CITY
543729165  CITY
818692173  CITY
Note, however, the command SUM LST.DED_CODE
would have retrieved the last logical record for DED_CODE for each
employee.
If the record is in a segment with values organized
from highest to lowest (segment type SH1), the first logical record
that the FST. prefix operator retrieves is the highest value in
the set of values. The LST. prefix operator would therefore retrieve
the lowest value in the set of values.
For
example, the EMPLOYEE data source contains the PAYINFO segment,
which orders the fields JOBCODE, SALARY, PCT_INC, and DAT_INC from
highest value to lowest value (segment type SH1). The following
request retrieves the first logical record for SALARY for each employee:
TABLEF FILE EMPLOYEE
SUM FST.SALARY
BY EMP_ID
END
The output is:
                    FST
EMP_ID              SALARY
------              ------
071382660       $11,000.00
112847612       $13,200.00
117593129       $18,480.00
119265415        $9,500.00
119329144       $29,700.00
123764317       $26,862.00
126724188       $21,120.00
219984371       $18,480.00
326179357       $21,780.00
451123478       $16,100.00
543729165        $9,000.00
818692173       $27,062.00
However, the command SUM LST.SALARY
would have retrieved the last logical record for SALARY for each
employee.
xSumming and Counting Values
You can count occurrences and summarize values with one display
command using the prefix operators CNT., SUM., and TOT. Just like
the COUNT command, CNT. counts the occurrences of the field it prefixes.
Just like the SUM command, SUM. sums the values of the field it
prefixes. TOT. sums the values of the field it prefixes when used
in a heading (including footings, subheads, and subfoots).
Example: Counting Values With CNT
The following request counts the occurrences
of PRODUCT_ID, and sums the value of UNIT_PRICE.
TABLE FILE GGPRODS
SUM CNT.PRODUCT_ID AND UNIT_PRICE
END
The output is:
Product
Code        Unit
COUNT       Price
-------     -----
     10    660.00
Example: Summing Values With SUM
The following request counts the occurrences
of PRODUCT_ID, and sums the value of UNIT_PRICE.
TABLE FILE GGPRODS
COUNT PRODUCT_ID AND SUM.UNIT_PRICE
END
The output is:
Product
Code        Unit
COUNT       Price
-------     -----
     10    660.00
Example: Summing Values With TOT
The following request uses the TOT prefix
operator to show the total of current salaries for all employees.
TABLE FILE EMPLOYEE
PRINT LAST_NAME
BY DEPARTMENT
ON TABLE SUBFOOT
"Total salaries equal: <TOT.CURR_SAL"
END
The output is:
DEPARTMENT  LAST_NAME
----------  ---------
MIS         SMITH
            JONES
            MCCOY
            BLACKWOOD
            GREENSPAN
            CROSS
PRODUCTION  STEVENS
            SMITH
            BANNING
            IRVING
            ROMANS
            MCKNIGHT
Total salaries equal:     $222,284.00
xRanking Sort Field Values With RNK.
RANKED BY fieldname, when used in a sort phrase in a TABLE
request, not only sorts the data by the specified field, but assigns
a RANK value to the instances. The RNK. prefix operator also calculates
the rank while allowing the RANK value to be printed anywhere on
the page. You use this operator by specifying RNK.fieldname,
where fieldname is a BY field in the request.
The ranking process occurs after selecting and sorting records.
Therefore, the RNK. operator cannot be used in a WHERE or IF selection
test or in a virtual (DEFINE) field. However, RNK.fieldname can
be used in a WHERE TOTAL or IF TOTAL test or in a calculated (COMPUTE)
value. You can change the default column title for the rank field
using an AS phrase.
You can apply the RNK. operator to multiple sort fields, in which
case the rank for each BY field is calculated within its higher
level BY field.
x
Syntax: How to Calculate Ranks Using the RNK. Prefix Operator
In a PRINT command, COMPUTE expression,
or IF/WHERE TOTAL expression :
RNK.field ...
where:
- field
- Is a vertical (BY) sort field in the request.
Example: Ranking Within Sort Groups
The following request ranks years of
service within department and ranks salary within years of service
and department. Note that years of service depends on the value
of TODAY. The output for this example was valid when run in September,
2006:
DEFINE FILE EMPDATA
  TODAY/YYMD = &YYMD;
  YRS_SERVICE/I9 = DATEDIF(HIREDATE,TODAY,'Y');
END
TABLE FILE EMPDATA
PRINT SALARY
  RNK.YRS_SERVICE AS 'RANKING,BY,SERVICE'
  RNK.SALARY AS 'SALARY,RANK'
     BY DEPT
     BY HIGHEST YRS_SERVICE
     BY HIGHEST SALARY NOPRINT
WHERE DEPT EQ 'MARKETING' OR 'SALES'
ON TABLE SET PAGE NOPAGE
END
The output is:
                                                    RANKING
                                                    BY       SALARY
DEPT                  YRS_SERVICE           SALARY  SERVICE  RANK
----                  -----------           ------  -------  ------
MARKETING                      17       $55,500.00        1       1
                                        $55,500.00        1       1
                               16       $62,500.00        2       1
                                        $62,500.00        2       1
                                        $62,500.00        2       1
                                        $58,800.00        2       2
                                        $52,000.00        2       3
                                        $35,200.00        2       4
                                        $32,300.00        2       5
                               15       $50,500.00        3       1
                                        $43,400.00        3       2
SALES                          17      $115,000.00        1       1
                                        $54,100.00        1       2
                               16       $70,000.00        2       1
                                        $43,000.00        2       2
                               15       $43,600.00        3       1
                                        $39,000.00        3       2
                               15       $30,500.00        3       3
Example: Using RNK. in a WHERE TOTAL Test
The following request displays only
those rows in the highest two salary ranks within the years of service
category. Note that years of service depends on the value of TODAY. The
output for this example was valid when run in September, 2006:
DEFINE FILE EMPDATA
  TODAY/YYMD = &YYMD;
  YRS_SERVICE/I9 = DATEDIF(HIREDATE,TODAY,'Y');
END
TABLE FILE EMPDATA
PRINT LASTNAME FIRSTNAME RNK.SALARY
BY HIGHEST YRS_SERVICE BY HIGHEST SALARY
WHERE TOTAL RNK.SALARY LE 2
END
The output is:
                                                           RANK
YRS_SERVICE           SALARY  LASTNAME         FIRSTNAME   SALARY
-----------           ------  --------         ---------   ------
         17      $115,000.00  LASTRA           KAREN            1
                  $80,500.00  NOZAWA           JIM              2
         16       $83,000.00  SANCHEZ          EVELYN           1
                  $70,000.00  CASSANOVA        LOIS             2
         15       $62,500.00  HIRSCHMAN        ROSE             1
                              WANG             JOHN             1
                  $50,500.00  LEWIS            CASSANDRA        2
Example: Using RNK. in a COMPUTE Command
The following request sets a flag to Y for
records in which the salary rank within department is less than
or equal to 5 and the rank of years of service within salary and
department is less than or equal to 6. Otherwise, the flag has the
value N. Note that the years of service depends
on the value of TODAY. The output for this example was valid when
run in September, 2006:
DEFINE FILE EMPDATA
  TODAY/YYMD = &YYMD;
  YRS_SERVICE/I9 = DATEDIF(HIREDATE,TODAY,'Y');
END
TABLE FILE EMPDATA
PRINT RNK.SALARY RNK.YRS_SERVICE
COMPUTE FLAG/A1 = IF RNK.SALARY LE 5  AND RNK.YRS_SERVICE LE 6
    THEN 'Y' ELSE 'N';
BY DEPT BY SALARY BY YRS_SERVICE
WHERE DEPT EQ 'MARKETING' OR 'SALES'
ON TABLE SET PAGE NOPAGE
END
The output is:
                                                 RANK   RANK
DEPT                          SALARY YRS_SERVICE SALARY YRS_SERVICE FLAG
----                          ------ ----------- ------ ----------- ----
MARKETING                 $32,300.00          16      1           1 Y
                          $35,200.00          16      2           1 Y
                          $43,400.00          15      3           1 Y
                          $50,500.00          15      4           1 Y
                          $52,000.00          16      5           1 Y
                          $55,500.00          17      6           1 N
                                                      6           1 N
                          $58,800.00          16      7           1 N
                          $62,500.00          16      8           1 N
                                                      8           1 N
                                                      8           1 N
SALES                     $30,500.00          15      1           1 Y
                          $39,000.00          15      2           1 Y
                          $43,000.00          16      3           1 Y
                          $43,600.00          15      4           1 Y
                          $54,100.00          17      5           1 Y
                          $70,000.00          16      6           1 N
                         $115,000.00          17      7           1 N
xRolling Up Calculations on Summary Rows
Using SUMMARIZE
and RECOMPUTE, you can recalculate values at sort field breaks,
but these calculations use the detail data to calculate the value
for the summary line.
Using the ROLL. operator in conjunction with another prefix operator
on a summary line recalculates the sort break values using the values
from summary lines generated for the lower level sort break.
The operator combinations supported are:
- ROLL.SUM. (same as
ROLL.). Alphanumeric fields are supported with SUM. This returns
either the first or last value according to the SUMPREFIX parameter.
- ROLL.AVE.
- ROLL.MAX. (supported
with alphanumeric fields as well as numeric fields)
- ROLL.MIN. (supported
with alphanumeric fields as well as numeric fields)
- ROLL.FST. (supported
with alphanumeric fields as well as numeric fields)
- ROLL.LST. (supported with alphanumeric fields as well as numeric
fields)
- ROLL.CNT.
- ROLL.ASQ.
ROLL.prefix on a summary line indicates
that the prefix operation will be performed on the summary values
from the next lowest level of summary command.
If the ROLL. operator is used without another prefix operator,
it is treated as a SUM. Therefore, if the summary command for the
lowest BY field specifies AVE., and the next higher specifies ROLL.,
the result will be the sum of the averages. To get the average of
the averages, you would use ROLL.AVE at the higher level.
Note: With SUMMARIZE and SUB-TOTAL, the same calculations
are propagated to all higher level sort breaks.
x
Syntax: How to Roll Up Summary Values
BY field {SUMMARIZE|SUBTOTAL|SUB-TOTAL|RECOMPUTE} [ROLL.][prefix1.]
[field1 field2 ...|*] [ROLL.][prefix2.] [fieldn ...]
Or:
BY field
ON field {SUMMARIZE|SUBTOTAL|SUB-TOTAL|RECOMPUTE} ROLL.[prefix.]
[field1 field2 ...|*]
where:
- ROLL.
Indicates that the summary values should be calculated using
the summary values from the next lowest level summary command.
- field
Is a BY field in the request.
- prefix1, prefix2
Are prefix operators to use for the summary values. It can
be one of the following operators: SUM. (the default operator if
none is specified), AVE., MAX., MIN., FST., LST., CNT., ASQ.
- field1 field2 fieldn
Are fields to be summarized.
- *
Indicates that all fields, numeric and alphanumeric, should
be included on the summary lines. You can either use the asterisk
to display all columns or reference the specific columns you want
to display.
Example: Rolling Up an Average Calculation
The
following request against the GGSALES data source contains two sort
fields, REGION and ST. The summary command for REGION applies the
AVE. operator to the sum of the units value for each state.
TABLE FILE GGSALES
   SUM UNITS AS 'Inventory '
     BY REGION
   BY ST
   ON REGION SUBTOTAL      AVE.  AS 'Average'
   WHERE DATE GE 19971001
   WHERE REGION EQ 'West' OR 'Northeast'
   ON TABLE SET PAGE NOPAGE
   END
On the
output, the UNITS values for each state are averaged to calculate
the subtotal for each region. The UNITS values for each state are
also used to calculate the average for the grand total row.
Region       State  Inventory
------       -----  ----------
Northeast    CT          37234
             MA          35720
             NY          36248

Average Northeast
                         36400

West         CA          75553
             WA          40969

Average West
                         58261


TOTAL                    45144
The following version
of the request adds a summary command for the grand total line that
includes the ROLL. operator:
TABLE FILE GGSALES
   SUM UNITS AS 'Inventory '
     BY REGION
   BY ST
   ON REGION SUBTOTAL  AVE.  AS 'Average'
   WHERE DATE GE 19971001
   WHERE REGION EQ 'West' OR 'Northeast'
   ON TABLE SUBTOTAL ROLL.AVE. AS ROLL.AVE
   ON TABLE SET PAGE NOPAGE
   END
On the
output, the UNITS values for each state are averaged to calculate
the subtotal for each region, and those region subtotal values are
used to calculate the average for the grand total row:
Region       State  Inventory
  ------       -----  ----------
  Northeast    CT          37234
               MA          35720
               NY          36248

  Average Northeast
                           36400

  West         CA          75553
               WA          40969

  Average West
                           58261


  ROLL.AVE                 47330
Example: Propagating Rollups to Higher Level Sort Breaks
The
following request against the GGSALES data source has three BY fields.
The SUBTOTAL command for the PRODUCT sort field specifies AVE.,
and the SUMMARIZE command for the higher level sort field, REGION,
specifies ROLL.AVE.
TABLE FILE GGSALES
SUM UNITS
BY REGION
BY PRODUCT
BY HIGHEST DATE
WHERE DATE GE 19971001
  WHERE REGION EQ 'Midwest' OR 'Northeast'
  WHERE PRODUCT LIKE 'C%'
  ON PRODUCT SUBTOTAL AVE.
  ON REGION SUMMARIZE ROLL.AVE. AS ROLL.AVE
ON TABLE SET PAGE NOPAGE
END
On the output, the detail rows for each
date are used to calculate the average for each product. Because
of the ROLL.AVE. at the region level, the averages for each product
are used to calculate the averages for each region, and the region
averages are used to calculate the average for the grand total line:
Region       Product                 Date  Unit Sales
  ------       -------                 ----  ----------
  Midwest      Coffee Grinder    1997/12/01        4648
                                 1997/11/01        3144
                                 1997/10/01        1597

  *TOTAL PRODUCT Coffee Grinder                    3129

               Coffee Pot        1997/12/01        1769
                                 1997/11/01        1462
                                 1997/10/01        2346

  *TOTAL PRODUCT Coffee Pot                        1859

               Croissant         1997/12/01        7436
                                 1997/11/01        5528
                                 1997/10/01        6060

  *TOTAL PRODUCT Croissant                         6341
  ROLL.AVE Midwest                                 3776

  Northeast    Capuccino         1997/12/01        1188
                                 1997/11/01        2282
                                 1997/10/01        3675

  *TOTAL PRODUCT Capuccino                         2381

               Coffee Grinder    1997/12/01        1536
                                 1997/11/01        1399
                                 1997/10/01        1315

  *TOTAL PRODUCT Coffee Grinder                    1416

               Coffee Pot        1997/12/01        1442
                                 1997/11/01        2129
                                 1997/10/01        2082

  *TOTAL PRODUCT Coffee Pot                        1884

               Croissant         1997/12/01        4291
                                 1997/11/01        6978
                                 1997/10/01        4741

  *TOTAL PRODUCT Croissant                         5336
  ROLL.AVE Northeast                               2754


  TOTAL                                            3265
x
Reference: Usage Notes for ROLL.
- ROLL.prefix on
a summary line indicates that the prefix operation will be performed
on the summary values from the next lowest level of summary command.
- If no summary command
was issued at the level below the ROLL., and no other operator was
used in conjunction with the ROLL., a SUM. will be calculated. If
the lower level had no summary command and ROLL. was used with another
prefix operator (for example, ROLL.AVE.), the specified prefix operator
will be used. For example, ROLL.AVE. will become AVE.
- CNT. prefix shows
the number of data lines displayed, which is not affected by MULTILINES.
- ROLL.CNT. prefix shows
the number of summary lines displayed, which is affected by MULTILINES.