dataSubset: {
   startGroup: startnumber,
   stopGroup: stopgroup,
}
where:
- startnumber
Is a zero-based starting group number to show. The default value is undefined.
- stopgroup
Is a zero-based number identifying the first group that should not be shown. The default value is undefined.
The following request uses Dialogue Manager variables to enable the user to specify the data subset to draw:
GRAPH FILE WF_RETAIL_LITE
SUM COGS_US GROSS_PROFIT_US REVENUE_US DISCOUNT_US
ACROSS PRODUCT_CATEGORY
ON GRAPH PCHOLD FORMAT JSCHART
ON GRAPH SET LOOKGRAPH VBAR
ON GRAPH SET STYLE *
*GRAPH_JS
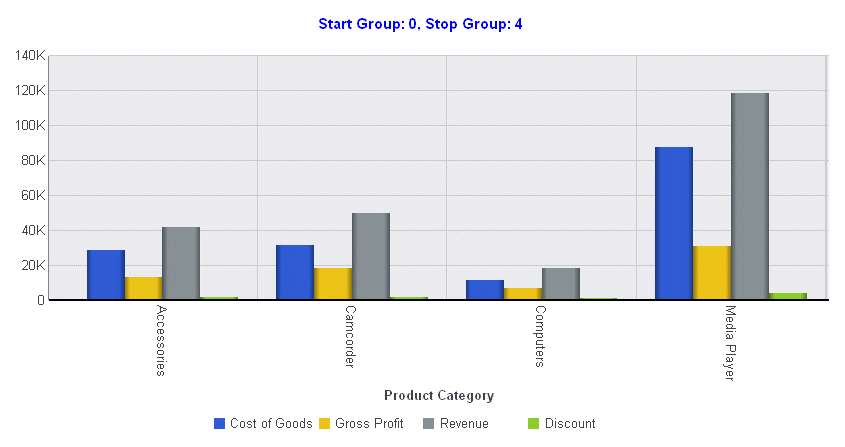
title: {visible: true, text: 'Start Group: &startg, Stop Group: &stopgp ', color:'blue'},
  dataSubset: {startGroup:'&startg',
                  stopGroup:'&stopgp'}
 *END
INCLUDE=ENIADefault_combine.sty,$
ENDSTYLE
END
When the request is run, the user enters the start group number and the stop group number, in this case 0 and 4:

Note: You can use the WebFOCUS amper auto-prompting facility to create a launch page that prompts users for the amper variables necessary to execute a procedure. With this facility, you can generate dynamic or static drop-down lists of allowed values and can validate the values entered by the user. For more information, see the Developing Reporting Applications manual.
When the user clicks Run, the following chart is generated that shows groups 0 through 3:
