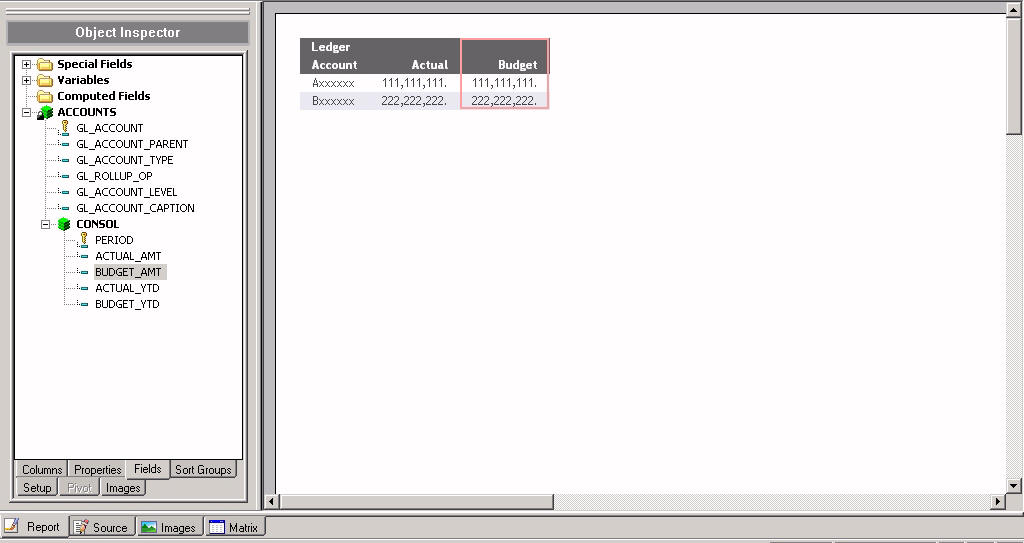
Create the Base Report in Report Painter

In this section:

You always begin a financial report in Report Painter and complete it in the Financial Report Painter.

Before the detour, you had specified CENTSTMT as the data source you would be using and selected Report Painter as your tool. Report Painter should be open on your screen.

  1. Begin by scrolling down in the Object Inspector to verify that all of the fields from CENTSTMT are available for your report.
  2. Double-click the following fields to bring them into the Report Painter window: GL_ACCOUNT, ACTUAL_AMT, and BUDGET_AMT. (Since descriptive names are assigned to each of these fields in the Master File, those names appear as column titles.) They are all Detail fields by default.

  3. Change the title from Budget to Planned.
    1. Right-click the column title and choose Column Title from the menu.

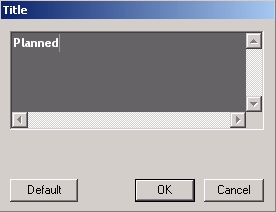
      The Title dialog box opens with Budget displayed.

    2. Type Planned, as shown below, and click OK.
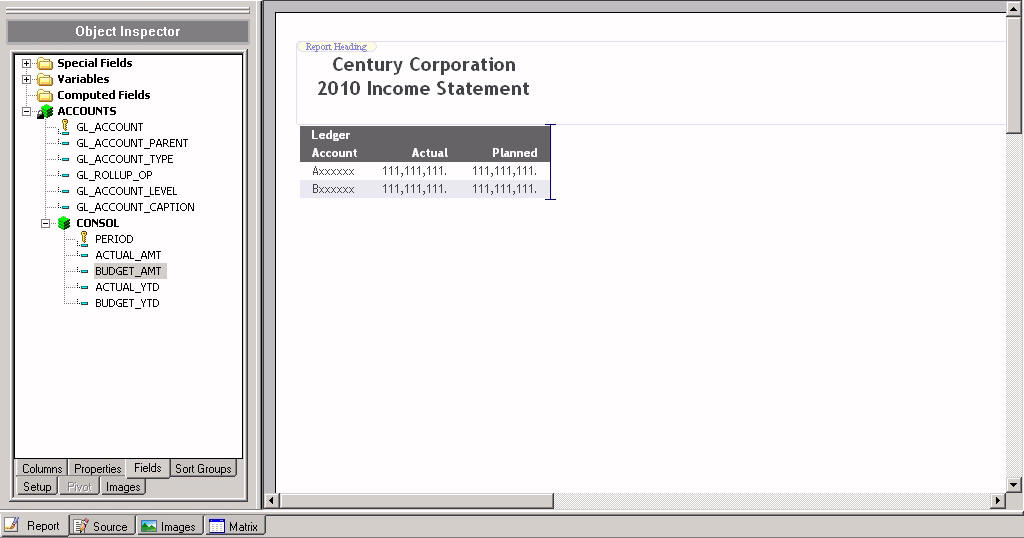
      Title

  4. Select Ledger Account and click the By button, then select Actual and click the Sum button. Notice that Planned automatically changes to a summary column as well. These changes will enable you to sort Actual and Planned data by account.
  5. Insert a title for the report.
    1. Click Insert in the toolbar menu and select Report Heading. In the Report Heading object, type
      Century Corporation
      2010 Income Statement

      followed by a blank line to leave space between the heading and the report.

    2. Highlight the heading text, right-click and choose Justify, and select Center.

      Report Painter appears, as shown in the following image.

    3. Click the Save icon, then click Run to see what you have accomplished so far.

      Save

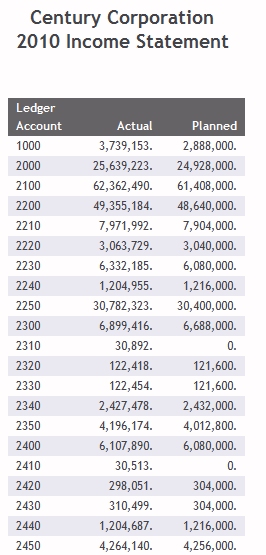
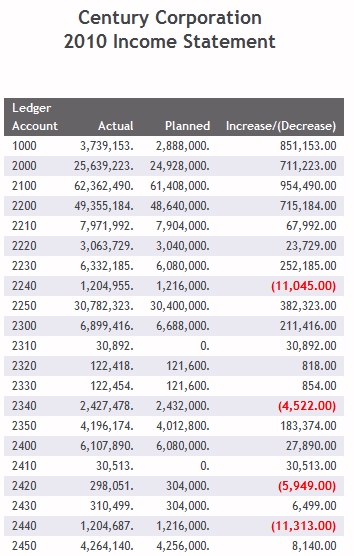
      As expected, the output shows Actual and Planned data for each account in the Chart of Accounts. Accounts are listed in low to high order. In the full report, accounts run through 5200.

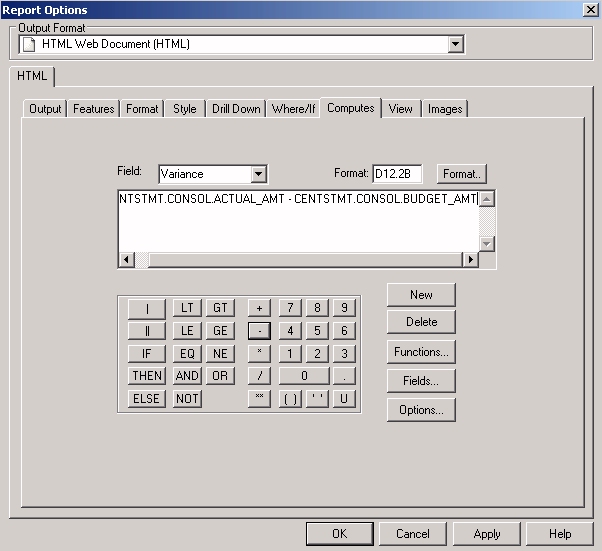
      Next, you will create a column to reflect the difference between Actual and Planned amounts. This information will help Century Corporation determine which products the Sales force should be encouraged to push and where efforts should be made to reduce spending.

  6. Place the cursor after the last column in the Report. Click the Options button, then select the Computes tab from the Report menu.

    The Report Options dialog box opens.

  7. Name the field you are computing Variance and change the decimal format to D12.2B. (B will enclose any negative numbers in parentheses in the output.)
  8. Click the Fields button (bottom-right) to open the fields list. Double-click ACTUAL_AMT, click the minus sign (-) on the calculator, then double-click BUDGET_AMT. Click Close to close the Insert Field window. Your expression is reflected in the input window.

    Report Options

  9. Click Apply to make the calculated value available in the fields list. Click OK to add the column to Report Painter.
  10. Click the Variance column and make sure that the Sum button is selected.
  11. To give the new column a more descriptive title, right-click Variance and choose Column Title. In the Title dialog box, type:
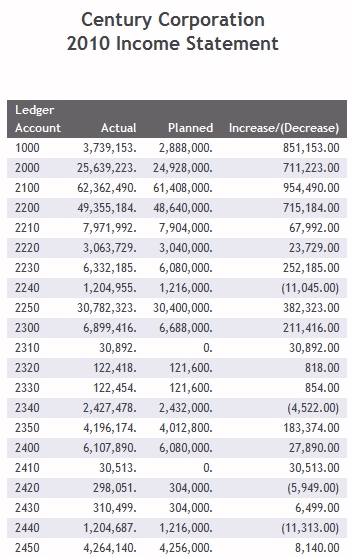
    Increase/
    (Decrease) 
  12. Save your work, then click the Run icon.

    The output shows the increase or decrease of each Actual value in relation to the corresponding Planned amount.

    report output

  13. Although shown in parentheses, the negative values are still a little hard to see. Make them bold and red. The value of this information will be more evident when you have completed the income statement, where red, bold values will quickly draw attention to less than expected sales on the revenue side, but also to less than expected spending on the expense side.

    First, you will define the condition you want to highlight and then the style you want to apply when that condition is met.

    1. Right-click Increase/Decrease and select Options.

      The Field Properties dialog box opens at the Style tab.

      Field Properties

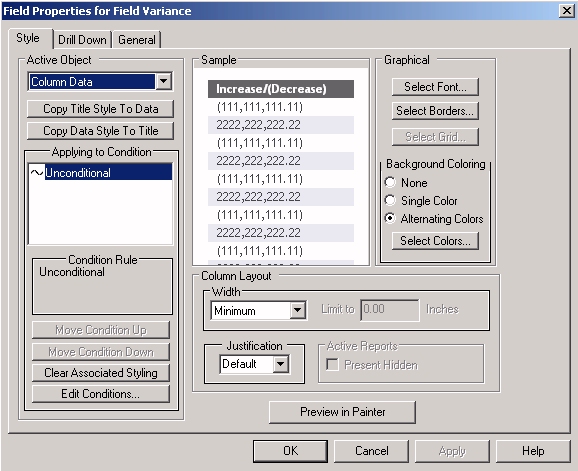
    2. Confirm that the active object field is set to Column Data.
    3. Click the Edit Conditions button (lower-left).

      The Condition List dialog box opens.
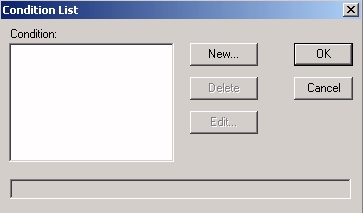
      Condition List dialog box

    4. Click New.

      The Edit Condition dialog box opens.

    5. In the Condition input box, assign the name DECREASE. Then create the following expression to reflect the negative values.
    6. Choose Variance from the Field list, is less than from the Relation list, and type 0 in the Value input box.
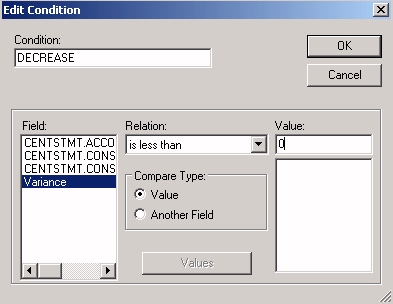
      Edit Condition

    7. Click OK.

      The Condition List dialog box opens, displaying the completed expression.

    8. Click OK to return to the Style tab where you will define a style to apply when this condition is met.
    9. With DECREASE selected in the Apply to Condition list, click the Select Font button under Graphical.

      The Font dialog box opens.

    10. Click the Color button, select RED from the color palette and click OK.
    11. Then select Bold from the Font Style list and click OK.
    12. Click OK again to return to Report Painter.
    13. Click the Save icon followed by the Run icon.

      The output shows all negative values in bold and RED.

      output


Top of page

x
Summary and Next Steps

You have created a project and within it, you have completed the column-based setup for a report that examines Actual and Planned data for a chart of accounts.

But your goal is to create an Income Statement that tracks revenue, cost of goods sold, and expenditures.

You will do that in the next exercise.

Begin with a quick review of the differences between a standard report, like the one you just created, and the financial report you will turn it into.

In a standard tabular report:

In a financial report:

The income statement you will create demonstrates many of these features.


WebFOCUS