Analyzing Server Activity
You can use the Server Log pane in the diagnostics section of
the Web Console to view the current or prior server activity log
(edaprint.log) from either a management perspective (Session and
Connection activity) or a raw version of the log with or without
filtering for certain components and IDs. By default, the Server
Log chronologically records all server activity from the time the
Workspace Manager was started. It contains basic activity information,
as well as server start up information and IBISNAP and shutdown
information. IBISNAP is a snapshot of the server environment showing
various usage statistics, CPU and server times for each data agent
connection, and listener and agent status. If an abend occurs, the
snapshot contains additional debugger stack information that aids
the Customer Support Services staff in determining the problem.
You can view the first 50,000 lines of the log file from the
Web Console. If you wish to view lines beyond 50,000, you can open
or save the file in a text editor.
x
Procedure: How to Access the Server Log Files
-
From the
menu bar, select Workspace.
-
Expand the Logs
and Traces folder in the navigation pane.
-
Right-click Workspace
Logs and select View.
The Workspace Logs page opens.

-
Right-click hliprint.log and
select View
or
Right-click edaprint.log and
select a report type:

-
Full Report has View and Open
or Save options.
-
Connection
Report has Detail, Summary and Graph options.
-
Page Hit
Report has Detail and Summary options.
The
log opens in the right pane.
x
Procedure: How to Display the Live EDAPRINT Log File
To
display the live EDAPRINT log file:
-
From the main menu, select Workspace.
-
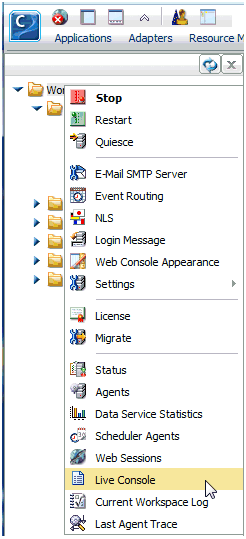
Right-click the Workspace folder
and select Live Console, as shown in the
following image.

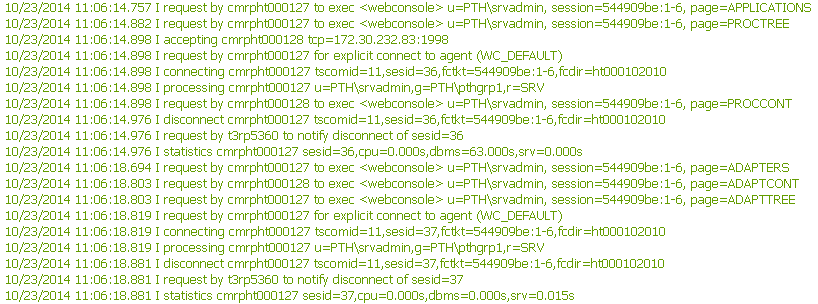
The EDAPRINT log opens
in a separate browser tab, as shown in the following image.

You can also access the
live EDAPRINT log by selecting Live Console from
the Monitor section of the ribbon, as shown in the following image.

Note: This
option is only available when using a Firefox or Chrome browser.
x
Procedure: How to Open a Copy of the EDAPRINT Log File
To
open a copy of the EDAPRINT log:
-
From the Web Console, click Workspace.
-
From the ribbon, click the Current Workspace Log icon,
or right-click the Workspace folder in the navigation
pane, and select Current Workspace Log.
Your
browser will ask whether you want to open or save the file.
If
you choose open, the file will open in your default text editor.
x
Procedure: How to Set Workspace Log Properties to Control the Edaprint Log
The
Workspace Log Properties page controls both the edaprint log and
event routing email. For information on event routing email, see Setting Workspace Log Properties for Event Routing.
-
From the menu bar, select Workspace.
-
Open the Logs and Traces folder.
-
Right-click Workspace Logs and
select Properties.
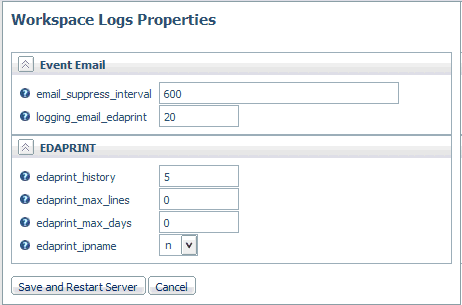
The Workspace Logs Properties page opens, as shown in the
following image.

-
Enter or select values for the EDAPRINT parameters.
The EDAPRINT parameters are:
- edaprint_history
-
Defines the number of saved edaprint.log files to keep. Valid
values are 0-99. The default value is 5.
- edaprint_max_lines
-
Defines the maximum number of lines in an edaprint.log before
it is archived, and a new edaprint.log is started. The default value
is 0, which means unlimited.
- edaprint_max_days
-
Defines the maximum number of days from the time the server
is started before an edaprint.log is archived and a new edaprint.log
is started. The default value is 0, which means unlimited.
Note: A
new edaprint.log file will only be created after the edaprint_max_days
value has been exceeded, and a connection event has occurred. For
example, if the server is idle, the new edaprint.log file will not
be created until a connection request is received.
- edaprint_ipname
-
Defines whether the server should convert IP host addresses
to names. It requires DNS lookups. The default value is n.
-
Click Save and Restart Server.
x
Procedure: How to Filter the Server Log
-
From the
menu bar, select Workspace.
-
Expand the Logs
and Traces folder in the navigation pane.
-
Right-click Workspace
Logs and select Filter.
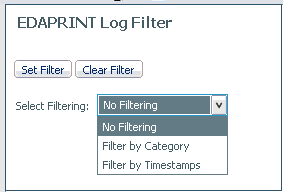
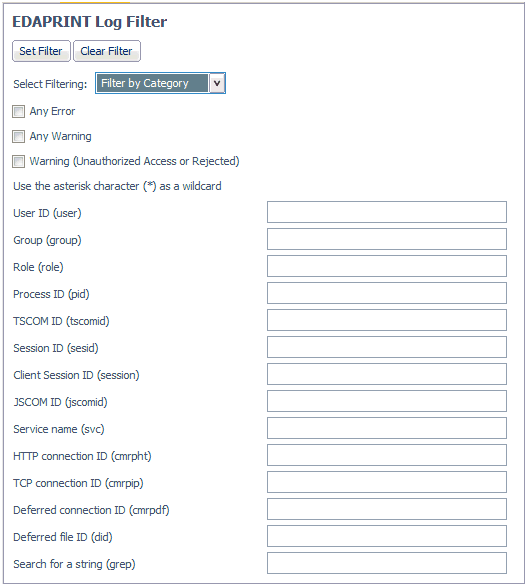
The EDAPRINT Log Filter page opens.
Select an option
from the Select Filtering drop-down menu.

-
Click Set
Filter.
-
If you choose Filter
by Category, the following page opens. Set your filtering
parameters and click Set Filter. For any
item, clicking the check box without an entry in the input box filters
on all items of that type. If you also enter a specific value in
the input box, that filter will be executed. (For example, you can
request filtering on all users, which defaults to *, or an individual user.)
You can combine items from the list, mixing all items of a type
with specific items, as needed.

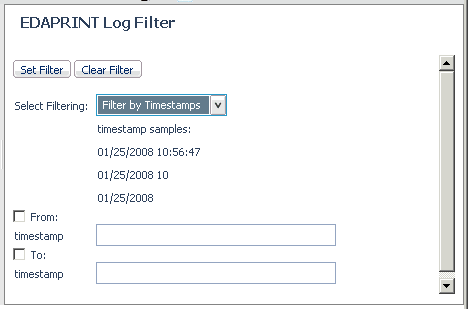
-
If you choose Filter
by Timestamps, the following page opens. Enter From
timestamp and To timestamp information and click Set
Filter.

-
Right-click Workspace
Logs and select View.
The Workspace Logs page opens.
-
Right-click edapring.log and
select a report type.
x
x
Reference: Controlling EDAPRINT History
The
size of the server activity log, the number of files archived in the
EDAPRINT history, and the maximum number of days each edaprint.log
is maintained before it is archived and a new edaprint log is started
are controlled by edaprint_max_lines, edaprint_history,
and edaprint_max_days, respectively.
Limit
the size of each log file by setting the maximum number of lines
to a value other than zero. There is no minimum, but the recommended
value is at least 1000 lines. If the limit is too low and the system
is too fast (such that two archived files can have the same file
system time stamp to the same second), whichever of the archived
files is deleted first is undefined.
The first log file for
each server start always contains more lines than the maximum because
the count begins only after the edaplog process is created, thus
it is larger by the size of the startup information. Each time the
limit is reached, the current log file is archived and the new file
starts with an additional identification line. This line indicates
the rank of the file in the series of continuation files, and a
reference to the archived name of the first file in the series (the
one with the startup information), in a format similar to the following:
continuation #n of edapriNN
The
number of files kept archived is determined by setting the edaprint_history parameter
to the maximum number of edapriNN.log files. Each time the server
is restarted or the current log reaches maximum size, the previous
edaprint file is moved to edapriNN.log, and the maximum number of
files is enforced by deleting the oldest files. The effective minimum
number of files kept may be as high as 2 in addition to the current edaprint.log,
even if edaprint_history was set to 0 or 1 because when files are
split to respect edaprint_max_lines, the most recent file and the
most recent file containing startup information are always preserved.


