In this section: |
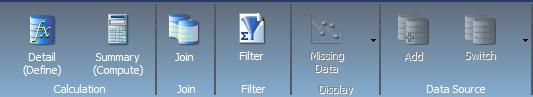
The Data tab contains data manipulation and data display options in the Calculation, Join, Filter, Display, and Data Source groups, as shown in the following image.
The Calculation group contains commands to define Define and Compute fields.
DEFINE fields and COMPUTE fields are two different types of temporary fields. A temporary field is a field whose value is not stored in the data source, but can be calculated from the data that is there, or assigned an absolute value. A temporary field takes up no storage space in the data source, and is created only when needed.
When you create a temporary field, you determine its value by writing an expression. You can combine fields, constants, and operators in an expression to produce a single value.
You can specify the expression yourself, or you can use one of the many supplied functions that perform specific calculations or manipulations. In addition, you can use expressions and functions as building blocks for more complex expressions, as well as use one temporary field to evaluate another.
A virtual field (DEFINE) is evaluated as each record that meets the selection criteria is retried from the data source. The result of the expression is treated as though it were a real field stored in the data source.
A calculated value (COMPUTE) is evaluated after all the data that meets the selection criteria is retrieved, sorted, and summed. Therefore, the calculation is performed using the aggregated values of the fields.
The Field dialog boxes, which open when you click Detail or Summary, provide similar functionality, including options to display data source fields in a Logical, List, or Structured view. You can also view a complete set of functions, instead of data source fields, by clicking the Functions button. The Summary (COMPUTE) dialog box is shown in the following image.
In this section: |
The Join group contains the Join button to open the Join dialog box, where you can create a new join, edit or delete existing joins, and add data sources to a join.
Note: The Join group is not available when working with Reporting Objects or SAP® Business Information Warehouse (SAP BW), Oracle Essbase®, or Microsoft® SQL Server® Analysis Services cubes.
The following image shows the Join dialog box with two data sources joined by the common ID_AGE indexed field.
Using conditional joins, you can establish joins based on conditions other than equality between fields. In addition, the host and cross-referenced join fields do not have to contain matching formats, and the cross-referenced field does not have to be indexed.
Note: You can edit the description of a Join by clicking Edit in the Join dialog box and typing in the Description section. You can only use letters, numbers, and underscores in your description. No special characters are allowed.
The conditional join is supported for FOCUS and all relational data adapters. Because each data source differs in its ability to handle complex conditional criteria, the optimization of the WHERE syntax differs depending on the specific data sources involved in the join and the complexity of the conditional criteria.
For FOCUS data sources, if the host and cross-referenced join fields do not have common matching formats, the following message appears.
Note: If you click Yes, the Filter dialog box opens, where you can create a Where-Based Join.
If the cross-referenced join field does not have an index, the following message appears.
Note: If you click Yes, the Filter dialog box opens, where you can create a Where-Based Join.
To create a Where-Based Join, create a filtering condition, as shown in the following image.
The blend option allows you to explicitly select the data fields that you want to include. More specifically, you can join multi-fact data structures and combine pertinent external data into your current data source, creating a blended data resource. This can be from local or other system resources.
Blending is used to create customized data sources. For example, you may have some of the basic fields available in the current data source, but you can use the blend option to add relevant data fields from a different data source to the current data source in order to create a unique data set.
The blend option allows a new fact table to be added to a cluster master as a parent segment to an existing child segment. This option is available from the Join dialog box. You may want to blend data if you are reporting from two different fact tables that share a common dimension, such as a product dimension. For an example of this, you can view the sample retail database, wf_retail_lite. The wf_retail_lite Master File contains the WF_RETAIL_STORE_SALES segment and the WF_RETAIL_SALES segment. The WF_RETAIL_SALES segment is defined as the parent of the WF_RETAIL_STORE_SALES segment. You may want to add a second fact table to the report. The second fact table in this example will be an Excel spreadsheet that you upload to InfoAssist for use with a report or chart. The data in the spreadsheet file that you upload will be joined to the WF_RETAIL_LITE database using a common field.
Note: You can find supported, common fields in your selected database (for example, WF_RETAIL_LITE) using the search feature in the Data pane. If necessary, you may need to add a field in your spreadsheet to map your data to the structure of the database. For example, ID_CUSTOMER. In addition, the name of the primary sheet in Microsoft Excel becomes the name of your data source, so be sure to name the file accordingly.
The following list provides some general rules that apply to the Blend option:
This procedure describes how to blend data from an external data source into an existing data source. This example uses a Microsoft Excel spreadsheet file.
The Join dialog box displays.
The Open dialog box displays, as shown in the following image.
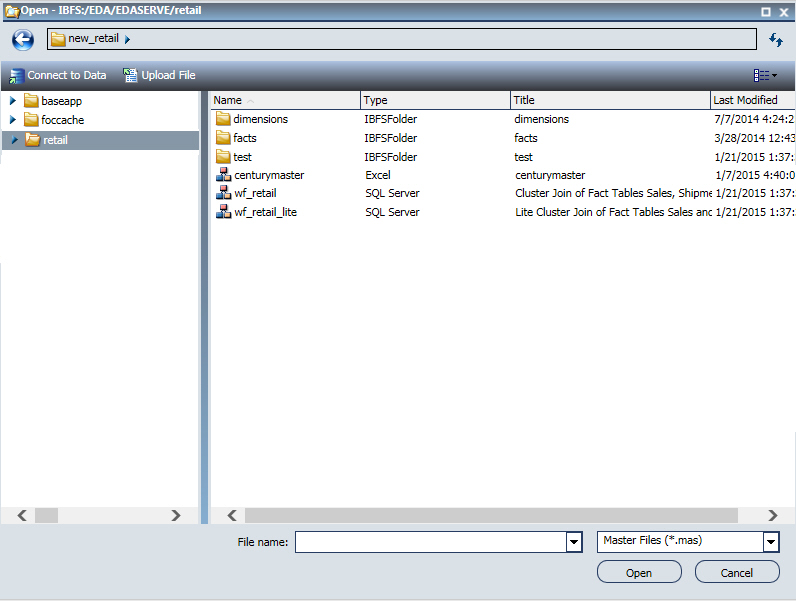
Note: The options that display on the Open dialog box depend on your user privileges.
The Upload tool opens.
If your upload is successful, the Categorize Fields into Measures, Dimensions and Hierarchies pane opens.
Note: If there are informational messages or if your upload is unsuccessful, the Status pane opens.
Note: A common field is a field used in both the current Master File and uploaded spreadsheet.
The data upload is complete and the data source is added to the Open dialog box.
The blended data source fields are now available in the Data pane.
The Filter group contains the Filter button that opens the Filter dialog box, enabling you to set filtering options. Filter options include Where, Where Total, the And conjunction, and the Or conjunctions in a single expression.
When creating a report, you refer to fields in several parts of the request. For example, in display commands (PRINT, SUM), in sort phrases (BY, ACROSS), and in selection criteria (WHERE, WHERE TOTAL, IF).
The WHERE phrase selects records from the data source to be included in a report. The data is evaluated according to the selection criteria before it is retrieved from the data source. You can use as many WHERE phrases as necessary to define your selection criteria.
In WHERE TOTAL tests, however, data is selected after all the data has been retrieved and processed.
You can group conditions and expressions within filter criteria. In addition, you can apply functions and calculations within criteria. For more information on filtering options, see Field Tab.
You can create Where and Where Total filters in the Filter dialog box by clicking WHERE, as shown in the following image.
Double-clicking the Double-click or press F2 to edit! text, as shown in the following image, opens drop-down menus for Fields and Subqueries, Operators, and Values, as shown in the second image to follow.
You can retrieve fields and values from the Master File and data source and Subqueries from a HOLD file.
The Field drop-down menu provides a field list from the Master File. The Field list can be viewed as follows:
Click EXISTING to open the Open dialog box, where you can select a subquery from a different Master file.
The Operator (default) drop-down menu provides the following operators:
The Value drop-down menu opens a dialog box with multiple options, as shown in the following image.
Note: If you are creating a filter on a full date field, the Value field will have a calendar icon adjacent to it. You can use this icon to select a date using a calendar control.
The Type drop-down menu contains the following options:
The value area contains a text input box that you can use to manually insert values. It also contains a Get Values drop-down menu, which supplies the following options.
Note: The Get Values drop-down menu is only accessible if you have already selected a field.
After selecting the values that you want, you can move them into and out of the Multiple Values area with the left and right arrows. You can also change the value order and delete values with the up and down arrows and the Delete icon.
After creating a condition, you can insert additional conditions before and after the selected condition by using the Insert Before and Insert After buttons at the top of the Filter dialog box. You can use either the And or the Or conjunction to link conditions and the Group and Ungroup buttons to nest and organize conditions.
You can create additional filters by clicking the New Filter button at the top of the Filter dialog box, as shown in the following image.
After creating the filters that you want, click OK to save and apply the filters. You can access them from the Filter pane of the Resources panel.
The Display group contains the Missing Data menu, which contains options to control the display of missing data values in a chart.
The Missing Data menu options are:
The Data Source group contains the Add command and the Switch drop-down menu to add and switch data sources. The Data Source group is only available in Document mode.
Note: The Data Source group is not available when working with Reporting Objects.
The commands are:
You can also switch data sources by selecting a report that is using a data source different from the one that is currently active.
| WebFOCUS |