Deployment and the WebFOCUS Visual Discovery Server AE
A WebFOCUS Visual Discovery Workbench AE project can
be deployed to a larger group of people for sharing results or allowing
them to do their own analysis. There are several strategies for
deploying results:
- You can export a static document containing charts from
the WebFOCUS Visual Discovery Workbench AE. Types of documents include
Microsoft PowerPoint, Microsoft Word, and ADOBE Portable Document
Format (PDF).
- You can send your WebFOCUS Visual Discovery AE Project to another
user who has WebFOCUS Visual Discovery AE. The user may have WebFOCUS
Visual Discovery Workbench AE or WebFOCUS Visual Discovery AE Desktop
Navigator, a read-only version of WebFOCUS Visual Discovery Workbench
AE. You can send a project with data embedded into it (as an ".advm"
file) or that references a data source (a ".adv" file).
- You can publish your project to WebFOCUS Visual Discovery Server
AE, from where an interactive dashboard can be accessed by any user
with a web browser, with no need to install desktop software. The
WebFOCUS Visual Discovery Server AE product is required for this
capability.
An interactive analysis application in a web browser is often
called a dashboard, and that term will be used here to describe
a WebFOCUS Visual Discovery AE project accessed from the WebFOCUS
Visual Discovery Server AE.
x
WebFOCUS Visual Discovery Server AE Dashboards are multi-tab
analytical applications built with charts. These are presented in
a web using the Microsoft Silverlight plugin on PCs or using an
application on Apple iPad tablets. All of the WebFOCUS Visual Discovery
AE charts are available, and they provide most of the Visual Discovery
capabilities that make the WebFOCUS Visual Discovery Workbench AE
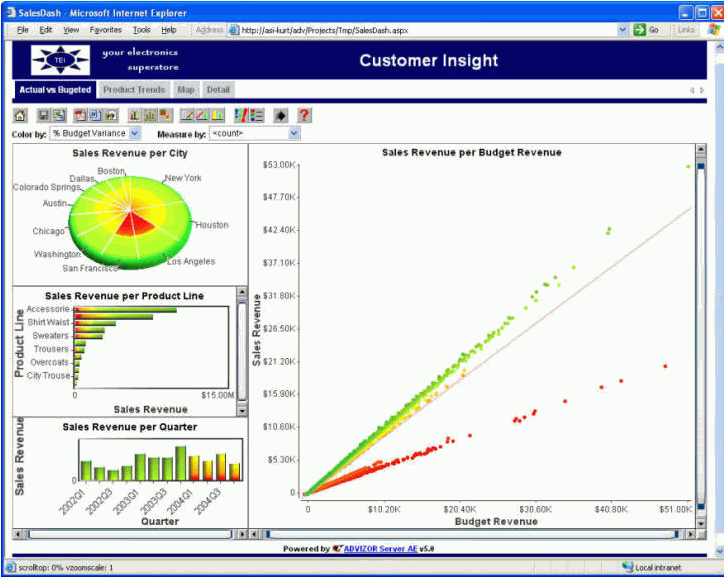
client application so useful. A project in a browser looks like
this; charts are arranged on tabs, corresponding to the tabs in
the original WebFOCUS Visual Discovery Workbench AE project. Each
tab has a tool bar providing access to WebFOCUS Visual Discovery
AE and data export functions. Charts also have context menus, identical
to those in the WebFOCUS Visual Discovery Workbench AE client.
A dashboard supported by the WebFOCUS Visual Discovery Server
AE is accessed via the URL http://<YourServername>/adv, where
YourServerName is your web server.
The operations supported by the WebFOCUS Visual Discovery Server
AE dashboards are:
- Choose a tab with a set of charts.
- Sweep with the mouse in a chart to select a subset of the items
in the chart, which is reflected in all charts by sweeping a rectangle
with the left mouse button depressed.
- Focus on an item to label it by clicking the left mouse button
with the ALT key depressed.
- Access the standard context menu with the right mouse button.
- Command bar buttons and controls are:
- Reset: return charts
to initial condition.
- Share as ADOBE PDF: download a static view of the dashboard
as an ADOBE PDF file.
- Share as Microsoft Word Document: download a static view of
the dashboard as a Microsoft Word document.
- Share as Web Archive: download a static view of the dashboard
as a web archive, containing HTML and images.
- Select All: select all items in charts.
- Unselect All: unselect all items in charts.
- Toggle Selection: reverse selection for all items in charts.
- Exclude Selected: exclude the selected items.
- Exclude Unselected: exclude the unselected items.
- Restore Excluded: restore all excluded items.
- Undo: undo the last operation.
- Redo: redo the last undone operation.
- Show Color Legend: show the Color Legend on the page.
- Help: display help on dashboards.
- Color By: choose a field to color the display by.
- Measure By: choose a field to use to weight categorical views
(for example bar charts).
- For charts with Zoom Bars, use the Zoom Bar to pan or zoom the
chart.
WebFOCUS Visual Discovery AE provided by WebFOCUS Visual Discovery
Server AE dashboards is quite close to the capabilities of the WebFOCUS
Visual Discovery Workbench AE, but there are differences imposed
by the web environment:
|
Function
|
WebFOCUS Visual Discovery Workbench AE
|
Visual Discovery Server AE Dashboard
|
|---|
|
Focus
|
Hover over item in chart
|
Hover over item in chart
|
|
Selection Operations
|
Replace (default), Toggle (with CTRL key
depressed), Add, Subtract, and Intersect
|
Replace (default) and Toggle (with CTRL
key depressed) only
|
|
Panning/Zooming
|
Using zoom bar, keyboard, and mouse
|
Using zoom bar only
|
|
Keyboard commands
|
As defined in Keyboard Commands.
|
Same set, but browser typically intercepts
commands so they are not received
|
The WebFOCUS Visual Discovery Server AE Portal
The WebFOCUS Visual Discovery AE Portal is a web page provided
by the URL http://<YourServername>/adv (where YourServername
is the name of your server) that lists the projects available from
that server. It gives details about the projects, and may be used to
launch a project by clicking on the name, which is a link. Here
is an example of a portal:
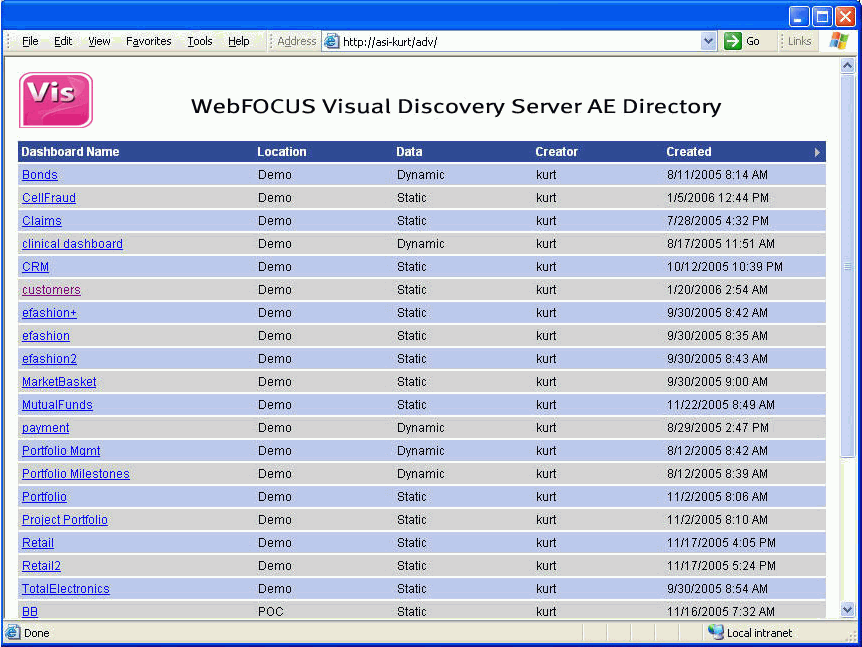
Fields in the table are:
-
Dashboard Name. The name of the project for the
dashboard; clicking this link launches the dashboard.
-
Location. Subfolder the dashboard is published into.
-
Data. Whether data is embedded in the project (Static)
or accessed dynamically from a data source when the dashboard is
accessed (Dynamic).
-
Creator. Who published the dashboard.
-
Created. When the dashboard was published.
Implementation Constraints
The WebFOCUS Visual Discovery Server AE dashboards are supported
in any browser that support Microsoft Silverlight on PCs and on
Apple iPads via an application. Supported browsers on PCs include
Internet Explorer, Firefox, Chrome, and Safari on both Microsoft Windows
and Apple OS/X. Apple Safari is NOT supported on Apple IOS devices,
however: the WebFOCUS Visual Discovery Server AE must be accessed
via an application. See the Implementation Guide (located in the
installation directory for the client software and the bin subdirectory
of the WebFOCUS Visual Discovery Server AE installation directory).
xPublishing to WebFOCUS Visual Discovery Server AE
Deploying via the WebFOCUS Visual Discovery Server AE
requires WebFOCUS Visual Discovery Workbench AE for authoring and
the separate WebFOCUS Visual Discovery Server AE product as the
server for other users. WebFOCUS Visual Discovery Server AE is a
Microsoft .Net application which requires a server running Microsoft Internet
Information Services (IIS) as the web server and Microsoft .Net
as the software platform.
A project accessed via the web is often called a dashboard.
A dashboard supported by WebFOCUS Visual Discovery Server AE
is accessed via the URL http://<YourServername/>adv, where
YourServername is your web server.
Directory Structure
WebFOCUS Visual Discovery Server AE is installed typically on
a separate server; by default it installs in c:\Program Files\WebFOCUS
Visual Discovery Server AE. The subdirectories here are:
-
AsiScripts. Contains style sheets and .htc files
that provide the mouse interaction at the browser. You may define
your own style sheets to customize the look of your published project.
-
Bin. Contains the server application executable.
-
Images. Images used for toolbar buttons in the web dashboard.
-
Projects. Dashboards are stored here, named project
file + .aspx. You can organize these into subfolders and specify
access rights at the dashboard, subfolder, and/or portal level.
-
Templates. HTML files for defining custom templates
to publish dashboards into. These provide a custom frame for your
dashboard that includes your logo and other identifying graphics
Publishing
Your project file (.adv or .advm) is the source for your dashboards.
Tabs in your project become pages in your dashboard. These pages
can be combined in various ways to create a number of dashboards,
for example targeted to different Business Units or people with different
roles. So a single project may be used to publish multiple dashboards
by choosing which pages/tabs are included in each. Pages will appear
in your dashboard in the same order that the tabs appear in your
project.
Templates
A template is an HTML file that surrounds your dashboard. This
HTML file lets you give your own look and feel to the dashboards
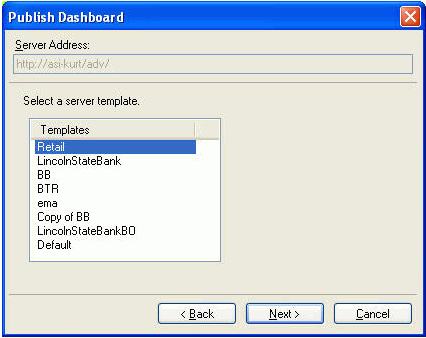
that you publish. A template will be used if you check the Publish
using server template check box on the Publish Dashboard wizard.
During the publishing process, this will lead you to this wizard
page which gives the list of templates available on your server;
these are files stored in the Templates subdirectory in your server installation.
You must have previously placed these template files there!
The default template is available in the Templates subdirectory,
and looks like this:
<html xmlns:v=urn:schemas-microsoft-com:vml>
<head>
<link rel=stylesheet type=text/css href=../../ASIScripts/style2.css />
<link rel=stylesheet type=text/css href=../../ASIScripts/footerStyle.css />
<title></title>
<!-- BEGIN ASIPublishHead -->
<!-- END ASIPublishHead -->
</head>
<body>
<!-- BEGIN ASIPublishContent -->
<!-- END ASIPublishContent -->
</body>
</html>
The dashboard contents is substituted into this page at the BEGIN
and END HTML comments.
You can modify the color of the tabs in the WebFOCUS Visual Discovery
AE dashboard by modifying the style sheet style2.css and changing
the template to access the modified style sheet, for example:
<link rel=stylesheet type+text/css href=../../ASIScripts/MyVersionOfStyle2.css/>
Implementation Constraints
WebFOCUS Visual Discovery Server AE is a Microsoft .Net application,
and so requires a Microsoft Windows server, the Microsoft .Net platform,
and Microsoft Internet Information Server (IIS).
Performance Considerations
The Internet is optimized for short, stateless operations. WebFOCUS
Visual Discovery Server AE maintains a large amount of state for
a session so that you can continually interact with your data. The
WebFOCUS Visual Discovery Server AE loads all of your data into the
memory of the web server when you start a project. This memory must
remain in memory until that session terminates.
For a large volume of data, the time to load it into memory can
be substantial. This will be seen by the user as a delay when accessing
the dashboard initially. The web server also imposes limit on how
long a handler can take to respond to a web request. The initial
data load time for large datasets may exceed this limit. In this
case, increase the timeout so that the web server does not prematurely
terminate the WebFOCUS Visual Discovery Server AE.
Tip: To increase the timeout for WebFOCUS Visual Discovery
Server AE, add a line to WebFOCUS Visual Discovery Server AE\web.config,
somewhere within the <system.web> node:
<httpRuntime executionTimeout=1200 maxRequestLength=4096 useFullyQualifiedRedirectUrl=false minFreeThreads=8 minLocalRequestFreeThreads=4 appRequestQueueLimit=100 />
This would change the data load timeout to 20 minutes instead
of the default 30 seconds.
To try to minimize the memory impact from multiple sessions,
WebFOCUS Visual Discovery Server AE will share this loaded data
between multiple web sessions that are accessing the same Data Source.
Each session will have a small amount of memory to maintain its
own state (for example coloring, selection, font selections, etc.),
but the static loaded memory is saved. So even for a large volume
of data, the first session will incur the cost of loading the data,
but subsequent sessions will start very quickly as they find the
data already loaded into memory.
Sessions remain in server memory until they are terminated by
the web server. This happens by default after the session is inactive
for 20 minutes; this timeout interval can be set via the web server.
If multiple sessions share the same data, only the data specific
to them is released when that session expires. The large bulk of
data will not be released until the last session expires.
x
Procedure: How to Publish a Dashboard
-
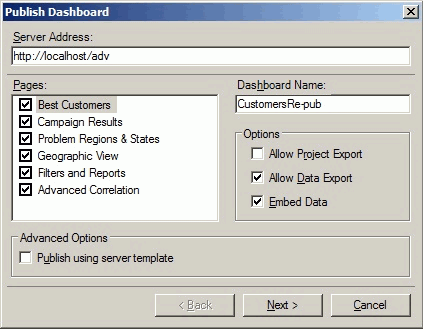
Use the Publish Dashboard item in the
Task View or the Files menu bar item. This launches the Publish
Dashboard dialog.
-
Server Address is the URL for your server;
Note: This must include the adv subdirectory.
-
In the Pages pane, check the pages from the project to
include in the dashboard.
-
Give the dashboard a name in Dashboard Name.
-
Choose options:
- Allow Project Export: check to allow the end user
to download the project file to their PC for offline analysis. This
feature requires the user to install WebFOCUS Visual Discovery AE
Desktop Navigator locally.
- Allow Data Export: check to allow the end user to export data
to their client machine.
- Embed Data: Check if you want the current snapshot of your data
embedded in the project, so that this will be shown to users of
the dashboard. Otherwise, the data source will be accessed when
the dashboard is accessed.
-
Advanced Options: These options let you provide advanced
features, but also require you to add files to your server installation
supporting these actions.
- Publish using server template: Check to then pick
a custom template to publish into.
-
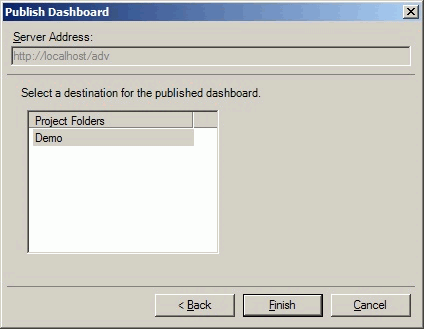
Choose Next> to go to the
next step in the wizard, which lets you choose the subfolder in
the WebFOCUS Visual Discovery Server AE installation directory to
publish into. You must previously create any subdirectories on the
server for them to appear here.
-
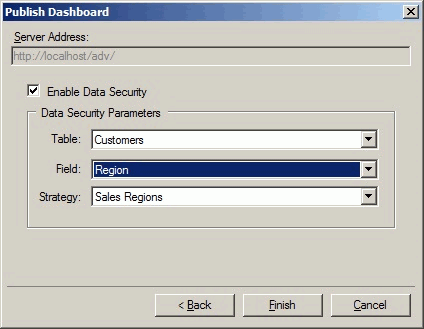
If security policies are defined, you will be prompted
for possible use of a security policy with this dashboard; see Credential Based Filters for details:
-
Click Finish to complete publishing.
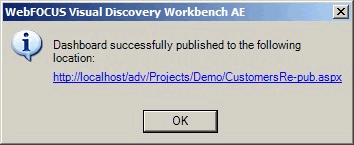
-
A dialog will appear giving the URL that the dashboard
was published to. Use this URL to access the dashboard in the future.
x
A Data Source is a definition
of input data that will be used by the WebFOCUS Visual Discovery
Workbench AE. It contains:
- Connection information on how to access the data.
- The Table Name that will be used in the WebFOCUS Visual Discovery
Workbench AE.
- The names and types of fields in the table.
- The definition of fields in terms of precision, use of commas,
and use of a currency symbol.
A single data source can define multiple tables. For example
it could draw data from four worksheets in a spreadsheet, or from
two queries against a database.
Data sources can be shared across projects. A project may have
multiple data sources.
The collection of data from all data sources in a session is
called the Data Pool.
Define Data Sources
You use the Data Wizard to load data into a project; this defines
a Data Source. This Data Source may be remembered, which will make
it available in subsequent sessions to new projects.
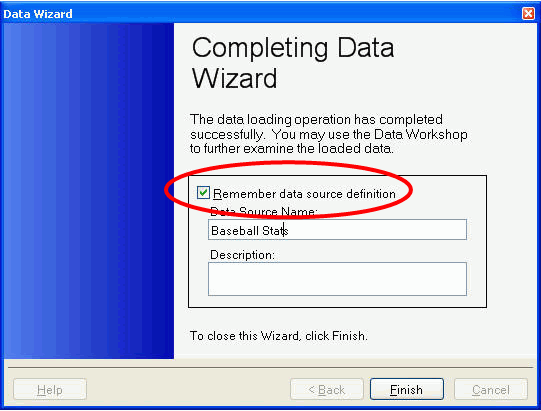
Tip: This option is checked by default; uncheck it if
you don't plan to reuse this data source in other projects.
You can define a Data Source without reading data into your project
using the Manage Data Sources dialog, available from the File menu
item:
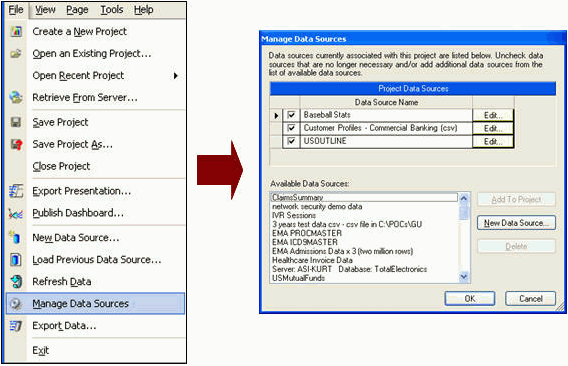
Click the New Data Source button to create
a new Data Source; this will use the Data Wizard to define the Data
Source, but it will not read the data source. After completing the
Data Wizard, the new Data Source will appear in the list of Available
Data Sources in the Manage Data Sources dialog.
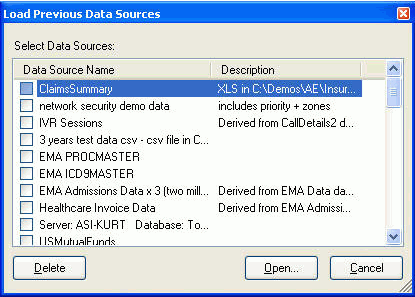
You can later access a defined Data Source using the Load Previous
Data Source ... menu item in the File menu (see above); this provides
a dialog that may be used to select data sources. Check one or more
data sources and click Open to read their
data.
Modify Existing Data Sources
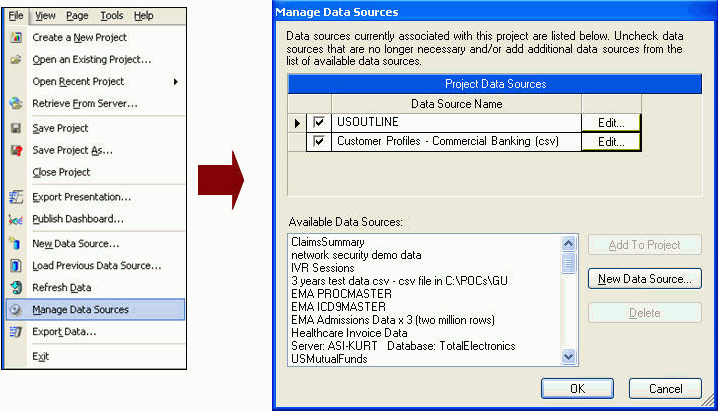
You can modify existing Data Sources via the Manage Data Sources
menu item in the File menu bar item. You can modify a Data Source
to change:
- The location of the data.
- The attributes of the Data Source, such as the fields included
and their properties.
Select the Manage Data Sources menu item from Files, and use
the Edit... button next to a Data Source, to modify it:
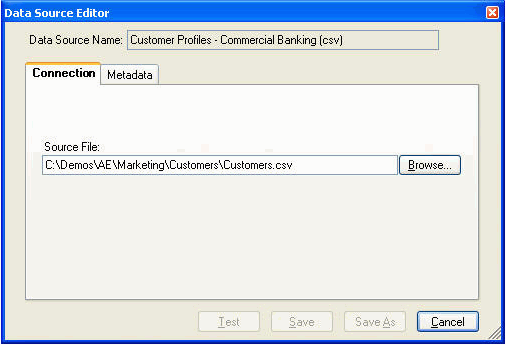
The data location may be modified on the Connection tab; this
example shows how the connection may be changed for a text data
source:
Attributes of the Data Source are changed with the Metadata tab:
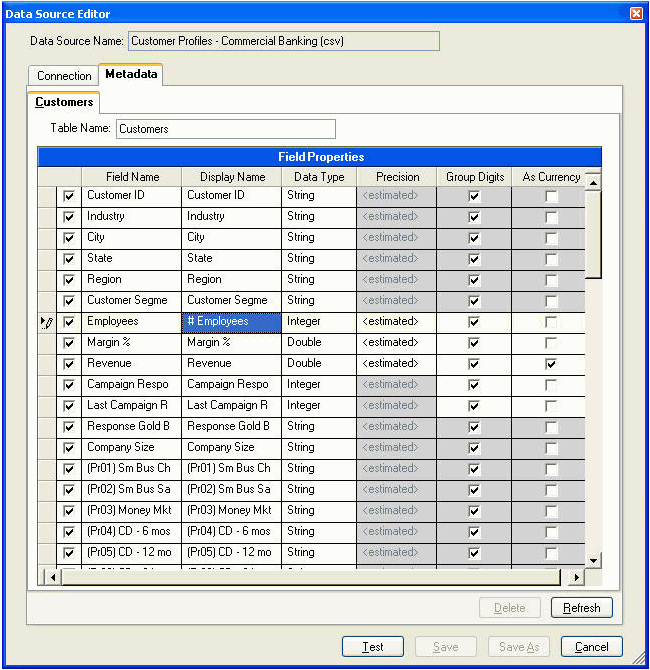
You can:
- Include or remove a field from the Data Source (using the
starting check box).
- Change the Display Name of a field.
- Change the storage Data Type of a field.
- Change the Precision of doubles.
- Choose whether 000's groups are separated in numerics.
- Display a currency symbol for a field.
Note:
- Changes to Table Name or a field's Display
Name do not automatically propagate to the charts. Charts using
a table or field name that has been modified will appear empty when
the project's data is refreshed. At that time you will need to rebind the
chart to the new name.
- For currency columns, the currency symbol defaults to the symbol
used by the computer's regional settings, which can change if the
project is opened on a different computer. To use a specific symbol
regardless of the computer's settings, select a symbol from the
pulldown list.
After you have made changes, click the Refresh button (above)
to reload the data, and click Test. This
enables the Save and Save As buttons; choose Save to overwrite the
existing Data Source, or Save As to create a new Data Source.
If you created a new Data Source via Save As, you can add it
to the existing project using the Add To Project button on the Manage
Data Sources dialog. If the modified Data Source should be used
in place of the original Data Source, uncheck the old Data Source
in the Project Data Sources list.
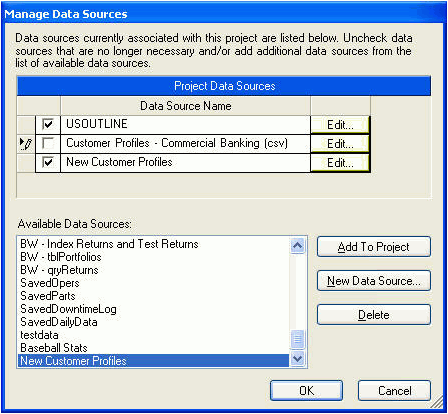
After these changes, save the project (using the Save Project
menu item under Files in the menu bar), and choose Refresh Data
to reload the data with the new Data Source definitions.
You cannot change where data is retrieved for a Data Source;
for example you cannot change a text file Data Source to a database
Data Source. Instead, define a new Data Source via the New Data
Source button in the Manage Data Sources dialog.
You can share Data Sources via the Template Library; use this
as a way of controlling Data Source definitions.
Common Tasks
Change Table or Field Names
Suppose you have a field called rev and you would like it to
appear as Revenue in Charts. Steps to change rev to Revenue:
- Modify the Data Source:
- Go to Manage Data Sources
in the Files menu item.
- Click Edit for that Data Source.
- Go to the Metadata tab in the Data Source Editor.
- Change the Display Name of field rev to Revenue.
- Press Save to update the Data Source.
- Save the project (Save menu item in Files menu).
- Refresh the data (Refresh menu item in Files menu).
- Re-attach any charts that used the field name rev to use the
new field name Revenue.
Add or Remove Field Names
Suppose you have a field that you would like to remove from a
Data Source or add to a Data Source:
- Modify the Data Source:
- Go to Manage Data Sources
in the Files menu item.
- Click Edit for that Data Source.
- Go to the Metadata tab in the Data Source Editor.
- Change the Display Name of field rev to Revenue.
- Press Save to update the Data Source.
- Save the project (Save menu item in Files menu).
- Refresh the data (Refresh menu item in Files menu).
Add Fields to the Data Source
- Define a new Data Source:
- Go to Manage Data Sources
in the Files menu item.
- Click New Data Source.
- Define the data source using the Data Source Wizard. This will
not read in the data.
- Press Save to update the Data Source.
- Swap your old Data Source for your new Data Source.
- The new Data Source appears at the bottom of the list under
Available Data Sources in the Manage Data Sources dialog.
- Click on the Data Source you just created and then click Add
To Project.
- At the top under Data Source Name, uncheck the box for the current
Data Source, then click OK.
- Save the project (Save menu item in Files menu).
- Refresh the data (Refresh menu item in Files menu).
Change the Location of a Data Source
What if the location of your Data Source changed? For example,
you may have a new database server, or the spreadsheet you are using
has moved. For the spreadsheet case:
- Modify the Data Source:
- Go to Manage Data Sources
in the Files menu item.
- Click Edit for that Data Source.
- In the Connection tab in the Data Source Editor dialog, click Browse and
find the new path.
- Press Save to update the Data Source.
- Save the project (Save menu item in Files menu).
- Refresh the data (Refresh menu item in Files menu).
Convert a Project with Embedded Data (.advm) to Point to Its Data Source
Suppose that you have a .advm file and you would like to replace
the embedded data with a new version, from a .csv file.
- Open the project.
- Place the new .csv file into a
folder of your choosing.
- Open the .advm file.
- Modify the Data Source:
- Go to Manage Data Sources in
the Files menu item.
- Click Edit for that Data Source.
- In the Connection tab in the Data Source Editor dialog, click Browse and
find the new path.
- Press Save to update the Data Source.
- Save the project as a .adv (Save menu item in Files menu).
- Refresh the data (Refresh menu item in Files menu).
Move a Dashboard from a Test to Production Environment
Suppose that you have a dashboard ready to be deployed to your
production server; however it is currently using a local extract
file:
- If you want the Data Source to point at an extract on the
server:
- Follow the same steps as in Change the Location of
a Data Source.
- If you want the Data Source to draw data from a database:
- Follow the same steps as in Add or Remove Field Names.
x
Access to dashboards on the WebFOCUS Visual Discovery
Server AE are managed through the security capabilities built into
Microsoft IIS and ASP.Net. Options are:
- Anyone can access the dashboard if they know its URL using
anonymous access. This is how the WebFOCUS Visual Discovery Server
AE is configured by default.
- Access to an entire dashboard can be managed. Authenticated
Windows access requires that the Server and client be in the same
Windows domain and that the user log into the domain. The user then
must have access (on an individual or group basis) to the project
files that he or she accesses.
- Access to a subset of the data in a project can be controlled;
this is discussed under Credential Based Filtering.
- You can provide your own, custom authentication scheme to an
entire dashboard.
Managing Access to Dashboards
The WebFOCUS Visual Discovery Workbench AE is used to create
and publish dashboards to the WebFOCUS Visual Discovery Server AE.
When publishing, you are prompted for a destination for the dashboard.
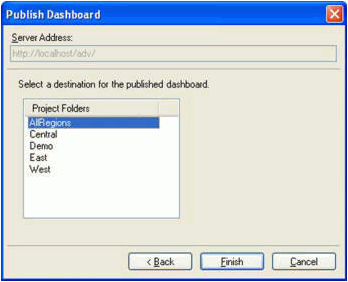
Dashboards are placed under subfolders of the Projects folder
of the ADV virtual directory on the WebFOCUS Visual Discovery Server
AE machine. Thus, when prompted for a destination, you are shown
all subfolders of the Projects folder on your server. By default, these
are folders located under C:\Program Files\WebFOCUS Visual Discovery
Server AE\Projects. A default installation of the WebFOCUS Visual
Discovery Server AE is created with one subfolder in this directory
named Demo. You can create additional project folders by manually
adding new folders under the Projects folder on your server machine.
We recommend you publish your dashboards into logical groupings
(subfolders) that reflect role or intended access rights as much
as possible. For example, suppose you have three marketing managers,
each responsible for a specific region (East, Central and West), and
a marketing VP that oversees the managers. In this case, a suggested
folder structure is:
|
C:\Program Files\WebFOCUS Visual Discovery
Server AE
|
WebFOCUS Visual Discovery AE portal root
directory
|
|
\Projects
|
Dashboard root folder
|
|
\Projects\AllRegions
|
All Regions dashboards
|
|
\Projects\Central
|
Central Region dashboards
|
|
\Projects\East
|
East Region dashboards
|
|
\Projects\West
|
West Region dashboards
|
Restricting Access with Windows Authentication
By default, the WebFOCUS Visual Discovery Server AE is configured
to allow anonymous access. You can restrict access to dashboards
using Windows Authentication by taking the following steps. We will
assume a folder structure like that noted in the previous section
and make changes to restrict access to dashboards located under
C:\Program Files\WebFOCUS Visual Discovery Server AE\Projects\Central
to users who belong to a domain groups called CentralTeam.
- Go to C:\Program Files\WebFOCUS Visual Discovery Server
AE and open the web.config file in a text editor.
- Change the line specifying authentication mode from this:
<authentication
mode=None />
To this:
<authentication
mode=Windows />
- Save changes to web.config and close text editor.
- Create a new web.config file in the C:\Program Files\WebFOCUS
Visual Discovery Server AE\Projects\Central folder, and add the
following text to the file:
<configuration>
  <system.web>
    <authorization>
      <allow roles=”DOMAIN\CentralTeam” />
      <deny users=* />
    </authorization>
  </system.web>
</configuration>
- Save changes to new web.config file.
These steps will allow users of the CentralTeam group to view
dashboards published to the Central folder, but deny access to all
other users.
Here are some other configurations you can use in step 4 to restrict
access:
Example 1
Use this configuration to allow access to members of the ExecutiveTeam
and CentralTeam domain groups.
<configuration>
  <system.web>
    <authorization>
      <allow roles=”DOMAIN\ExecutiveTeam, DOMAIN\CentralTeam” />
      <deny users=* />
    </authorization>
  </system.web>
</configuration>
Example 2
Use this configuration to allow the domain users Joe and Sally
access, in addition to members of the CentralTeam domain group.
<configuration>
  <system.web>
    <authorization>
      <allow users=”DOMAIN\Joe, DOMAIN\Sally” />
      <allow roles=” DOMAIN\CentralTeam”/>
      <deny users=* />
    </authorization>
  </system.web>
</configuration>
Example 3
Use this configuration to allow all users access.
<configuration>
  <system.web>     <authorization>
      <allow users=* />
    </authorization>
  </system.web> </configuration>
Access rights defined in a web.config file apply to all resources
located in the folder, and to resources located in any subfolders
unless overridden by a web.confilg file at the subfolder level.
For example, the web.config file at the virtual directory root might
specify that by default all authenticated users have access to all
resources in the portal, but a separate web.config file located
in a subfolder containing strategy reports might grant access rights
only to upper management.
Restricting Access using Custom Authentication
Since the WebFOCUS Visual Discovery Server AE is an ASP.NET application,
you can leverage the security capabilities built into the ASP.NET
platform to build your own security mechanism and integrate it into
a WebFOCUS Visual Discovery Server AE installation. This allows
you to integrate into an existing environment where access rights
might be kept in a central repository as part of a single sign-on
environment. In that case, you could provide the logic to check
access rights (in addition to doing the authentication) and based
on results relay to ASP.NET whether to display the requested page
or deny access.
For details on using custom authentication, you can search the
online Microsoft Knowledge Base (http://support.microsoft.com/)
on the phrase “Forms Authentication”, or various books covering
ASP.NET 1.1 by publishers such as Microsoft Press, O’Reilly & Associates,
or Wrox Press.
x
You can author dashboards that honor enterprise data
security policies based on user credentials. This capability allows
dashboard authors to author a single dashboard and publish it to
a group of users who, when accessing that dashboard, will see only
the data that they are authorized to see.
Access to the data within a project is controlled by a security
strategy that must be defined and installed within the project directory
area of the AE Server. A security strategy is a set of associations
between users and data values, and whether those data values should
be included or excluded from the display of data present to them
when viewing a project. There may be one or more data strategies
that are identified by name. When a project is published one of
the configured data strategies may be selected to control access to
the project data.
Data strategies are defined within files placed in the project
directory of the AE Server. These files are named 'data security.config'
and may be placed within project subdirectories or in the root project
directory. A data security file placed within a subdirectory will
be located and used for projects published to that subdirectory
and a data security file located in the root project directory will
be utilized for all other projects. This allows for security strategies based
upon the directory that a project is published to with a default
strategy located in the root directory. Note that all security strategies
must have entries within the root project configuration file, if
a strategy is defined within a subdirectory it may have an empty definition
in the root. Without the definition in the root, the strategy will
not be available for selection when publishing.
An empty data security file is installed in the project root
directory and may be used as a starting point. The data security
files are formatted XML files. An example of a set of security strategies
might be:
<DataSecurityStrategies>
	<Strategy id=abc name=Sales Regions>
		<User name=YourDomainName\fflintstone>
			<ValueList filterType=include>
				<Value>West</Value>
				<Value>East</Value>
			</ValueList>
		</User>
		<User name=YourDomainName\wflintstone>
			<ValueList filterType=include>
				<Value>South</Value>
				<Value>West</Value>
			</ValueList>
		</User>
		<User name=anonymous>
			<ValueList filterType=exclude>
				<Value>West</Value>
			</ValueList>
		</User>
	</Strategy>

	<Strategy id=123 name=Historical Quarters>
		<User name=YourDomainName\brubble>
			<ValueList filterType=include>
				<Value>Q1</Value>
				<Value>Q2</Value>
			</ValueList>
		</User>
	</Strategy>
</DataSecurityStrategies>
This file defines two data strategies named 'Sales Regions' and
'Historical Quarters'. Within the 'Sales Region' strategy the user
'YourDomainName\fflintstone' will only see data that corresponding
to rows having the values 'West' and 'East'. The user 'YourDomainName\wflintstone'
will only see data values corresponding to rows having the values
'South' and 'West'. Any user that is not authenticated (the 'anonymous'
User entry) will be excluded from seeing any data that corresponds
to rows having a value of 'West'. The second security strategy is
named 'Historical Quarters' and only specifies that the user 'YourDomainName\brubble'
will see data values corresponding to rows having the values of
'Q1' and 'Q2'.
Specific notes about the fields within the data strategy:
The 'id' attribute of a Strategy must be unique among your strategies
and should never be changed. This value is embedded within project
files as they are published. If a strategy is further defined within
a configuration file in a project subdirectory it must have the
same identifier. The 'name' attribute of the strategy may be changed
and is only used for display and selection of the available strategies
when a project is published.
A User is specified with their full login domain and user name.
The case of the entered values is ignored, but the formatting and
spelling of the values must be exact. A user name of 'anonymous'
may be used to match users that are not authenticated with the server.
Each user will have a ValueList that contains one or more Value
elements that correspond to data values within a field in a project's
data pool. These data values must be entered exactly as they exist
within the data, case is observed to match values. This set of values
will be included or excluded from the data within a project based
on the filterType attribute setting of 'include' or 'exclude'. Any
entry specified here that does not start with 'inc' will be considered
to be an exclusion.
To exclude all data for a specific user create a ValueList with
a filterType of 'include' without any Value elements.
If the 'anonymous' user entry is not present, access by non-authenticated
users will be denied.
A single configuration file may contain multiple Strategy elements.
A security Strategy may have multiple User elements, a ValueList
may have multiple Value elements, but a User is only expected to
have one ValueList.
Server Configuration
Before publishing dashboards to the server, you must make sure
that the Server AE installation has been configured properly. This
implementation relies upon Windows integrated security to identify
users. You must modify the web.config file in the Server AE directory
of your IIS installation to enable Windows integrated security to
be utilized.
- Open up the IIS tree under Computer Management on your server.
Browse to the ADV virtual directory and open up Properties. Under
the Directory Security tab, make sure to check the box for “Windows
integrated security”. This will set up IIS to pass Windows user
credentials from the browser session to authenticate the users.
- Modify the web.config file in the Server AE installation directory.
Under the <system.serviceModel> key, comment out the default
anonymous bindings and select an appropriate security mode from
the available choices that support Windows authentication.
- Copy the data security.config file that you created above to
the Server AE Projects directory.
- The server is now configured for credential filtering.
Specifying Security when Publishing
When publishing a project to the server an additional dialog
page is provided to configure data security for the project if there
are data security strategies configured for the server. To enable
data security, check the 'Enable Data Security' check box and provide values
for the Table, Field, and Strategy names. The Table and Field values
are used to identify the table and field within the data pool that
must contain the values specified within a desired security strategy
as explained above. The Strategy is the name of the desired security
strategy that was created above. The Strategy names are collected
from the data security configuration file that is installed in the
root of the AE Server project directory.
Important: When selecting a data field for security insure
that the selected field is not used in a text filter within the
project. Only one text filter per data field is currently supported.
A text filter accessible by the user would allow them to override
the values specified by the security strategy. If it is desirable
to have a text filter available to further exclude field items a
second field should be create with a copy operation for the field specified
to the security strategy. This copied field should then never be
used in a text filter.
x
The Template Library stores information on the following
Project items on a machine:
- Data Sources
- Page Layouts
- Custom Color Scales
- Custom Color Schemes
These items may be shared across all projects on your machine.
You can share all items or individual items. You can maintain and
post Template Libraries centrally.
A Template Library is accessed and maintained from the Tools
menu with the Import Template Library ... and Export Template Library
... menu items:
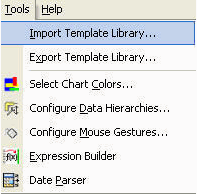
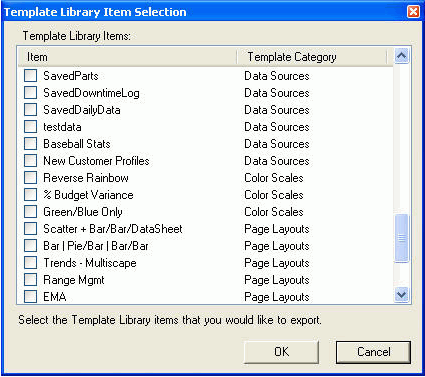
These menu items invoke the Template Library Item Selection dialog,
which is used to specify which items to export or import to or from
a Template Library.
xEmbedded Data in a Project
Create an Embedded Data Project Automatically
- You can eliminate the overhead of expensive database queries
during production hours by pre-extracting the data.
- You can control when queries are performed.
- The embedded data is encrypted and compressed, so it is secure
and takes less space than an extract.
Adv2Advm Utility
The Adv2Advm utility performs this task. It is available in the
installation directory for WebFOCUS Visual Discovery Workbench AE.
This utility converts a .adv project file to a .advm profile file.
It runs the .adv project file to extract the data from its Data
Source, than saves the result to a .advm file.
You can use the Windows scheduler to run this utility at regular,
specified intervals.
The process to use this utility is:
- Publish a project to the WebFOCUS Visual Discovery Server
AE with the embedded data option checked. This places a .advm version
of the project in the WebFOCUS Visual Discovery Server AE.
- Copy your .adv project to a spot on the WebFOCUS Visual Discovery
Server AE; it does not have to be in the server installation directory.
- Use Windows Scheduler to schedule the Adv2Advm utility to convert
this .adv project file to a .advm project at regular intervals.
Adv2Advm may be used to convert one file at a time using command
line parameters, or a list of files may be passed to it in a list
file.
The command line parameters are:
-
-i. The input file
-
-o. The output file
-
-l. A list of files to convert
-
-p. Keep the command running after completing conversions.
Adv2Advm normally terminates immediately, but this makes it impossible
to read any message on the screen; use this to have the process
window remain so that message can be read.
Command switches that specify files should be followed by a ':'
and then the file name, and file names with embedded spaces should
be quoted. Command switches may appear in any order on the command
line. For example:
adv2advm -i:C:\WebFOCUS Visual Discovery Projects\My Project.adv -o:\C:\WebFOCUS Visual Discovery Projects\My Project.advm
This example will convert the My Project file into one with embedded
data in the C:\WebFOCUS Visual Discovery AE Projects directory.
If multiple files are to be converted, a list file may be used
to specify multiple projects. for example:
adv2advm -l:C:\WebFOCUS Visual Discovery Projects\Project List.xml
This will convert the list of projects in the Project List.xml
file.
The format of the project list file is a simple xml structure
containing the list of input and output file names. An example of
the contents of a list file is:
<projectList>
	<project>
		<i>C:\WebFOCUS Visual Discovery Projects\eFashion Bars.adv</i>
		<o>C:\WebFOCUS Visual Discovery Projects\eFashion Bars.advm</o>
	</project>
	<project>
		<i>C:\WebFOCUS Visual Discovery Projects\eFashion Cities.adv</i>
		<o>C:\WebFOCUS Visual Discovery Projects\eFashion Cities.advm</o>
	</project>
	<project>
		<i>C:\WebFOCUS Visual Discovery Projects\eFashion Summary.adv</i>
		<o>C:\WebFOCUS Visual Discovery Projects\eFashion Summary.advm</o>
	</project>
</projectList>
Note: The projectList and project elements may be called
anything, but each 'project' element must contain an 'i' and 'o'
element containing the input and output file names for that project.
The processing of the Adv2Advm utility is logged through the
standard logging mechanism used in the other desktop applications,
as well as to the displayed user interface.


