Using PowerPoint Output Format and PowerPoint Templates
You may select PowerPoint as an output format in Developer
Studio which enables you to:
- Create single
reports in PowerPoint format.
Selecting PowerPoint as the output
format creates a PowerPoint document with a single slide that includes
the report.
- Add multiple
graphs and images to a PowerPoint presentation.
The PowerPoint
output format can contain a variety of graphs positioned anywhere on
a slide to create a visual layout.
- Use a PowerPoint
template.
A PowerPoint report can be placed inside of an existing
PowerPoint presentation. This enables you to populate existing presentations
with preset Slide Masters, styling, and other business content.
PowerPoint templates are stored on the server with a .MHT extension
and can be distributed automatically with ReportCaster.
- View and Edit
the PowerPoint Output
Choosing the PowerPoint output format enables
quick editing and customization of your report in Microsoft PowerPoint.
x
Procedure: How to Use PowerPoint as the Report Output Format in Report Painter
-
In Report
Painter, click Output from the Report menu.
The Report Options dialog box opens at the Output tab.
-
From
the Select Format drop-down list, click PowerPoint as
the output format for the report.
-
Click OK to
close the Report Options dialog box.
Note: You may also select PowerPoint from
the Output Format toolbar.
-
Save
and run your report.
A PowerPoint output slide, that includes the report, is
created, as shown in the following image.
-
To reposition
the report output on the PowerPoint slide, use the Page Margins
options, located on the Format tab of the Report Options dialog
box, which is shown in the following image. Increasing the top margin
will move the output down on the slide, and increasing the left
margin will move it to the right.
-
Save
and run the report again to see any adjustments.
x
Procedure: How to Add Images to Your PowerPoint Report
You
can add images, such as logos or backgrounds, to your PowerPoint
report. To successfully import an image into a PowerPoint report,
the image must be either a GIF or JPEG file type. Other file types
are not supported in the PowerPoint output format. Images must be
located on the WebFOCUS Reporting Server application directory.
Note: The PowerPoint
output format cannot generate a Uniform Resource Locator (URL) that
references an image.
-
In Report
Painter, click Images from the Report menu.
The Report Options dialog box opens at the Images tab.
-
Select
the File Name option button (default) in the Image Source box and
type the path of the image file in the entry field.
or
Click Browse to select
the image file from the Open dialog box.
-
Click Add to
add the image file to the list box.
-
Click OK to
add the image to the report.
Tip: You
can easily add images to your PowerPoint output by placing the image
in the Slide Master of a PowerPoint template. The template file
can be utilized by all users and eliminates the need to add image
files to the Reporting Server. For more information about PowerPoint
templates, see How to Use a PowerPoint Template in Report Painter.
x
Procedure: How to Add Graphs to Your PowerPoint Report in Report Painter
Adding
a graph to PowerPoint works in the same manner as adding a static
image file. The graph is rendered as a static image, held or saved
on the Reporting Server, and then embedded into a report. There
is no limit to the number of graphs you can add to a single PowerPoint
report and the graphs can be positioned anywhere in the output.
-
From
the Procedure Viewer, create a Graph.
InfoAssist opens.
-
Create the
graph or graphs you want added to your PowerPoint report.
-
From
the Format tab, click File and click Select a location and
format.
The Select a location and format dialog box opens.
-
Name the
graph or graphs and select either GIF or JPEG as the output Format
type.
Note: To successfully import a graph into a report,
you must select either GIF or JPEG as your graph output format.
All other graph output formats are not supported in PowerPoint.
-
Save
the graph and close the InfoAssist.
-
Following
the graph in the same procedure, create a report with Report Painter,
as shown in the following image.
-
Click Images from
the Report menu.
The Report Options dialog box opens at the Images tab.
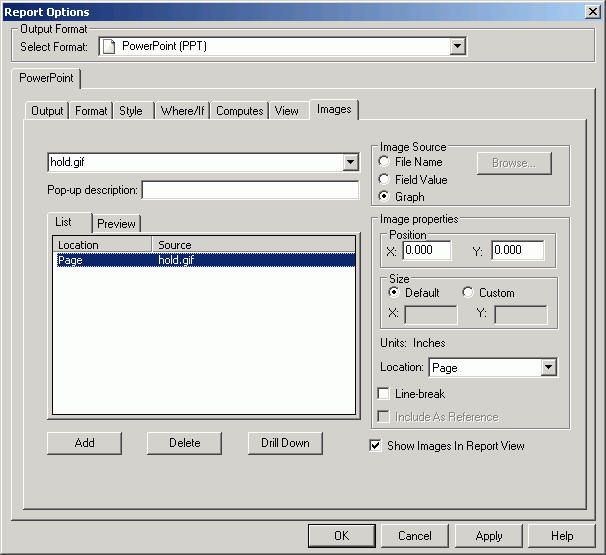
-
Select the Graph option
button in the Image Source box and type the path of the image in
the entry field, as shown in the following image.
or
Click Browse to
select the graph HOLD file from the Open dialog box.
Note: When
a graph HOLD file is saved in a procedure, Report Painter detects
this HOLD file and automatically lists it in the Images tab (when
the Graph Image Source option is selected). The graph must precede
the report.
-
Click Add to
add the graph to the list box.
-
Click OK to
add the graph to the report.
The graph is represented with a graphical image and can
now be sized and positioned.
-
Click
the Image view to size and position the graph, as shown in the following
image.
-
Save
and run the document.
The following image shows the document in PowerPoint output
format.
Tip: To
create a presentation that contains only graphs, make the report
invisible. To do this, create a very simple request with an invisible
BY field and a read/record limit of one.
x
Procedure: How to Use a PowerPoint Template in Report Painter
Reports
and graphs can be embedded into an existing PowerPoint template.
The output is placed on a specified slide which can be anywhere
in the presentation.
Note: A
PowerPoint template must contain at least one slide for the report
to populate, but can have as many additional slides as you want.
-
Create
and save a PowerPoint template:
-
Add a blank slide to a document in Microsoft PowerPoint. This
blank slide will be a placeholder for the WebFOCUS report.
Note: This slide will be completely replaced when
you execute the report, so any objects added to this slide will
be lost when the report is executed.
Tip: Objects added
to the PowerPoint Slide Master will remain intact.
The following
image is an example of the template in PowerPoint showing the slide
master.
-
Save the document as a Web archive (.MHT extension) on your WebFOCUS
Reporting Server application directory.
Tip: Since the Reporting Server cannot differentiate
between Excel and PowerPoint template files (.MHT), it is important
to apply a naming convention to your template files. This will help
you organize and distinguish the different Excel and PowerPoint
template files when developing your reports. For example, Excel_template.MHT
or PPT_template.MHT.
-
In Report
Painter, click Output from the Report menu.
The Report Options dialog box opens at the Output tab.
-
Use
the drop-down list to click PowerPoint as the
selected output format.
-
Click
the Format tab of the Report Options dialog
box.
-
Select
the Use template check box.
The drop-down list populates with the available PowerPoint
templates to choose from.
Note: In order for your PowerPoint
template to appear in the drop-down list, it must be saved in your
WebFOCUS Reporting Server application directory. This list displays
all .MHT files in the server path.
-
Select
a slide to populate.
The slide number is the number of the slide in the document.
For example, if you have five slides in your document and you designated
the second slide for the WebFOCUS report, then you would enter 2,
as shown in the following image.
-
Click Apply,
and then OK in the Report Options dialog
box.
-
Save
and run your report.
The report and graph is embedded in the selected PowerPoint
template on the selected slide, as shown in the following image.
Tip: PowerPoint
templates can be utilized by multiple users and automatically distributed
with ReportCaster. This ensures that all reports are consistent
and show the standard styling, logo, and so on, for your organization.
xCreating, Viewing, and Editing PowerPoint Output
When browsing or viewing PowerPoint files from the Internet
Explorer web browser, a PowerPoint presentation will normally open
within the web browser. However, you can change this by customizing
the PPT file type properties in Windows. If you uncheck the Browse
in same window property, PowerPoint will open in a new window separately
from the browser. If you uncheck this option and a PowerPoint report
is executed by WebFOCUS, the report opens in slide show mode and
cannot be edited.
The following image is an example of a PowerPoint output in slide
show mode.
To view and edit your PowerPoint output, change your settings
so that PowerPoint documents open in the same window.
x
Procedure: How to Change the Output Options for PowerPoint Documents
-
From
Windows Explorer, click Folder Options from
the Tools menu.
-
Click
the File Types tab and select PPT (Microsoft PowerPoint
Presentation).
-
Click Advanced from
the Details for PPT extension section.
The Edit File Type dialog box opens.
-
Click Open from
the Actions list.
-
Select
the Browse in same window check box, as shown
in the following image.
-
Click OK to
close the Edit File Type dialog box.
-
Click Close to
close the Folder Options dialog box.
-
From
Report Painter, run the PowerPoint report.
The PowerPoint output appears in the same window.
-
Right-click
and select Edit Slides, as shown in the following
image.
PowerPoint
opens in a web browser with full editing capabilities, as shown
in the following image.
x
Reference: Redirection With PowerPoint Output
Redirection
is turned off by default for the PowerPoint format. This can keep
the output from updating when trying to re-execute a PowerPoint
report and targeting the same output frame.
For example,
if using the autoprompt facility with PowerPoint output, the target
frame may not update when changing parameter values and running
the report. For more information about Changing Redirection Settings,
see the WebFOCUS Security and Administration manual.