How to: Reference: |
An active report is a report that is designed for offline analysis. When using an active report, a user can:
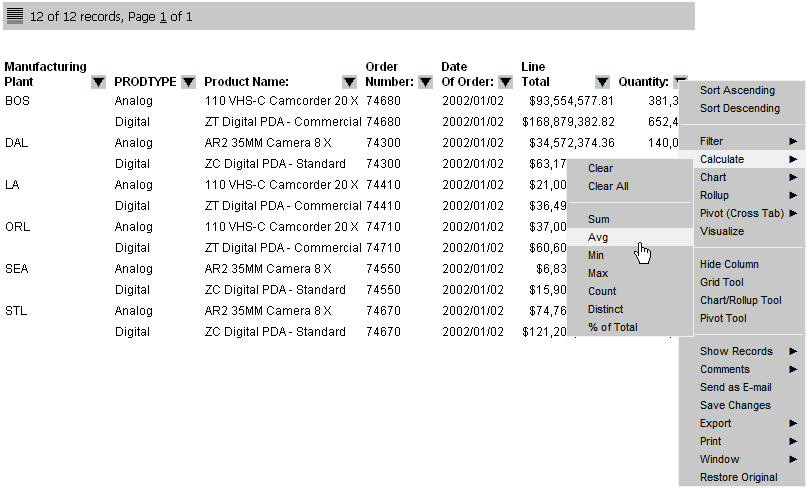
The following image shows a simple HTML active report. The record status and page navigation bar appears at the top of the report.
You can save existing reports as active reports. If you do this, be sure to modify any unsupported features as necessary.
For more information about using active reports, see the Active Technologies User's Guide.
The Report Options dialog box opens.
Tip: You can also select active report for Adobe Flash Player (FLEX) or active report for PDF (APDF).
The following image shows the Features tab of the Report Options dialog box for the active report formats.
Because all post-retrieval processing is performed in the memory of the web browser, an active report has a processing limit of approximately 5,000 records or 100 pages of output. The active cache option enables you to send only the first page of active report output to the browser and retrieve subsequent pages from a temporary cache on the WebFOCUS Reporting Server. The server also becomes the resource for performing all calculations, sorting, and filtering when active cache is enabled. Since active cache uses on-demand paging functionality, WebFOCUS Viewer is not supported.
Enables reports to cache the data in a binary file and return the data to the output window in pre-set increments.
In Report Painter, the active cache option is not applicable to active reports for Adobe Flash Player.
The number of rows retrieved in the output. The default number of rows retrieved is 100.
Tip: It is recommended that you set the number of rows retrieved five times greater than the number of lines retrieved per page (as indicated in SET LINES). The minimum number of rows retrieved is 100.
Enables you to turn on calculations for fields in the report. All visible fields in the report appear in the Column list in the order they appear in the report. Hidden fields do not appear in the Column list.
You can select a calculation for each field in the Column list from the Calculation drop-down list. Calculation options are determined by the field type. If the field is an alphanumeric format, the drop-down list contains: Count and Count Distinct. If the field is a numeric format, the drop-down list contains: Sum, Average, Count, Count Distinct, Minimum, and Maximum.
Specifies that a password is required to view the active report output. Prior to opening the report output, you are prompted to enter a password to unlock the report.
A character string up to 32 characters in length.
Only standard alphanumeric English characters are allowed in the password for an active report in AHTML format. National Language Support (NLS) characters are not allowed in the password. Any NLS character in the password for an AHTML report makes the password invalid.
The date when an active report expires and the report output can no longer be opened (displayed).
Enter the expiration date in year, month, day (yymmdd) format or in day format (1-999 DAYS) where the value indicates the number of days from the current date that the report expires. Valid values are 1 to 999 days. Note that you must enter the number and the word DAYS as part of the value.
In Report Painter, the Viewing restrictions option is not applicable to active reports for Adobe Flash Player.
<Not Set>. No selection has been made.
Legacy. The default JavaScript charts will be used.
Dynamic. This option will change the engine to use Fusion charts.
HTML5. This option will change the engine to use High charts. This is the default chart engine for AHTML and FLEX formatted reports.
Flash. This option will change the engine to use Flex charts, if available.
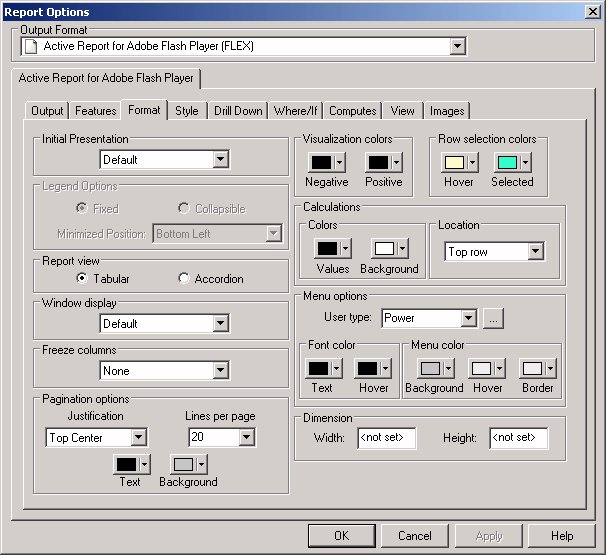
The following image shows the Format tab of the Report Options dialog box for the active report formats. This tab provides options for formatting an active report.
Note: The colors shown on the Format tab are different depending on what style sheet you have selected. The Information Builders style sheet is selected by default.
Sets the active report output to appear as a default active report, Grid, Pivot, or chart. This is especially useful when creating compound reports from other Developer Studio tools. The active report for Adobe Flash Player (FLEX) output format has an additional Other Chart option. The Other Chart option provides the following chart types, which are available by clicking the ellipsis (...) button to the right of the drop-down menu.
Bar charts plot numerical data by displaying rectangular blocks against a scale (numbers or variable measures that appear along the axis). The length of a bar corresponds to a value or amount. You can clearly compare data series (fields) by the relative heights of the bars. Use a bar chart to display the distribution of numerical data. You can create horizontal, as well as vertical bar charts. The following bar chart types are available.
Pie charts emphasize where your data fits, in relation to a larger whole. Pie charts work best when the data consists of several large segments. Too many variables divide the pie into small segments that are difficult to see. Use the different dimensions available to create visual contrast. The following pie chart types are available.
You may receive a JavaScript error message when executing a large chart request, especially a pie chart request.
This happens because HTML active reports run scripts that can time out before they complete. Internet Explorer tracks the script execution count associated with these AJAX controls and by default displays a message when the count exceeds a certain number. To avoid this, you can place an entry in the registry for these scripts and set the value to a high number, such as 5,000,000.
Line charts are useful for emphasizing the movement or trend of numerical data over time. They allow you to trace the evolution of a data point by working backward or interpolating. Highs and lows, rapid or slow movement, or a tendency towards stability are all types of trends well suited to a line chart. The following line chart types are available.
Scatter charts share many of the characteristics of basic line charts. You can plot data using variable scales on both axes. When you use a scatter chart, the data is plotted with a basic line pattern so that you can visualize the density of individual data values around particular points, or discern patterns in the data. The following scatter chart types are available.
Includes a variety of additional charts.
Legend options are applicable when using active report for Adobe Flash Player (FLEX) and active report for PDF (APDF) output formats, where you can click the Legend button to show or hide the chart legend. Legend options are only available when the initial presentation format is set to Bar, Line, Pie, or Scatter chart.
You can set the report view as a standard table (Tabular) or as an expandable report (Accordion). An expandable report is a collapsed report that can be fully expanded for sorting and other purposes.
If you are working with an Accordion active report, the Freeze columns option and Pagination options are not available.
Accordion Reports are not supported when creating HTML active reports using active cache and active reports for Adobe Flash Player.
Accordion Reports do not work when using By Hierarchy data.
Sets the window display option in the report output when multiple windows are open in the active report web browser. Select from Default, Cascade, or Tabs.
The window display option can also be changed directly from the active report web browser.
You can freeze the report at a particular point so that columns to the left of the freeze point remain in view while the user scrolls through the other report columns. Options include:
The Freeze columns option is not available for expandable report (Accordion) views.
You can set the justification for the information that appears in the record status and page navigation bar. You can also set the number of records that appear per page.
The following are the pagination options for active reports.
Controls the location of the record status and page navigation bar, and justifies the text that appears in the bar. Options are Top Left, Top Center, Top Right, Bottom Left, Bottom Center, and Bottom Right. Top Center is the default value.
Sets the number of records that appear per page. Options are Default, 10, 20, 30, 40, 50, and Show All. The default is 57 lines per page.
Sets the color for the text in the record status and page navigation bar. Black is the default color.
Sets the background color for the record status and page navigation bar. Silver is the default color.
Turns the pagination bar off when selected. With the Pagination check box selected, Justification, Text, and Background will be unavailable. By default, this check box is not selected.
Pagination options are not available for expandable report (Accordion) views.
Users can apply data visualization to numeric fields in an active report. You can designate the colors of the bars and set different colors for positive and negative values. The default color for positive and negative values is black.
An active report offers visual assistance for viewing data in the report. For example, when a user hovers over a row of data the row is highlighted with a background color, and when the user clicks a row of data it is also highlighted with a background color. You can set the colors for these options, Hover and Selected. The default color for Hover is RGB(255 252 204), which is pale yellow, and the default color for Selected is RGB(51 255 204), which is blue-green.
Specifies the colors for the values in a calculation.
Sets the location of the calculations. Options are Top row or Bottom row. Top row is the default value.
Set options for the menu.
Select a user type to determine the level of functionality and interactivity available to the user in the report output. The user types are logical groupings of functionality enabling a quick selection of options, and have no dependency on Managed Reporting user types, security, and so on. Each user type can be customized. The user types are:
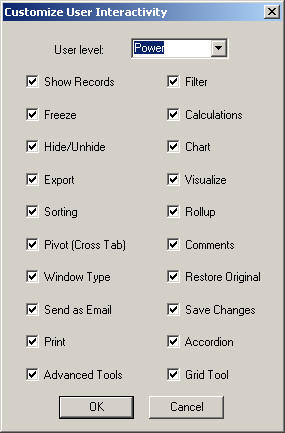
Click the ellipsis (...) button, located next to the User type drop-down list in the Menu options section, to open the Customize User Interactivity dialog box. The Customize User Interactivity dialog box enables you to customize the options for each user type. For a Power user, all options are selected by default. Uncheck any option that you want to hide in the active report.
If you select a combination of options that does not match one of the existing user types (Power user, Analytical user, or Business user), the User level name that appears in the Customize User Interactivity dialog box is Custom user. This is not a default user type or a selectable user type. It is used to show that options for this user do not match any of the existing user types.
Enables you to set the colors for the menu text:
Sets the colors for the menu:
| WebFOCUS |