Viewing Simulated or Live Data in Document Composer
When previewing the report and graph data in Document
Composer, you may view the data in simulated or live mode.
Note: These preview settings are only available in the
Design View of Document Composer and do not affect how data is shown
at run time.
Previewing simulated data sends a request to the reporting server
that gathers formatting information from the Master File. The database
is not accessed, but rather, mock data is used to visually represent
the report. The formatting and styling options applied to the report
are shown when viewing simulated data.
Previewing live data sends a request to the reporting server
and to the database. This is done in order to get a snapshot of
the actual data in the report or graph. You may select the number
of records that appear in the report when previewing live data.
You may also set the read limit and record limit to control the
number of records accessed in the database.
x
Procedure: How to Preview Reports and Graphs Using Simulated Data
-
In Document
Composer, select Options from the Window
menu.
The Developer Studio Options dialog box opens.
-
Select the Document tab.
-
From
the Preview settings option, select Simulated Data.
Note: Live Data is selected by default.
-
Click OK to
close the Developer Studio Options dialog box.
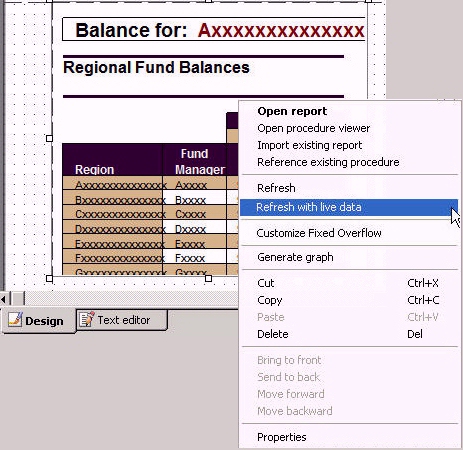
To refresh
a simulated data component, right-click the simulated data component
and select Refresh with live data from the
context menu, as shown in the following image:
x
Procedure: How to Preview Reports and Graphs Using Live Data
-
In Document
Composer, select Options from the Window
menu.
The Developer Studio Options dialog box opens.
-
From
the Preview settings option, select Live Data.
Note: Live Data is selected by default.
-
Use
the spin buttons located to the right of the Record limit for reports field
to increase or decrease the number of records shown in the report.
or
Position the cursor in the Record limit for reports
input box and type a number.
Note: The default record
limit value for the report is 500.
-
Click OK to
close the Developer Studio Options dialog box.
x
Reference: Developer Studio Options Document Tab
The following
image is the Developer Studio Options Document tab:
The following options are available
from the Developer Studio Options Document tab.
-
Grid Settings
-
Settings for Grid include:
-
Show Grid
-
Displays a grid. If this is not selected, the grid is turned
off for all layouts.
-
Snap to Grid
-
Causes objects in the layout to snap to grid lines when being
positioned. For detailed positioning, deselect this option.
-
Width
-
The width of the grid in pixels.
-
Height
-
The height of the grid in pixels.
-
Preview Settings
-
Preview settings include:
-
Report and Graph Preview
-
Previews report and graph data in the Design View. If checked,
additional options are available (Simulated Data or Live Data).
Note: This
option is selected by default.
If unchecked, icons are used
to represent the area in the Design View for reports and graphs.
This is the fastest method of loading reports since no requests
are made to the server.
-
Simulated Data
-
Selecting to preview simulated data sends a request to the
reporting server that gathers formatting information from the Master
File. The database is not accessed, and mock data is used to visually
represent the report.
Note: This option is only available
when previewing reports and graphs.
-
Live Data
-
Selecting to preview live data sends a request to the reporting
server, and to the database, to get a snapshot of the actual data
in the report. This is the default value.
Note: This
option is only available when previewing reports and graphs.
-
Record limit for reports
-
Enables you to limit the number of records used to gather
data for previewing the report in live data mode. For example, if
you set 250 as the record limit for the report, then 250 rows of
data are gathered for the report results. The default value for the
record limit is 500.
Note: This option is only available
if the Live Data option is selected.
-
Use Prefix
-
Selecting Use Prefix will take any
FOCUS syntax in the input box and apply it to the components at
preview time. For example, SQL SQLORA SET OPTIMIZATION OFF. Since
the settings are saved for all documents, you can select the Use
Prefix option to indicate to the tool whether or not to use the
prefix for the specific document.
-
Refresh thumbnails every
-
Indicates how often (in seconds) to refresh the thumbnails.