-
In HTML
Composer, you can add an active report to the layout by using any of the following methods:
- Select New Report from
the Insert menu.
Double-click the report object to create the active report in Report Painter.
- Select New
Report from the Insert menu.
Right-click the report object and select Reference existing procedure from the context menu to add the active report.
- Select Import Existing Procedure from the Insert menu to add the active report.
- Select New Report from
the Insert menu.
-
Add
an active report or active chart object to the layout.
- Select New
Report or New Graph from the
Insert menu.
The cursor changes into a crosshair.
- Drag the crosshair to create an active report or active chart object and adjust it to the size you want.
- Select New
Report or New Graph from the
Insert menu.
-
Select the objects to be synchronized.
- Select the active report or active chart object as the object to be synchronized.
- While pressing and holding the Ctrl
key, select the active report as the report that you want to bind
to.
The synchronize buttons on the Positioning toolbar are activated.
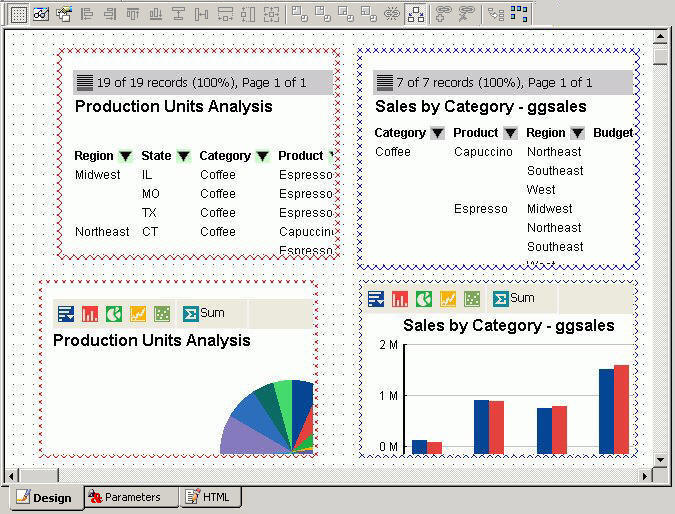
In the example below, the active report is the binding object and the chart object is about to be synchronized to the active report.
The binding object (active report) is indicated by clear boxes around the edges. The synchronized object (active report or active chart object) is indicated by solid black boxes around the edges.
-
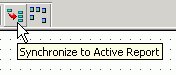
Click the Synchronize to active report button
on the Positioning toolbar.
The active report or active chart object is synchronized and refreshed with data from the active report.
There is no separate procedure associated with these active report objects. If you right-click these items, there are no options to edit the procedure.