You can apply one or more filters to all the active
reports and active charts on an active dashboard. This is called
global filtering. When you apply global filtering to an active dashboard,
you present the selected data in a single analytical view.
xPopulating the Global Filter Drop-Down List
In Document Composer, when you set the Output format
property to active report and the Coordinate report property to
On for a compound document, WebFOCUS generates a drop-down list
at the top of the window when you run the active dashboard. The drop-down
list contains values from which you can select.
WebFOCUS builds the list of values from the first BY field in
the first report on the active dashboard. If the user selects a
value from the list, WebFOCUS filters any report on the active dashboard
that contains the BY field, whether or not it is the first BY field
in the procedure. The BY field in the other reports can be visible
or hidden.
WebFOCUS generates the drop-down list even if there are multiple
tabs on the active dashboard.
When you build an active dashboard, follow these best practices
to populate the drop-down list.
- In the first report,
the first BY field should be the primary field on which to filter from
the drop-down list.
- Include the same
BY field in all other reports that you want to filter. It is recommended,
but not required, that the BY field be the first BY field in the
other reports. The BY field can be either visible or hidden.
- Omit the BY field
in all other reports that you do not want to filter.
Example: Populating the Global Filter Drop-Down List
In Document Composer, the Output format property is set
to active report and the Coordinate report property is set to On
for a sample compound document.
Assume that the
first report on an active dashboard is a pie chart with the following code:
TABLE FILE CENTURYSALES
SUM LINEPRICE
BY COUNTRY
BY REGION
.
.
.
END
The second report on the active dashboard
is a bar chart with this code.
TABLE FILE CENTURYSALES
SUM REGION
BY STATE
BY COUNTRY
.
.
.
TYPE=REPORT,
   COLUMN=COUNTRY,
   HIDE=ON,
$
ENDSTYLE
END
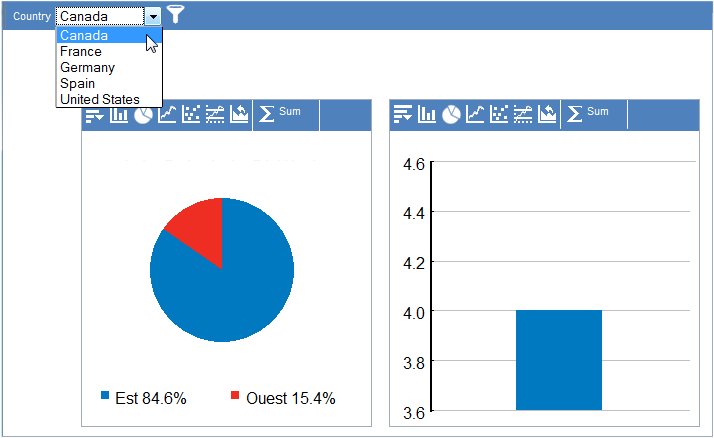
When you run the active dashboard, WebFOCUS
automatically generates a drop-down list with the values for COUNTRY
because COUNTRY is the first BY field in the first report. The following
image shows the drop-down list at the top of the window.
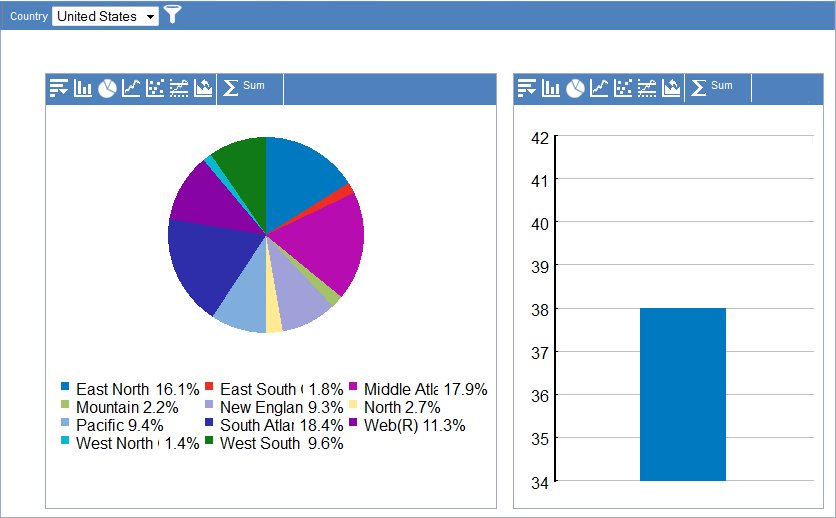
The value selected from the drop-down list
filters both reports because COUNTRY is also a BY field in the second
report. COUNTRY is a hidden field in the second report. The following
image shows the filtered output after you select United States from
the drop-down list.
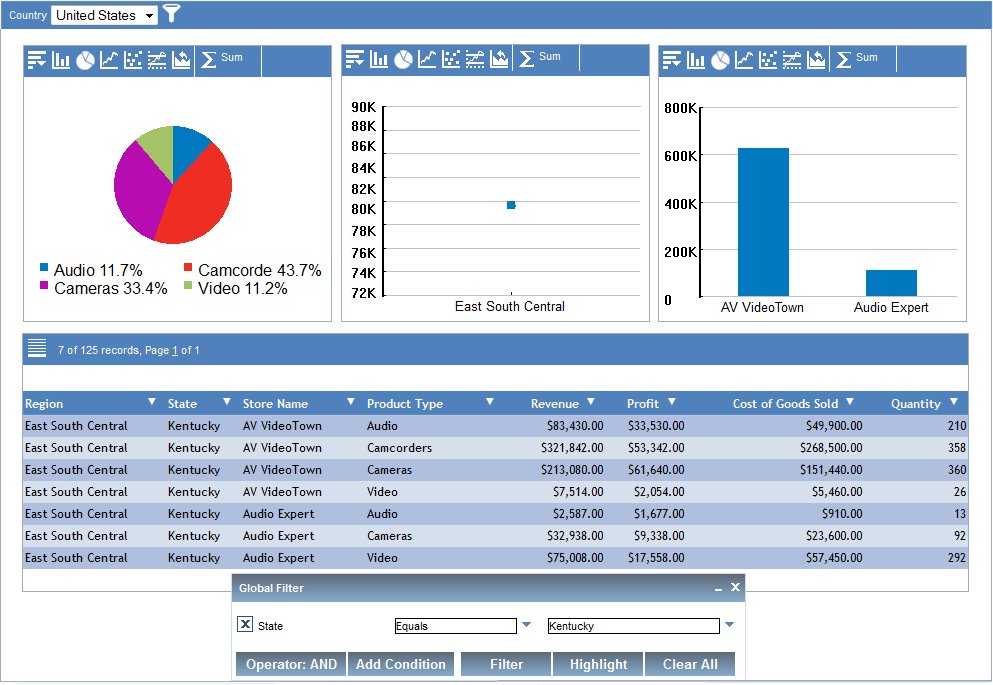
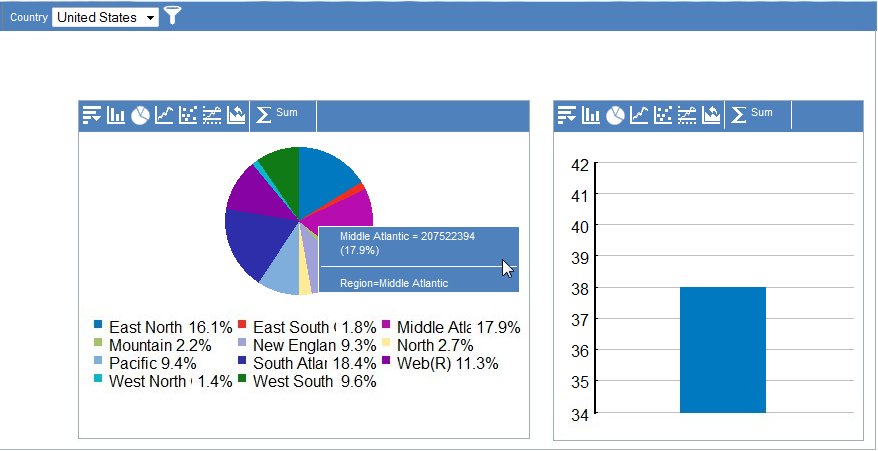
As shown in the following image, you can
now filter the pie chart only on REGION because the chart is already
filtered on COUNTRY from the drop-down list.
xUsing the Global Filter Icon
When you run an active dashboard, you can apply a global
filter to all the reports on the dashboard, using the Global Filter
icon. The Global Filter icon is located at the top of an active
dashboard, to the right of the drop-down lists from which you select
field values.
For information on suppressing the display of the Global Filter
icon, see Controlling the Display of the Global Filter Icon and Dashboard Bar.
When you click the Global Filter  icon,
the Global Filter dialog box opens. For instructions on using that
dialog box, see Applying a Global Filter to a Tabular Report.
icon,
the Global Filter dialog box opens. For instructions on using that
dialog box, see Applying a Global Filter to a Tabular Report.
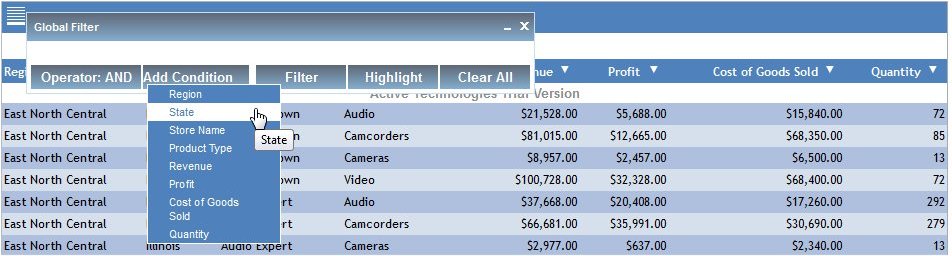
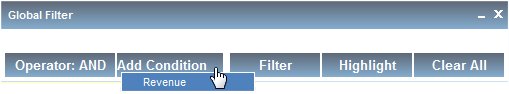
On the Add Condition button on the Global Filter dialog box,
only the fields that are common to the active reports on the active
dashboard are listed. This feature enables you to quickly identify,
select, and filter on a field that is used in all reports.
In the following image, the common field Revenue is selected
on the Add Condition button on the Global Filter dialog box.
Selecting from a list of fields is an alternative to selecting
a field that is graphically represented on a bar chart, pie chart,
or line chart. Selecting from a list of common fields ensures that
you can make meaningful data comparisons on the active dashboard.
xUsing the HIDE StyleSheet Feature
Assume that you have an active dashboard with three
charts (pie, line, and bar) and one tabular report.
For the sample procedures that produce the filtering results
described in this topic, see Pie Chart Procedure, Line Chart Procedure, Bar Chart Procedure,
and Tabular Report Procedure. You may want to refer to the procedures as you
read this topic.
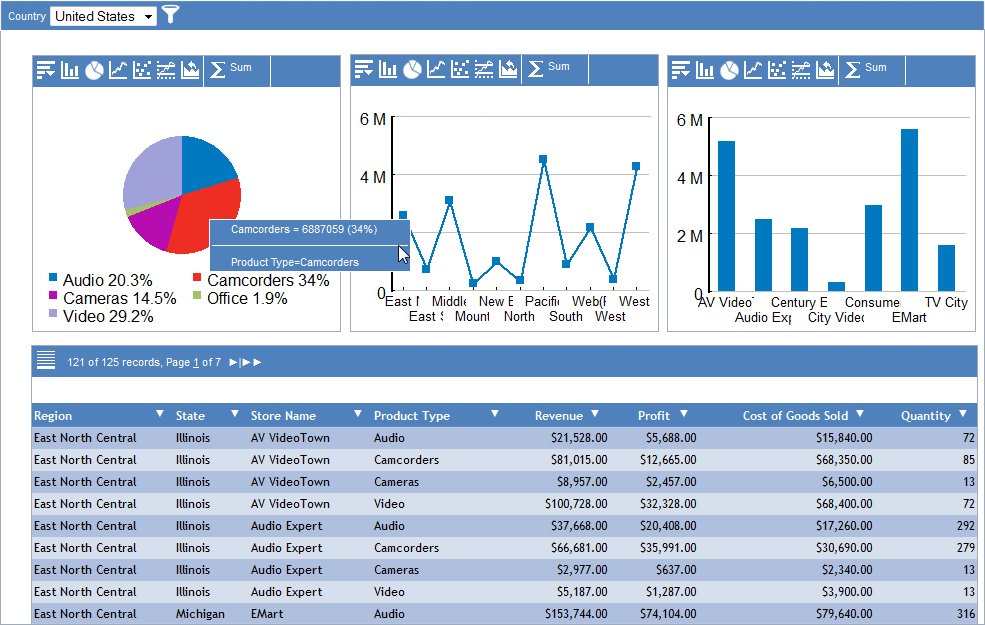
On the pie chart, you want to filter the data using Product Type=Camcorders,
as shown in the following image. You also want to apply that filter
to all the other active reports on the active dashboard to create
a single perspective of the data.
In order for one report to filter a second report, the filtered
field in the first report must also be present in the second report.
The field Product Type is present in the procedure for the pie
chart as a BY field (PRODUCTTYPE). It is also present in the procedure
for the tabular report as a BY field. As a result, WebFOCUS updates
the pie chart and the tabular report with the filter when you run the
active dashboard.
However, if the field PRODUCTTYPE is not present in the procedure
for the line chart or the bar chart, WebFOCUS does not update the
line chart or the bar chart with the filter when you run the active
dashboard.
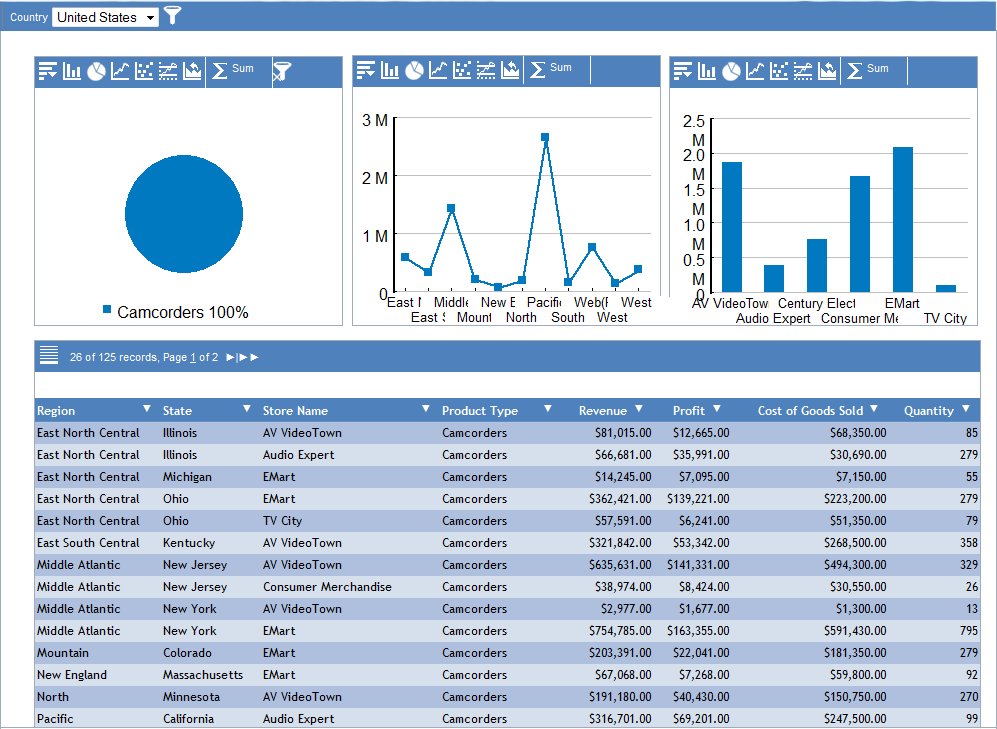
The image that follows shows the result of the filter Product
Type=Camcorders. WebFOCUS updates the pie chart with the filter,
and the value Camcorders is now 100% in the pie chart. WebFOCUS
also updates the tabular report with the filter, and Camcorders
is now the only value that is displayed in the Product Type column.
The pie chart and the tabular report are updated because the procedure
for each one contains the filtered field.
WebFOCUS does not update the line chart or the bar chart because
neither procedure contains the filtered field. The field Product
Type is not used on either axis of the line chart or the bar chart.
To filter the line chart and the bar chart using Product Type=Camcorders,
you must add the field Product Type to the procedures for those
charts. You can add the field Product Type as a hidden field in
both the line chart procedure and the bar chart procedure.
When you run the active dashboard and select the filter Product
Type=Camcorders, the following is generated.
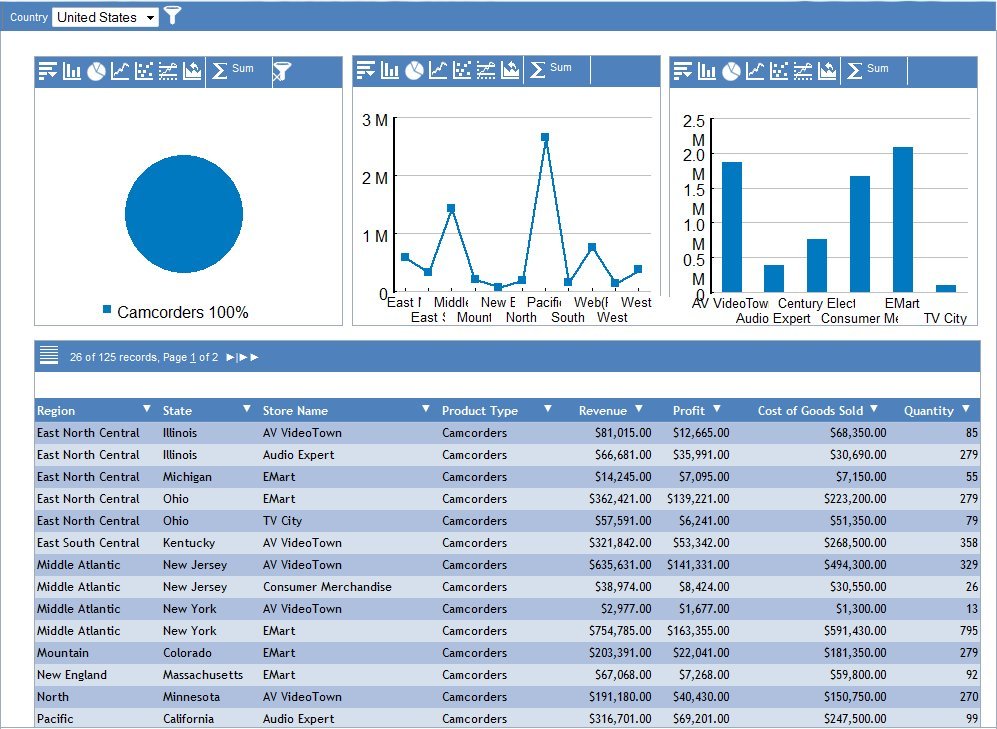
Notice that the line chart and the bar chart are now updated
with the filter Product Type=Camcorders, even though the field is
not displayed in either chart. PRODUCTTYPE is a BY field in the
line chart procedure and the bar chart procedure. Since the field
is desired only for filtering and not for display, it is hidden
in the StyleSheet code of both procedures.
You can filter each active report on the following fields and
values:
- Product Type=Camcorders
(pie chart)
- Region=East North
Central (line chart)
- Store Name=AV VideoTown
(bar chart)
The result of the filtering selections is shown in the following
image. All the active reports on the active dashboard are filtered
with the preceding fields and values.

x
On an active dashboard, you
can remove a global filter from all the reports that were updated
with that filler. The reports are restored to their previous state.
x
Procedure: How to Remove a Global Filter
-
Display
the active dashboard in the browser.
-
Click the
right-most
 icon
above the chart from which you globally filtered the reports on
the active dashboard.
icon
above the chart from which you globally filtered the reports on
the active dashboard.
In the following image, the cursor above
the bar chart points to the correct icon.
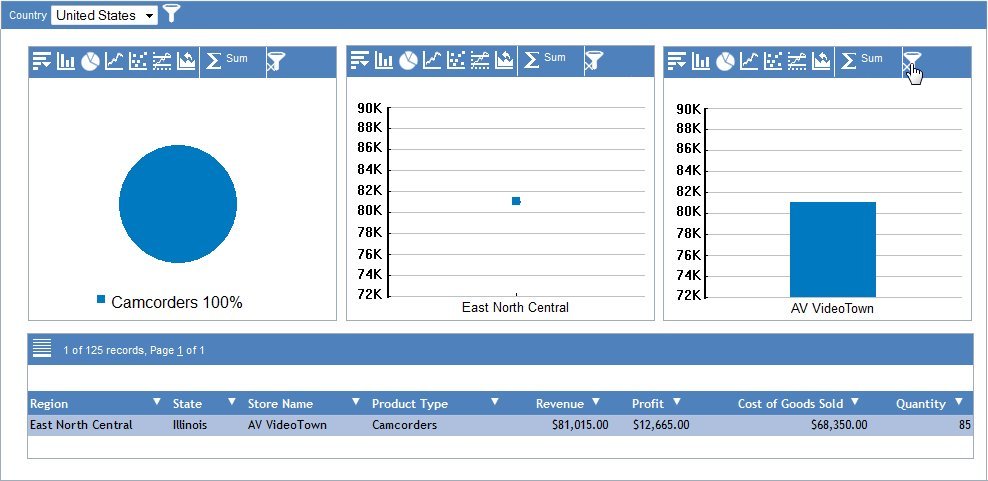
WebFOCUS removes the global
filter from all the applicable reports.
x
Global Filtering Rules for Charts
The following global filtering rules apply to charts
on an active dashboard. Notice that the rules for charts are different
from the rules for tabular reports.
- You can filter a
chart only on a BY field.
- If you filter a chart
on a field that is not present in any other report on an active dashboard,
no other report is filtered.
x
In the example, all procedures include the same SUM
and BY fields.
TABLE FILE CENTURYSALES
SUM
     'CENTURYSALES.ORDERS.LINEPRICE' AS 'Revenue'
     'CENTURYSALES.PRODSEG.PROFIT'
     'CENTURYSALES.PRODSEG.COSTOFGOODSSOLD'
     'CENTURYSALES.ORDERS.QUANTITY'
BY 'CENTURYSALES.STORESEG.COUNTRY'
BY 'CENTURYSALES.STORESEG.REGION'
BY 'CENTURYSALES.STORESEG.STATE'
BY 'CENTURYSALES.STORESEG.STORENAME'
BY 'CENTURYSALES.PRODSEG.PRODUCTTYPE'
.
.
.
All the procedures use the following filter and record limitation
to more easily show the result of a filtering selection, with a
manageable number of items in the charts.
WHERE COUNTRY EQ 'United States' OR 'France';
WHERE RECORDLIMIT EQ 500;
In the HIDE StyleSheet code for each of the four active reports,
different fields are hidden while others are commented. A hidden
field is available for use in the global filter. A line that is
commented in a StyleSheet is ignored, resulting in the display of
a field.
- In the pie chart,
LINEPRICE, COUNTRY, and PRODUCTTYPE are visible.
- In the line chart,
LINEPRICE, COUNTRY, and REGION are visible.
- In the bar chart,
LINEPRICE, COUNTRY, and STORENAME are visible.
- In the tabular report,
all fields except COUNTRY are visible.
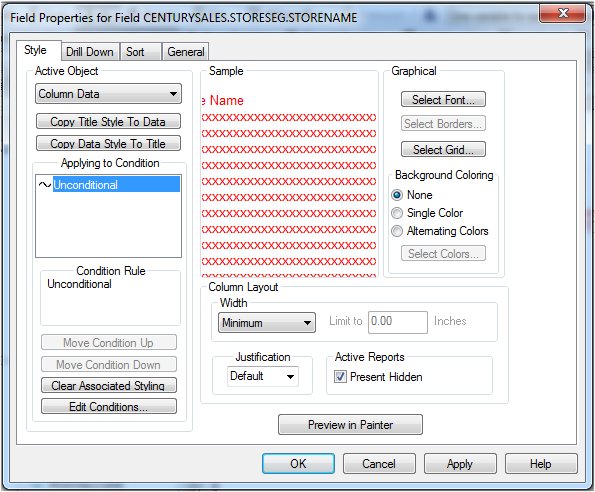
Tip: When you develop an active report in Report
Painter, you can specify that a field is hidden on the Field Properties
dialog box. For instructions on using that option, see Designating a Hidden Field in Report Painter.
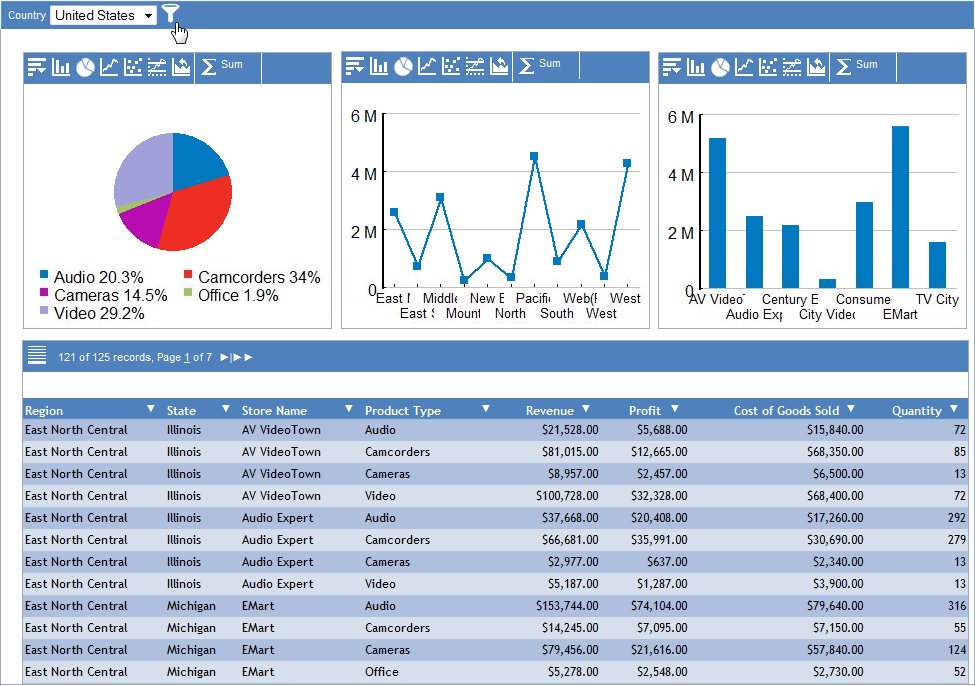
In the example, all active reports on the active dashboard have
the same primary sort (BY) field, which is COUNTRY.
BY 'CENTURYSALES.STORESEG.COUNTRY'
When you run the active dashboard, WebFOCUS automatically builds
a drop-down list that contains the possible values for COUNTRY.
In the sample output throughout the example, the user selected United
States as the value for COUNTRY.
For more information on the drop-down list and development recommendations,
see Populating the Global Filter Drop-Down List.
In the following image, the selected value (United States) for
the primary sort field (COUNTRY) is shown in the tab at the upper-left
of the window.
x
Reference: Pie Chart Procedure
-* File CentSalesChartZero.fex
TABLE FILE CENTURYSALES
SUM
     'CENTURYSALES.ORDERS.LINEPRICE' AS 'Revenue'
     'CENTURYSALES.PRODSEG.PROFIT'
     'CENTURYSALES.PRODSEG.COSTOFGOODSSOLD'
     'CENTURYSALES.ORDERS.QUANTITY'
BY 'CENTURYSALES.STORESEG.COUNTRY'
BY 'CENTURYSALES.STORESEG.REGION'
BY 'CENTURYSALES.STORESEG.STATE'
BY 'CENTURYSALES.STORESEG.STORENAME'
BY 'CENTURYSALES.PRODSEG.PRODUCTTYPE'
HEADING
""
FOOTING
""
WHERE COUNTRY EQ 'United States' OR 'France';
WHERE RECORDLIMIT EQ 500;
ON TABLE SET PAGE-NUM OFF
ON TABLE NOTOTAL
ON TABLE PCHOLD FORMAT AHTML
ON TABLE SET STYLE *
     UNITS=IN,
     SQUEEZE=ON,
     ORIENTATION=PORTRAIT,
$
TYPE=REPORT,
     GRID=OFF,
     FONT='ARIAL',
     SIZE=9,
     LINES-PER-PAGE=20,
     REPORT-VIEW=CHART,
     CHART-TYPE=PIE,
$
-*TYPE=REPORT, COLUMN='CENTURYSALES.ORDERS.LINEPRICE',HIDE=ON, $
TYPE=REPORT, COLUMN='CENTURYSALES.PRODSEG.PROFIT',HIDE=ON, $
TYPE=REPORT, COLUMN='CENTURYSALES.PRODSEG.COSTOFGOODSSOLD',HIDE=ON, $
TYPE=REPORT, COLUMN='CENTURYSALES.ORDERS.QUANTITY',HIDE=ON, $
-*TYPE=REPORT, COLUMN='CENTURYSALES.STORESEG.COUNTRY',HIDE=ON, $
TYPE=REPORT, COLUMN='CENTURYSALES.STORESEG.REGION',HIDE=ON, $
TYPE=REPORT, COLUMN='CENTURYSALES.STORESEG.STATE',HIDE=ON, $
TYPE=REPORT, COLUMN='CENTURYSALES.STORESEG.STORENAME',HIDE=ON, $
-*TYPE=REPORT, COLUMN='CENTURYSALES.PRODSEG.PRODUCTTYPE',HIDE=ON, $
TYPE=TITLE,
     STYLE=BOLD,
$
TYPE=TABHEADING,
     SIZE=12,
     STYLE=BOLD,
$
TYPE=TABFOOTING,
     SIZE=12,
     STYLE=BOLD,
$
TYPE=HEADING,
     SIZE=12,
     STYLE=BOLD,
$
TYPE=FOOTING,
     SIZE=12,
     STYLE=BOLD,
$
TYPE=SUBHEAD,
     SIZE=10,
     STYLE=BOLD,
$
TYPE=SUBFOOT,
     SIZE=10,
     STYLE=BOLD,
$
TYPE=SUBTOTAL,
     BACKCOLOR=RGB(210 210 210),
$
TYPE=ACROSSVALUE,
     SIZE=9,
$
TYPE=ACROSSTITLE,
     STYLE=BOLD,
$
TYPE=GRANDTOTAL,
     BACKCOLOR=RGB(210 210 210),
     STYLE=BOLD,
$
ENDSTYLE
END
x
Reference: Line Chart Procedure
-* File CentSalesChartOne.fex
TABLE FILE CENTURYSALES
SUM
     'CENTURYSALES.ORDERS.LINEPRICE' AS 'Revenue'
     'CENTURYSALES.PRODSEG.PROFIT'
     'CENTURYSALES.PRODSEG.COSTOFGOODSSOLD'
     'CENTURYSALES.ORDERS.QUANTITY'
BY 'CENTURYSALES.STORESEG.COUNTRY'
BY 'CENTURYSALES.STORESEG.REGION'
BY 'CENTURYSALES.STORESEG.STATE'
BY 'CENTURYSALES.STORESEG.STORENAME'
BY 'CENTURYSALES.PRODSEG.PRODUCTTYPE'
HEADING
""
FOOTING
""
WHERE COUNTRY EQ 'United States' OR 'France';
WHERE RECORDLIMIT EQ 500;
ON TABLE SET PAGE-NUM OFF
ON TABLE NOTOTAL
ON TABLE PCHOLD FORMAT AHTML
ON TABLE SET STYLE *
     UNITS=IN,
     SQUEEZE=ON,
     ORIENTATION=PORTRAIT,
$
TYPE=REPORT,
     GRID=OFF,
     FONT='ARIAL',
     SIZE=9,
     LINES-PER-PAGE=20,
     REPORT-VIEW=CHART,
     CHART-TYPE=LINE,
$
-*TYPE=REPORT, COLUMN='CENTURYSALES.ORDERS.LINEPRICE',HIDE=ON, $
TYPE=REPORT, COLUMN='CENTURYSALES.PRODSEG.PROFIT',HIDE=ON, $
TYPE=REPORT, COLUMN='CENTURYSALES.PRODSEG.COSTOFGOODSSOLD',HIDE=ON, $
TYPE=REPORT, COLUMN='CENTURYSALES.ORDERS.QUANTITY',HIDE=ON, $
-*TYPE=REPORT, COLUMN='CENTURYSALES.STORESEG.COUNTRY',HIDE=ON, $
-*TYPE=REPORT, COLUMN='CENTURYSALES.STORESEG.REGION',HIDE=ON, $
TYPE=REPORT, COLUMN='CENTURYSALES.STORESEG.STATE',HIDE=ON, $
TYPE=REPORT, COLUMN='CENTURYSALES.STORESEG.STORENAME',HIDE=ON, $
TYPE=REPORT, COLUMN='CENTURYSALES.PRODSEG.PRODUCTTYPE',HIDE=ON, $
.
.     (remainder of code is same as pie chart code)
.
x
Reference: Bar Chart Procedure
-* File CentSalesChartTwo.fex
TABLE FILE CENTURYSALES
SUM
     'CENTURYSALES.ORDERS.LINEPRICE' AS 'Revenue'
     'CENTURYSALES.PRODSEG.PROFIT'
     'CENTURYSALES.PRODSEG.COSTOFGOODSSOLD'
     'CENTURYSALES.ORDERS.QUANTITY'
BY 'CENTURYSALES.STORESEG.COUNTRY'
BY 'CENTURYSALES.STORESEG.REGION'
BY 'CENTURYSALES.STORESEG.STATE'
BY 'CENTURYSALES.STORESEG.STORENAME'
BY 'CENTURYSALES.PRODSEG.PRODUCTTYPE'
HEADING
""
FOOTING
""
WHERE COUNTRY EQ 'United States' OR 'France';
WHERE RECORDLIMIT EQ 500;
ON TABLE SET PAGE-NUM OFF
ON TABLE NOTOTAL
ON TABLE PCHOLD FORMAT AHTML
ON TABLE SET STYLE *
     UNITS=IN,
     SQUEEZE=ON,
     ORIENTATION=PORTRAIT,
$
TYPE=REPORT,
     GRID=OFF,
     FONT='ARIAL',
     SIZE=9,
     LINES-PER-PAGE=20,
     REPORT-VIEW=CHART,
     CHART-TYPE=BAR,
$
-*TYPE=REPORT, COLUMN='CENTURYSALES.ORDERS.LINEPRICE',HIDE=ON, $
TYPE=REPORT, COLUMN='CENTURYSALES.PRODSEG.PROFIT',HIDE=ON, $
TYPE=REPORT, COLUMN='CENTURYSALES.PRODSEG.COSTOFGOODSSOLD',HIDE=ON, $
TYPE=REPORT, COLUMN='CENTURYSALES.ORDERS.QUANTITY',HIDE=ON, $
-*TYPE=REPORT, COLUMN='CENTURYSALES.STORESEG.COUNTRY',HIDE=ON, $
TYPE=REPORT, COLUMN='CENTURYSALES.STORESEG.REGION',HIDE=ON, $
TYPE=REPORT, COLUMN='CENTURYSALES.STORESEG.STATE',HIDE=ON, $
-*TYPE=REPORT, COLUMN='CENTURYSALES.STORESEG.STORENAME',HIDE=ON, $
TYPE=REPORT, COLUMN='CENTURYSALES.PRODSEG.PRODUCTTYPE',HIDE=ON, $
.
.     (remainder of code is same as pie chart code)
.
x
Reference: Tabular Report Procedure
-* File CentSalesGridOne.fex
TABLE FILE CENTURYSALES
SUM
     'CENTURYSALES.ORDERS.LINEPRICE' AS 'Revenue'
     'CENTURYSALES.PRODSEG.PROFIT'
     'CENTURYSALES.PRODSEG.COSTOFGOODSSOLD'
     'CENTURYSALES.ORDERS.QUANTITY'
BY 'CENTURYSALES.STORESEG.COUNTRY'
BY 'CENTURYSALES.STORESEG.REGION'
BY 'CENTURYSALES.STORESEG.STATE'
BY 'CENTURYSALES.STORESEG.STORENAME'
BY 'CENTURYSALES.PRODSEG.PRODUCTTYPE'
HEADING
""
FOOTING
""
WHERE COUNTRY EQ 'United States' OR 'France';
WHERE RECORDLIMIT EQ 500;
ON TABLE SET PAGE-NUM OFF
ON TABLE NOTOTAL
ON TABLE SET BYDISPLAY ON
ON TABLE PCHOLD FORMAT AHTML
ON TABLE SET STYLE *
     UNITS=IN,
     SQUEEZE=ON,
     ORIENTATION=PORTRAIT,
$
TYPE=REPORT,
     GRID=OFF,
     FONT='ARIAL',
     SIZE=9,
     LINES-PER-PAGE=20,
$
-*TYPE=REPORT, COLUMN='CENTURYSALES.ORDERS.LINEPRICE',HIDE=ON, $
-*TYPE=REPORT, COLUMN='CENTURYSALES.PRODSEG.PROFIT',HIDE=ON, $
-*TYPE=REPORT, COLUMN='CENTURYSALES.PRODSEG.COSTOFGOODSSOLD',HIDE=ON, $
-*TYPE=REPORT, COLUMN='CENTURYSALES.ORDERS.QUANTITY',HIDE=ON, $
TYPE=REPORT, COLUMN='CENTURYSALES.STORESEG.COUNTRY',HIDE=ON, $
-*TYPE=REPORT, COLUMN='CENTURYSALES.STORESEG.REGION',HIDE=ON, $
-*TYPE=REPORT, COLUMN='CENTURYSALES.STORESEG.STATE',HIDE=ON, $
-*TYPE=REPORT, COLUMN='CENTURYSALES.STORESEG.STORENAME',HIDE=ON, $
-*TYPE=REPORT, COLUMN='CENTURYSALES.PRODSEG.PRODUCTTYPE',HIDE=ON, $
.
.     (remainder of code is same as pie chart code)
.