As you monitor Data Service activity,
you can also perform the following administrative tasks from the
Web Console:
x
Displaying and Customizing a Data Service Agents Page
This topic describes how Server Administrators can display
the Data Service Agents page for all Data Services or for an individual
Data Service. Server Administrators access the page from the Workspace
on the Web Console menu bar, using the Agents menu option for Data
Services.
If you are a user other than a Server Administrator, you can
access the same page and the same statistics from My Console on
the Web Console menu bar. With the Manage My Agents option, you
can monitor and manage your own agents, that is, the agents that
match your user ID. If granted the applicable privileges, you can
also monitor, or monitor and manage, the agents of the other users
in your group.
x
Procedure: How to Display and Customize the Data Services Agents Page
-
From the
menu bar, select Workspace.
-
From the
ribbon, click the Agents icon, or right-click
the Workspace or Data Services folder
In the navigation pane, and select Agents.
The Data Services Agents page opens on the right.
The
table in Data Service Agents Performance Parameters describes all the statistics
that you can display on the page.
-
To choose
specific statistics that you want to display on the report, click Choose
Columns.
The pane that opens lists the available statistics, grouped
by category, such as General, Client Information, and FOCUS Information.
A description of each statistic is provided in the right column
of the pane, to help you tailor the page for your needs.
Select
the check box for each statistic that you want to display on the
page, and de-select the check box for each statistic that you do
not want to display.
Optionally, you
can:
- Use the arrow buttons
to the left of a category to open (expand) the category or close
it.
- Select the check
box to the left of a category (for example, to the left of General),
to select all the statistics in that category.
Click OK when
you have made your selections.
The following image shows the
General and Client Information sections.
The
following image shows the FOCUS Information, Adapter Information,
and Change Data Capture Info sections.
The following image
shows the File Listener Info and System sections.
-
To filter
the values that you want to display on the page, click the Choose
Rows button.
The pane that opens lists the values for the State statistic.
Select the check box for each value that you want to reflect on
the page, and deselect the check box for each value that you do
not want to reflect. For example, if you select the check box for in
use and the check box for crashed,
only the agents whose State is in use or crashed will be displayed
on the page.
Optionally, you can:
- Use the arrow buttons
to the left of State to open (expand) the statistic or close it.
- Select the check
box to the left of State to select all the values for that statistic.
The
following image shows the pane from which you can filter the values
for State on a Data Service Agents page. In this example, the agents
whose State is in use or crashed will be displayed on the page.
-
Click OK when
you have filtered the page as desired.
You are returned to the Data Service Agents page. The following
image shows a sample customized report with selected statistics.
In this example, the agents identified as Tscomid 1 through 6 were
killed, as described in How to Kill One or More Data Service Agents.
-
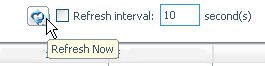
At the upper-right
of the report pane, optionally click Refresh Now to
refresh the statistics, or click the Refresh interval check
box and type the number of seconds between automatic refreshes.
In the following image, the cursor is pointing to the Refresh
Now button.
x
Procedure: How to Display and Customize a Data Service Agents Page Associated With a Selected Service
Since
agents are associated with services, you may wish to display current
service statistics.
-
From the
menu bar, select Workspace.
-
In the navigation
pane, expand the Data Services folder.
-
Right-click
the name of the service on which you want to report, for example, WC_DEFAULT.
-
From the
menu, click Agents.
The Data Service Agents page associated with the selected
service is displayed on the right. The table in Data Service Agents Performance Parameters describes all the statistics that
are provided on the page.
-
You can
customize and filter the report, as described in How to Display and Customize the Data Services Agents Page.
x
Reference: Data Service Agents Performance Parameters
The following statistics
can appear on a Data Service Agents page. Each agent is represented
as a separate row on the report.
General
- Tscomid
-
Identification number associated with the Data Service Agent.
- Service
-
Name of the data service for the agent.
- State
-
Current state of the agent. Possible values are in use, DBMS
call, idle, aborted, crashed, stopping, or starting.
A session
connects and is in use until the moment that it disconnects.
This includes all time spent between a session suspension and resumption
when the process is not using the CPU but still has resources allocated
for at least one session.
DBMS call indicates that
the agent is waiting for a database to return data.
Idle
means that the agent is not connected. It has no sessions at all,
whether active or suspended.
Aborted and crashed are abnormal
states resulting from a fatal software error detected by the program
(aborted) or by the operating system (crashed). The agent process
is no longer running, and these states are provided for diagnostic
purposes. The Server Administrator can clear (using the kill option)
such agents after the problem is investigated.
Stopping and
starting are normal transitory states, which are self-explanatory.
Client Information
- User
-
User ID associated with the server connection.
- Group
-
Group ID associated with the server connection.
- Client Session
-
Session ID uniquely identifying the client session.
- Client Address
-
For some protocols, the network address of the connected client.
- Code Page
-
Character code page used by the client connected to the session.
- Defer ID
-
Unique identifier assigned to the submitted deferred request.
- Scheduler Job ID
-
Unique identifier assigned to the last submitted scheduled
or CMASAP request.
FOCUS Information
- Query Time
-
Last time that a request to the agent was made. This value
is used to calculate the time that an agent is idle, in cases in
which an idle agent limit was set.
- Command
-
First eight characters of the last instruction executed by
the data access agent.
- Procedure
-
Displays the procedure currently being executed or completed
by each agent. For example, when a procedure, which is a part of
a job, executes another procedure, the name of this procedure is
shown in a Procedure column.
- Top Level Procedure
-
Displays calling procedures or calling flows executed or
submitted by agents.
Note: This column is not shown
by default on the Data Services Agents page. To display it, click Choose
Columns, select its check box on the Select the columns
that will appear on the Agents page, and click OK.
- Master File
-
Name of the last Master File that was processed by the agent.
The displayed name can be up to 64 characters.
- Executed Class
-
Last Java class executed. This value includes explicitly
called Java classes (such as CALLJAVA), and implicitly called classes
(such as GRAPH FILE).
- Response Time
-
Time from the moment that the server receives the request
(regardless of the requesting tool, that is, Web Console, DataMigrator,
or WebFOCUS) until the request completes and the response is sent
to the requester.
- Server Time
-
Response time minus DBMS processing time.
- Error Number
-
Last &RETCODE that is set upon procedure (FOCEXEC) completion.
Zero (0) is normal. Any other value indicates an abnormal completion.
- Focus I/O
-
Number of FOCUS I/O operations performed by the agent.
- Foccache Ticket
-
Unique identifier assigned to the last request that used
the foccache directory.
- Number of Transactions
-
Number of transactions or HLI commands performed by the agent.
Adapter Information
- DBMS I/O
-
Number of external I/O operations performed by the agent.
- DBMS Time
-
Amount of DBMS processing time in seconds.
Change Data Capture Information
- Source DBMS Adapter
-
Suffix of the listening adapter.
- Source Table Name
-
Data source that is listened on.
- Status
-
Current status of the adapter.
- Processed Transactions
-
Number of processed LUWs (files).
- Polling Interval
-
Interval at which polling takes place.
- Timeout Interval
-
Amount of time during which there is no activity, and after
which a timeout occurs.
- Transactions Processing Limit
-
Maximum number of LUWs (files) that are processed by the
adapter in one request.
File Listener Information
- Source File Type
-
Suffix of the listening adapter.
- Source Directory (File)
-
Data source that is listened on.
- File Extension
-
Extension of processed files.
- Status
-
Current status of the adapter.
- Processed Files
-
Number of processed LUWs (files).
- Processed Bytes
-
Number of bytes processed by the file listener adapter.
- Files in wait queue
-
Number of selected files waiting to be processed by the file
listener adapter.
- Processing time
-
Rounded number of seconds that the file listener adapter
spent in processing files.
- Wait for work time
-
Rounded number of seconds that the file listener adapter
spent in waiting for files.
- Average files per second
-
Average number of files per second that the file listener
adapter processed.
- Average bytes per second
-
Average number of bytes per second that the file listener
adapter processed.
- Average file wait time
-
Average time in seconds that the file listener adapter spent
in waiting for files.
- Polling Interval
-
Interval at which polling takes place.
- Timeout Interval
-
Amount of time during which there is no activity, and after
which a timeout occurs.
- Files Processing Limit
-
Maximum number of LUWs (files) that are processed by the
adapter in one request.
System
- CPU Time
-
Total CPU time used by the process.
- Memory Usage (KB)
-
Amount of memory, in kilobytes, used by the process.
- Disk Usage (KB)
-
Disk space, in kilobytes, used by the process.
- Process ID
-
Operating system specific process identification number that
is associated with the agent.
x
Procedure: How to Display Statistics for an Individual Data Service Agent
-
Customize
and display the Data Services Agents page, as described in How to Display and Customize the Data Services Agents Page.
-
On the page,
right-click the row for the individual Data Service Agent whose
statistics you want to display. For example, right-click the row
for the agent identified as Tscomid 11.
-
From the
menu, click Statistics.
The Agent Statistics pane opens. On this pane, you will
see the statistics described in Data Service Agents Performance Parameters, followed by system-extended statistics
for the selected agent process.
x
Reference: System-Extended Statistics for an Individual Data Service Agent
The following
table describes the system-extended statistics for an individual
Data Service Agent.
|
Statistic
|
Description
|
|---|
|
PageFaultCount PeakWorkingSetSize (KB) WorkingSetSize (KB) QuotaPeakPagedPoolUsage QuotaPagedPoolUsage QuotaPeakNonPagedPoolUsage QuotaNonPagedPoolUsage PagefileUsage PeakPagefileUsage
|
Standard Windows memory management statistics
for the monitored process.
|
|
Total Execution Time
|
Cumulative execution time of transactions performed
by the agent.
|
x
Displaying Status Statistics and Aggregated Statistics for Data Services
You can display and customize a status report for all
Data Services, and display aggregated statistics for all Data Services
or for a selected service.
x
Procedure: How to Display and Customize a Data Services Status Page
-
From the
menu bar, select Workspace.
-
In the navigation
pane, right-click the Data Services folder,
and select Services.
The Data Services Status page is displayed on the right,
as shown in the following image.
The
table in Aggregated Statistics for Data Services describes all the statistics
that you can display on the report.
-
To choose
specific statistics that you want to display on the report, click Choose
Columns, and proceed according to the instructions in How to Display and Customize the Data Services Agents Page.
-
At the upper-right
of the report pane, optionally click Refresh Now to
refresh the statistics, or click the Refresh interval check
box and type the number of seconds between automatic refreshes.
x
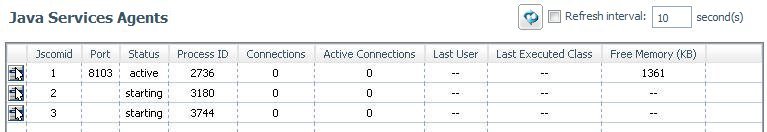
Procedure: How to Display Aggregated Statistics for All Data Services
-
From the
menu bar, select Workspace.
-
From the
ribbon, click the Data Service Statistics icon,
or right-click the Workspace folder in the
navigation pane, and select Data Service Statistics.
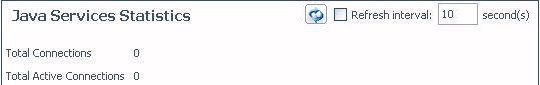
The Data Service Statistics pane opens on the right. The
following image shows a sample Data Service Statistics pane.
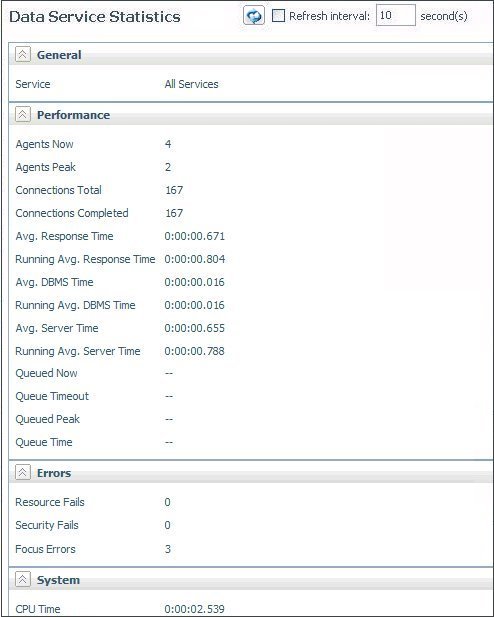
The
table in Aggregated Statistics for Data Services describes the statistics that
are provided.
x
Procedure: How to Display Aggregated Statistics for a Selected Data Service
-
From the
menu bar, select Workspace.
-
In the navigation
pane, open the Data Services folder.
-
Right-click
the name of the service on which you want to report, for example, WC_DEFAULT,
and select Statistics.
The aggregated statistics for the selected service are
displayed on the right. The table in Aggregated Statistics for Data Services describes the statistics that are provided.
x
Reference: Aggregated Statistics for Data Services
The
following aggregated statistics are provided for Data Services:
General
- Service
-
If you are displaying aggregated statistics for all Data
Services, this value is All Services.
If you are displaying
aggregated statistics for a selected service, this value is the name
of the service configured for Workspace Manager in the edaserve.cfg
file.
Performance
- Agents Now
-
Number of agents that are currently running.
- Agents Peak
-
Maximum number of agents that were running at any given time.
- Connections Total
-
Number of attempted connections to servers since they were
started, or from the time that statistics were reset.
This
value is different from the total number of sessions, since a persistent session
can connect multiple times for different requests.
- Connections Completed
-
Number of successfully completed connections to servers since
they were started, or from the time that statistics were reset.
- Avg. Response Time
-
Average number of seconds for server response. This value
does not include data transfer time. See Calculating and Displaying Averages, for more information.
- Running Avg. Response Time
-
Response time, averaged over the time interval defined by
the edaserve.cfg parameter stats_runningavg. The default value is
600 seconds.
- Avg. DBMS Time
-
Average DBMS processing time in seconds.
- Running Avg. DBMS Time
-
Average DBMS processing access time in seconds.
- Avg. Server Time
-
Average response time minus DBMS processing time in seconds.
- Running Avg. Server Time
-
Average response time minus DBMS processing access time in seconds.
- Queued Now
-
Number of currently queued connections. Not applicable when
queuing is off.
Currently running jobs are included in the
connection total, but not in connections completed or in resource
failures.
- Queue Timeout
-
Number of connections that went into the queue and timed
out (not available when queuing is off).
- Queued Peak
-
Maximum number of connections that are queued at any given
time (not available when queuing is off).
- Queue Time
-
Average number of seconds spent in queue by all connections
(not available when queuing is off).
Errors
- Resource Fails
-
Number of connections rejected for lack of available agents.
This value includes timed-out queued connections.
- Security Fails
-
Number of connections that failed due to invalid credentials.
For details about errors and failures, see the edaprint.log file,
which is saved where the server is installed.
- Focus Errors
-
Number of completed connections with WebFOCUS errors during
request execution. For example, the adapter was not properly configured,
or the data description or procedure was not found.
System
- CPU Time
-
Total CPU time used by the server.
- Memory Usage (KB)
-
Amount of memory, in kilobytes, used by the server.
- Disk Usage (KB)
-
Total disk space, in kilobytes, used by the server.
x
Reference: Calculating and Displaying Averages
Variables that are averages (avg) are
fractional numbers of seconds rounded to the nearest millisecond
for display purposes, but actually computed in higher precision,
depending on the operating system:
- Avg Rsp Time is a
measure of waiting time - idle time + running (that is, agent processing)
time for all connections, divided by number of connections. It is
actually the average time from the moment that the user clicks to
send a request to connect or resume, until the moment that the answer
appears in the browser, when the user suspends or disconnects the
session.
- Agent processing
time is the part of the connection duration spent only on running the
request.
- Running time proportion
of a connection is the percentage of its running time compared to
its duration.
The accuracy of
the three corresponding averages is limited only by the precision
of the operating system. In the rare case in which a machine is
faster than the precision of its time-measuring, accuracy side effects
may occur:
- For an individual
connection that has a duration shorter than the precision of the
operating system, duration and running time cannot be measured and
are both 0. The server considers it a 100% running time. A high
occurrence of these instances produces an overestimated average
proportion.
- If the duration is
longer than the precision because of waiting time, but the running time
is still less than the precision, then a zero is counted toward
the average running time and in calculating the proportion. A 0%
running time proportion is recorded. A high occurrence of these
instances produces an underestimated proportion.
x
Working With the Connection Queue
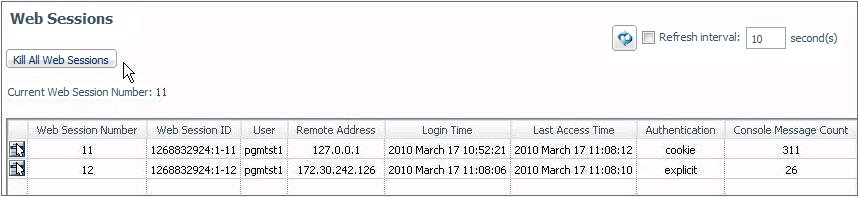
The Connection Queue displays the statistics for the
current list of connections, enabling administrators to monitor,
and if necessary, cancel individual connections.
A connection refers to a physical connection
between Client and Server. There are two types of connections:
- An active connection
is one that is assigned to a session in a data access agent.
- A queued connection
is one for which there are no available agents for the requested
service, and the service is configured with a queue.
A queued connection waiting for an agent becomes active as soon
as an agent is available. If the maximum time to wait in the queue
is reached, the connection is automatically cancelled by the Workspace
Manager.
x
Procedure: How to Display Statistics for All Connections
-
From the
menu bar, select Workspace.
-
In the navigation
pane, right-click the Data Services folder,
and select Connection Queue, as shown in
the following image.
The
Connection Queue report is displayed on the right.
The table
in Connection Statistics describes
the statistics on the report.
Each connection is represented as a separate row
on the report.
x
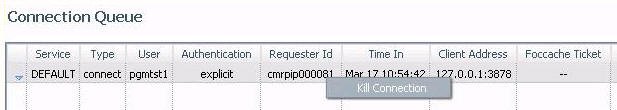
Reference: Connection Statistics
The following statistics appear on the
Connection Queue report.
- Service
-
Name of the data service for the connection.
- Type
-
Connection type, either connect or resume.
- User
-
User ID that connected to the session.
- Authentication
-
Type of authentication used to connect, either trusted, explicit,
or IWA.
- Requester ID
-
Unique identifier for the network connection created by a listener.
- Time In
-
Time at which the connection was activated or queued. This
value determines when a queued connection times out.
- Client Address
-
Network address of the connecting client.
- Foccache Ticket
-
Unique identifier assigned to the last request that used
the foccache directory.
x
Procedure: How to Kill a Connection
To
cancel a connection, click the row for the connection on the Connection
Queue report, and from the menu, click Kill Connection, as
shown in the following image.
- For an active connection,
its session is forcefully disconnected from its agent.
- For a queued connection,
it is simply cancelled and the client gets the same error that it
would get if queuing was off and there were no available agents,
or if the queue was full.
x
Performing Administrative Tasks for Data Services
You can perform certain administrative
tasks as you monitor Data Service activity.
- Reset aggregated
statistics for Data Services.
- Save the last FOCUS command.
- Kill one or more
Data Service Agents.
- Kill agents by connected
userid
- Start one or more
new Data Service Agents.
- Display an error
message for a Data Service Agent.
x
Procedure: How to Reset Aggregated Statistics for Data Services
You can clear aggregated Workspace Manager
statistics for Data Services and start collecting them from the
beginning.
-
From the
menu bar, select Workspace.
-
In the navigation
pane, right-click the Data Services folder.
-
From the
menu, click Reset Statistics.
x
Procedure: How to Save the Last FOCUS Command
You
can save the last FOCUS command executed by an agent as a new procedure
and run it separately from the Web Console. This provides a great
tool for debugging server issues.
-
From the menu bar, select Workspace.
-
Right-click an agent on the Data Services Agent page
and select Save Last FOCUS Command.
The Create New Procedure as Text page opens, as shown in
the following image.
-
Click the Save button.
The Save Procedure page opens, as shown in the following
image.
-
Enter an application folder in the Application field,
or click the ellipsis (...) and navigate to one.
-
Enter a name in the Name field.
-
Click Save.
x
Procedure: How to Kill One or More Data Service Agents
There
are a number of ways to kill Data Service Agents:
- To stop one or
a number of agents, select the check box next to each agent, and
click Kill Selected Agents, as shown in the
following image.
The running agent
is terminated, invalidating any current connection to that agent. If
a request is then issued from such a connection, an error message
is returned. Stopping an agent is therefore an emergency administrative
measure, as it disrupts the application. After an agent is terminated,
the Data Services Agents pane refreshes automatically. The corresponding
row of the terminated agent remains, and the State is listed as stopping until
the row eventually disappears. You can also click Refresh
Now to update the pane and remove the row.
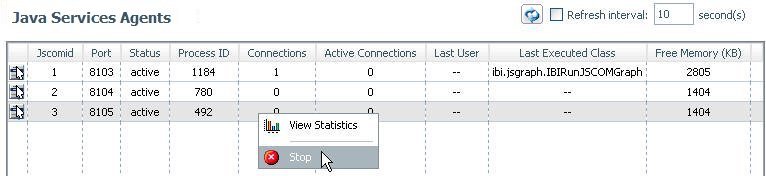
- To stop an individual
agent, you can also right-click the row for the agent, and click Kill
This Agent from the menu. When asked if you want to continue
to kill the agent, click OK.
- To stop an individual
agent without permitting the DBMS to perform any cleanup tasks,
choose Hard Kill This Agent from the menu.
A message informs you that a hard kill may leave resources inaccessible
and should be used only as a last resort. Click OK to
continue the hard kill.
Important: Use this option only
when Kill This Agent fails.
- To stop all agents
belonging to the same user ID, look for a row for the agent that is
currently connected to the desired user ID. Right-click that row,
and select Kill Agents With The Same User ID.
- To stop all agents
associated with a selected service, right-click the service beneath
the Data Services folder, and select Kill All Agents from
the menu, as shown in the following image. When asked to confirm
your request, click OK.
- For extreme situations
in which you want to terminate all running agents, right-click the Data
Services folder in the navigation pane. From the menu,
select Kill All Agents. When asked to confirm
your request, click OK.
x
Procedure: How to Kill Agents by Connected User ID
In
the Web Console, look for a row for the agent in the Data Services
Agents pane that is currently connected to the desired user ID,
then right-click that row and select Kill Agents With
The Same User ID, as shown in the following image.
To
kill agents from the command line, the syntax is:
edastart -killuser <userid>
In
addition, for the z/OS platform, a z/OS operator MODIFY command
can also be used, as follows:
/F <server_jobname/started task>,-killuser <userid>
x
Procedure: How to Start One or More New Data Service Agents
Use this method to start additional
agents, even when there are agents already running.
-
From the
menu bar, select Workspace.
-
In the navigation
pane, expand the Data Services folder.
-
Right-click
the name of the service for which you want to start agents.
-
From the
menu, select Start New Agents.
-
On the Start
New Data Service Agents pane, type the number of new agents to start
for the selected service, as shown in the following image. Then
click Start.
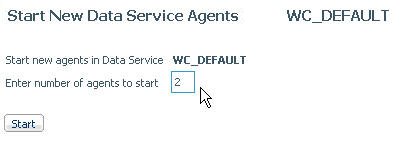
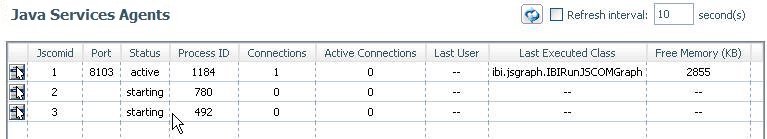
On the Data Services Agents
pane, you will see that the new agents are listed, with the State
of starting.
x
Procedure: How to Display an Error Message for a Data Service Agent
If
a procedure generates an error, you can display the error message
on the active agent.
-
From the
menu bar, select Workspace.
The Data Service Agents pane opens.
-
In the Tscomid
column, right-click the number associated
with an agent, and select View Error from
the menu, as shown in the following image.
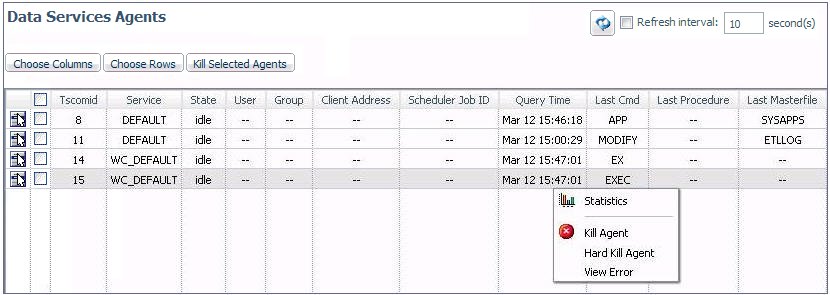
The
latest error is displayed in a separate window.
Example: Displaying an Error Message for a Data Service Agent
The
following error was generated on an agent when a procedure was run
against a file that could not be found. Clicking the number of the
agent that ran the procedure produced the following message:
(FOC205) THE DESCRIPTION CANNOT BE FOUND FOR FILE NAMED: XYZ
BYPASSING TO END OF COMMAND
Tip: The
error message is also stored in the Session Log, which you can access
by clicking the Show Session Log Window  icon
on the Web Console menu bar. In the Session Log, you can click the message
to see expanded information, including troubleshooting suggestions.
For example:
icon
on the Web Console menu bar. In the Session Log, you can click the message
to see expanded information, including troubleshooting suggestions.
For example:
(FOC205) THE DESCRIPTION CANNOT BE FOUND FOR FILE NAMED:
No data description can be found for the file requested. Check the
Master File Descriptions allocated or available, or the spelling of
the file name.
For more information
on the Session Log, see Showing the Session Log.

 button.