Viewing the Distribution Server Status
The Server Status tool, accessed by selecting the Server Status
tab in the Console, enables you to view the status of the Distribution
Server. When you configure ReportCaster
with a failover Distribution Server or Workload Distribution, the
status of all servers is provided and you can perform basic tasks,
such as switching the primary and failover server roles. The
Server Status tool also provides
details about the Distribution Server, such as the host name and
port number, the status, and the number of jobs that are running
and in the queue. The Distribution Server information includes:
From the Server Status interface, you
can perform the following tasks:
-
Refresh. Retrieves
the most current information and refreshes the Distribution Server
status with this information.
-
Switch. This
option is only available when a failover Distribution Server is
configured. Changes the current roles of the servers, so that the
primary server becomes the failover server and the failover server
becomes the primary server.
-
Server. Displays
a drop-down menu listing the servers, whose status you can view.
-
Restart. Recycles
the Distribution Server and the Application Server.
-
Suspend. This
option is always available, regardless of whether a failover Distribution
Server is configured or not. Suspends the Distribution Server services,
but the server remains running. When you suspend a server, the Suspend
button label will change to Resume.
-
Stop. Brings
the Distribution Server completely down.
Note: When
you stop the Distribution Server using this option, you must restart
it from the machine where it resides. You cannot restart the Distribution
Server remotely.
-
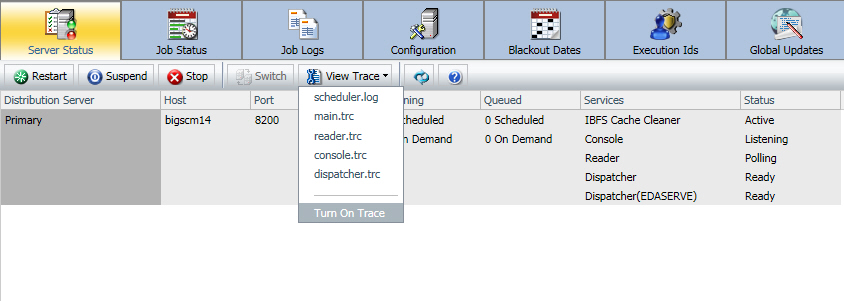
View Trace. Allows
you to view trace information for the scheduler.log, main.trc, reader.trc,
console.trc, and dispatcher.trc files. You can also turn the Distribution
Server traces on or off. For more information, see How to Turn Distribution Server Traces On or Off.
Note: Distribution
Server traces are tracked separately from Job traces using this
functionality. You do not need to turn on job traces to see distribution
server traces.
-
Help. Opens
the Console Server Status online documentation.
x
Procedure: How to Turn Distribution Server Traces On or Off
-
From the
ReportCaster Console, select Server Status.
-
From the
Distribution Server list, select a server.
-
On the toolbar,
click View Trace.
-
Click Turn
On Trace to turn the Distribution Server traces on.
To disable the Distribution Server traces, follow
steps 1 and 2, and then click Turn Off Trace.
xSeparate Job Queues for Each Data Server
The Distribution Server has separate job queues for
each Reporting Server, as well as an additional queue for tasks
that do not require a Reporting Server. Therefore, there will always
be at least one job thread available for each Reporting Server,
in addition to at least one thread for non-server based jobs. No
one Reporting Server can have all of the available job threads consumed
by jobs associated with that server.
Note: This feature is available as of Release 8.0
Version 02 and higher.
Each Reporting Server is allocated
job threads equal to the total number of connections available for
that Reporting Server. The Maximum Threads setting is now the total
number of threads for each Reporting Server, in addition to the
number of threads allocated for remaining tasks, as shown in the
following image.