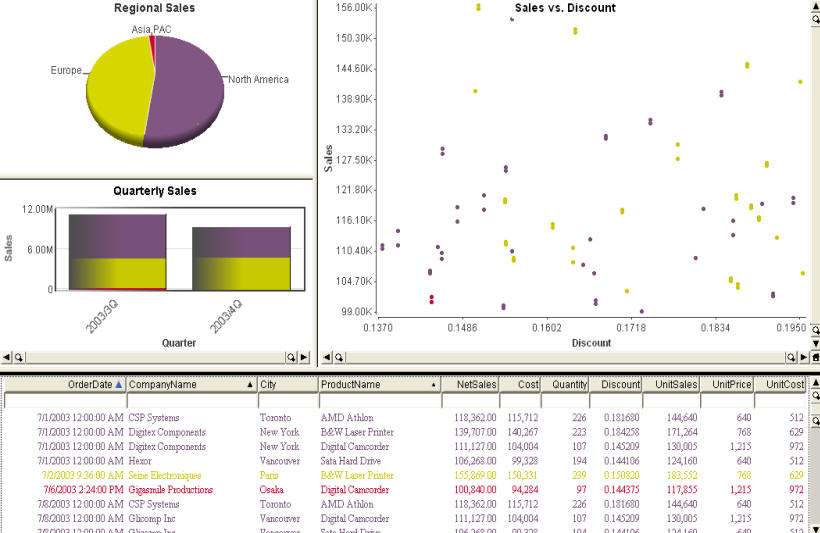
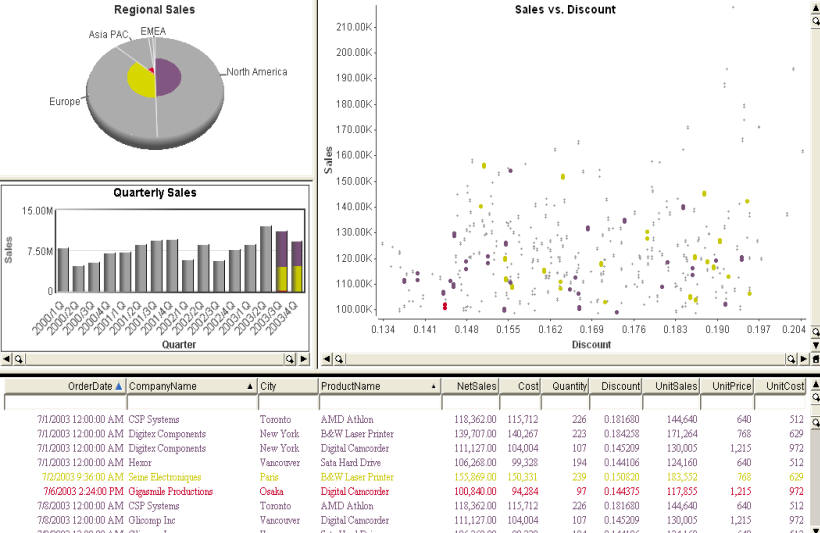
This Page consists of 4 charts showing sales order data:
- A Pie Chart with Regional Sales. This is also used to color the dashboard.
- A Bar Chart of Quarterly Sales.
- A Scatter Plot show Sales versus Discount; each dot is a single order.
- A Data Sheet showing details of orders, including date, company, city, product, net sales, cost, quantity, discount, unit sales, unit price, and unit cost.
Correlate
With the mouse, sweep an area in the Scatter Plot (draw a rectangle with the Left Mouse Button depressed); this represents the high sales orders. The corresponding subpopulations in the other charts are highlighted, showing which regions these sales occurred in and how they were distributed across time. The selected portion of the Regional Sales Pie Chart is not evenly distributed; this shows that the selected population differs in geographical distribution from the overall population. North America and Europe are strongly represented, but other regions have lower amounts than would be expected. Also note the Quarterly Sales Bar Chart; the last 4 quarters had rising sales, but for the highlighted populations, sales have been declining for the last 3 quarters.
Iterate
Exclude unselected items (via the Right Mouse Menu context menu item "Exclude Unselected" or the "Selection" toolbar) top focus on just this subset.
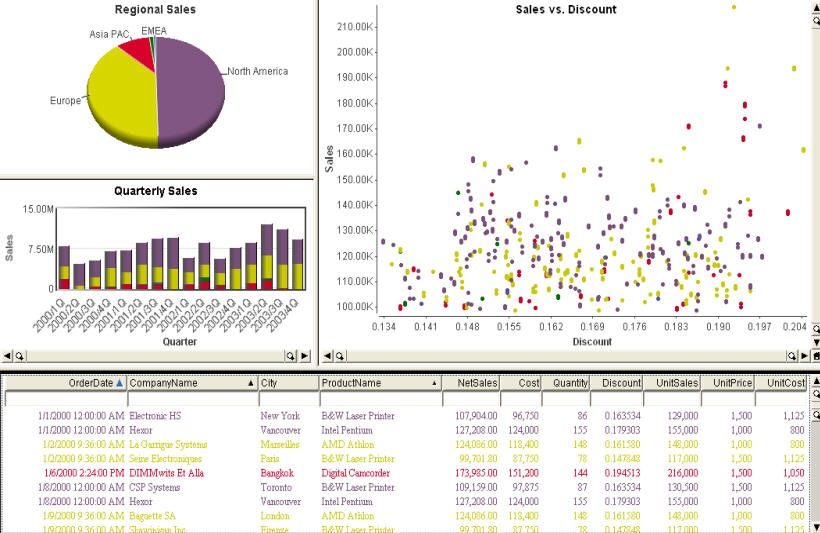
Select just the most recent two quarter in the Quarterly Sales Bar Chart. For these two quarters, the Regional Sales Pie Chart is dominated by North America and Europe again. There is no obvious pattern in the Sales versus Discount Scatter Plot. So, the decline in sales in the two recent quarters reflects a lack of sales in certain regions, but this lack of sales isn't due to differences in sales or discounting.
Identify
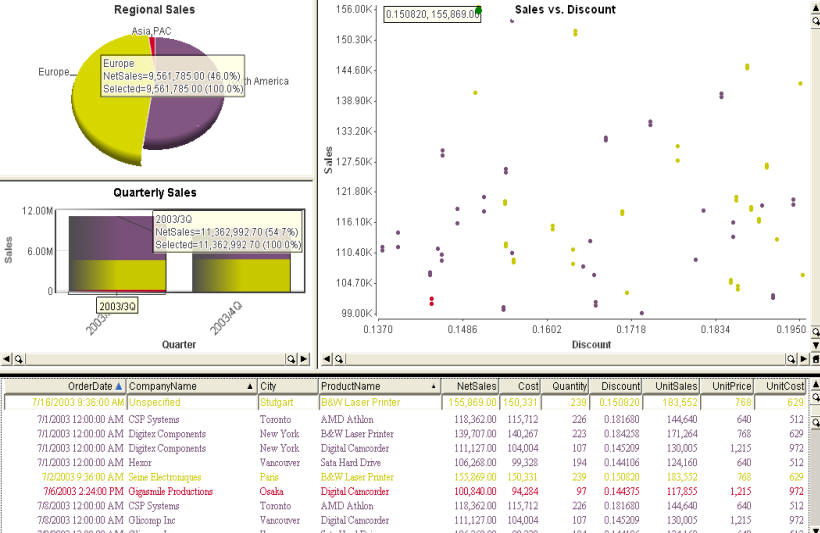
Focus on the highlighted population by excluding the unselected items again. Note the very small amount of sales represented by regions other than Europe and North America.
Point at a single order in the Sales versus Discount Scatter Plot to investigate that particular order. The items corresponding to that focus item is highlighted in each chart, showing the exact sales and discount for that item, its region (Europe), and it Quarter (2003/3Q). The top line of the bottom Data Sheet is this item, and shows all of the other detail information available.
Share Results and Export
Images can be saved to the clipboard or published as part of a document, including a PDF, Microsoft Word document, or Microsoft PowerPoint presentation. Selected data items can be exported as a result set to a text file, spreadsheet, or Business Objects Report for further action.