Working With Active Technologies Form Controls
In this section: How to: Reference: |
The use of active dashboards adds to the existing capabilities
of active reports and integrates them using Document Composer Coordinated
Compound Report functionality.
The following are characteristics of
active dashboards:
- All active
reports in an active dashboard must have the same first (primary) sort
field, which can originate from multiple Master Files, but must
be the same name and format.
- The common
primary sort (BY) field is used to merge all of the active reports
for cross-scenario and cross-report filtering. When an active dashboard
is executed, WebFOCUS uses the common primary sort field to automatically
build the drop-down list that is used to select sort field values
at the top of the page.
- Multiple active
reports are embedded into a compound document to create an active
dashboard.
- In the compound
document Properties window of Document Composer, set the Coordinate
report property of the object to On and the
Output format to active report, active Flash, or active PDF.
- Each page
layout of a compound document represents a different business scenario
and appears as a separate tab at the top of the active dashboard.
- All active
dashboard characteristics are available when using the active Flash output
format.
You also have the ability to set an active report initial presentation
style, which enables active reports to render as reports, pivot
tables, or charts. With these types of visualizations packaged into
the active report output, active reports can be integrated with
Coordinated Compound Reports to present reports, pivot tables, and
charts all within the same page.
Tip: When you create active dashboards using Document
Composer, active reports (regardless of the initial presentation
style setting) are to be imported, referenced, or created using
the Report object, not the Graph object.
Adding active form controls to an active dashboard locks you
into the active dashboard mode. For more information, see Active Technologies Dashboard Mode.
x
Procedure: How to Create an Active Technologies Report With Active Technologies Dashboard Characteristics
Ensure that
your active reports comply with the characteristics of active dashboards.
You can modify an existing active report or create new ones that
meet the criteria.
-
Open or create a new report in Report Painter.
-
Select an active report format from the Output Format drop-down list.
-
Select By from the Columns toolbar and
add the primary sort field to the active report.
The first field must be a visible By field for active dashboards.
All values found as the primary sort field will be listed in the
active dashboard.
-
Ensure that the first field has the same name as the column name.
The first field must be the same name and format for active dashboards.
-
Select Format from the Report menu.
The Format tab of the Report Options dialog box opens.
-
Click the Initial Presentation drop-down list to select a presentation style
for the active report.
When the active report is integrated in the active dashboard,
it can present reports, pivot tables, and charts all within the
same page.
Tip: When you create active dashboards using
Document Composer, active reports (regardless of the initial presentation
style setting) are to be imported, referenced, or created using
the Report object, not the Graph object.
-
Save and close the active report.
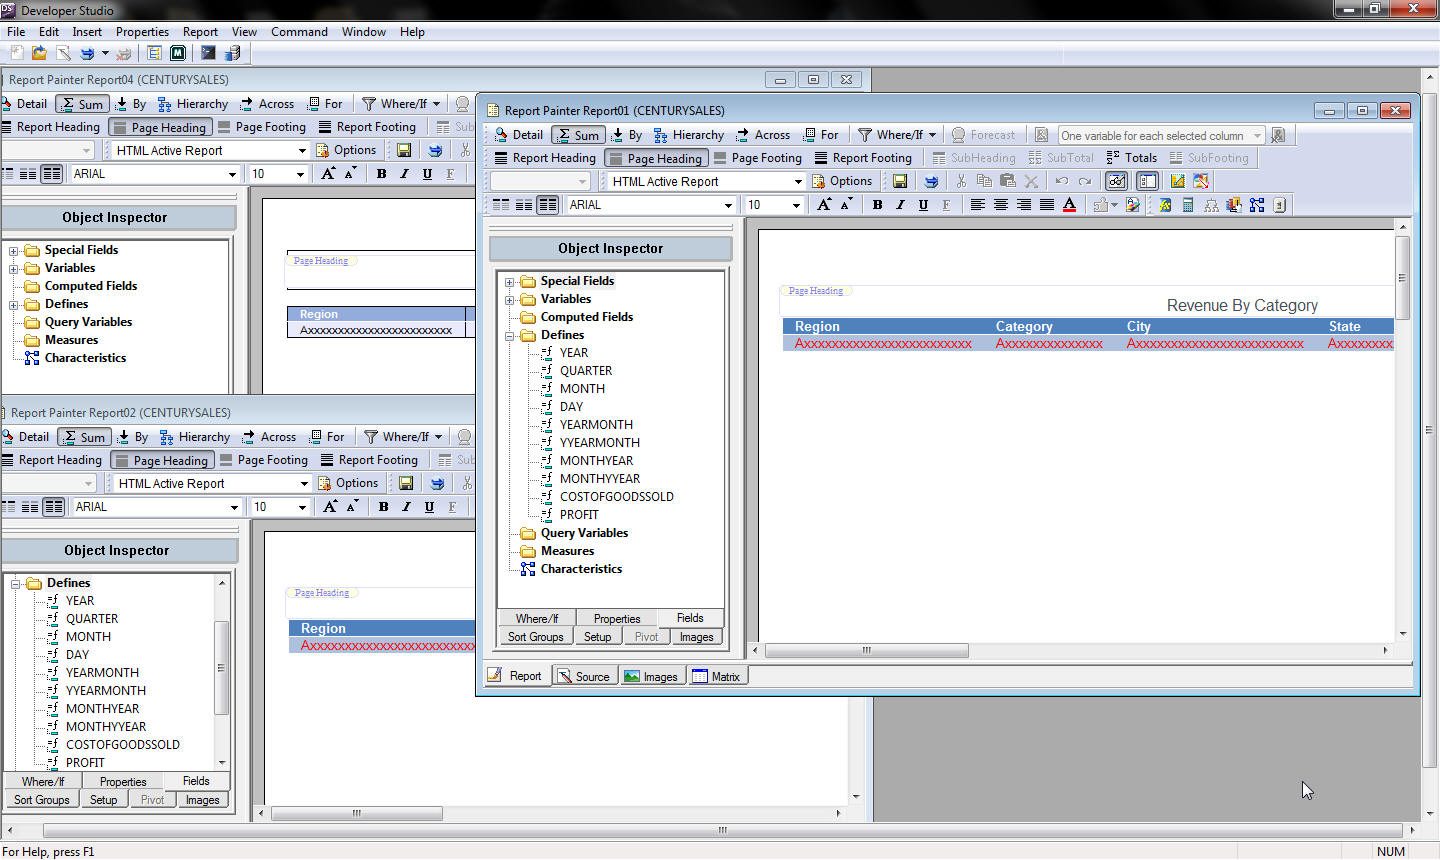
In the following example, there are three HTML Reports
that show REGION as the first visible By
field in the report. These active reports comply with the active
dashboard characteristics.
x
Procedure: How to Create an Active Technologies Dashboard in Document Composer
-
Create a new procedure with Document Composer:
-
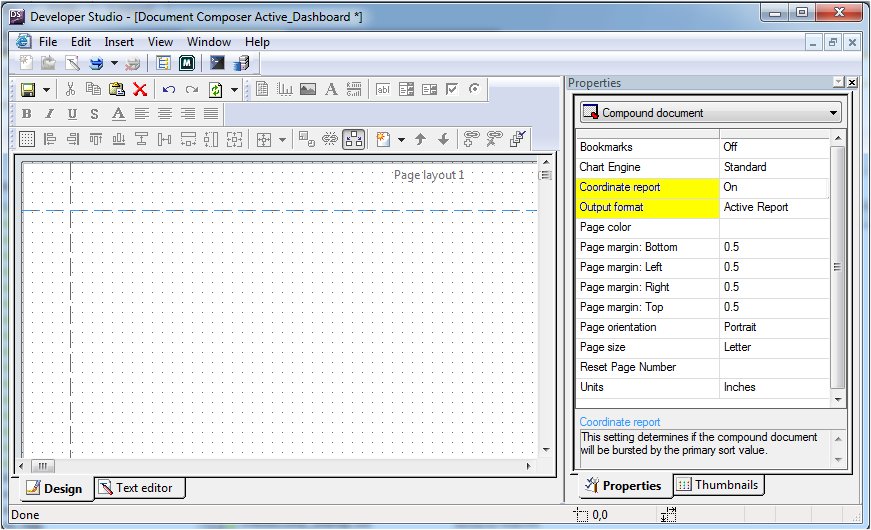
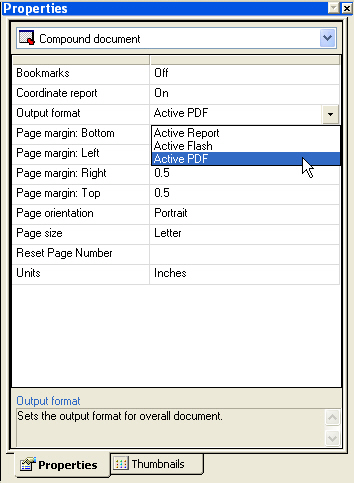
Select the following properties from the Properties window:
The following image shows the Properties window with
these options selected.
-
Add multiple active reports to create the active dashboard:
-
Select New Report from the Insert menu.
The cursor changes into a crosshair.
-
Click and drag the crosshair to create a report object and
adjust it to the size you want.
-
Import or reference an existing active report.
- Right-click
on the report object and select Import existing report from
the context menu.
or
- Right-click
on the report object and select Reference existing procedure from
the context menu.
The Get source file dialog box opens.
-
Select the active report and click Open to
add it to Document Composer.
Repeat these steps to embed multiple active reports
into the coordinated compound document that will create the active
dashboard.
-
Position the reports in the document. For more information
about positioning reports, see Positioning Report Objects in the Active Technologies Dashboard.
-
Optionally,
you can bind objects to an active report. For more information about
binding reports, see Binding Objects to an Active Technologies Report.
-
Add an active
form control to the document. For more information about active
form controls, see How to Add an Active Technologies Form Control to the Layout.
Note: Adding an active form control to a document
with synchronized active reports results in Document Composer being
switched into a limited active dashboard mode. For more information
on the active dashboard mode, see Active Technologies Dashboard Mode.
xBinding Objects to an Active Technologies Report
You can create multiple views of an active report by
binding an active report object to another active report. Binding
or synchronizing is the act of configuring an association between
an active report and other active report objects in Document Composer.
You can synchronize active report objects and show the synchronized
report groups in Document Composer. The synchronize options are
available from the Positioning toolbar in Document Composer.
You can only synchronize objects to one active report at a time.
If you try to synchronize an object to a second active report, the
first synchronization is removed.
x
Procedure: How to Synchronize Active Technologies Report Objects to Active Technologies Reports
When
there are objects synchronized to an active report, those objects
are updated any time the active report updates.
-
With at
least two active report objects on the canvas, select active report,
active Flash, or active PDF from the Output format drop-down list
of the Compound document Properties window.
-
Select the objects to be synchronized.
- Select
the active report object as the object to be synchronized.
- While
pressing and holding the Ctrl key, select the active report as the
report that you want to bind to.
The synchronize
buttons on the Positioning toolbar are activated.
The binding
object (active report) is indicated by clear boxes around the edges.
The synchronized object (active report object) is indicated by solid
black boxes around the edges.
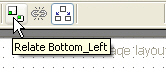
-
Click the Relate
Bottom_Left button on the Positioning toolbar.
The
active report object is synchronized and refreshed with data from
the active report.
There is no separate procedure associated
with these active report objects. If you right-click these items,
there are no options to edit the procedure.
x
Procedure: How to Show Active Technologies Report Relationships
Select Show
relationships from the Positioning toolbar.
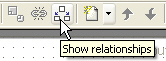
An
arrow displaying the relationship is shown in the layout.
xConfiguring Active Technologies Form Controls in Document Composer
To add an active form control, it is required that you
insert a new control to the layout. Inserting a control type while
the output is set to active reports creates an association between
the control and an active report, thereby linking actions to directly affect
bound active reports.
An active form control is only applicable if there are active
reports embedded or referenced in Document Composer.
x
Procedure: How to Add an Active Technologies Form Control to the Layout
Any
input control from the Components toolbar can be configured as an
active form control.
To add an input control:
-
Select the
control type (Text Box, Drop Down
List, List Box, Radio
Button, or Check Box) from the Insert
menu or toolbar.
Note: There must be at least one active report on
the canvas for the input controls to be available.
-
Click and
drag the crosshair to create a control object and adjust it to the
size you want.
The input
control is added as an active form control. You can now configure the
control by right-clicking the control and selecting Properties
and settings.
x
Procedure: How to Insert a Dashboard Bar Into the Layout
A
Dashboard Bar is an additional page layout where you can insert
controls, reports, and charts that display above the dashboard tabs.
The Dashboard Bar is only available for the active report formatted
documents. A Dashboard Bar can be a maximum of one page.
You
can insert a Dashboard Bar into active Flash and active PDF formatted
documents. However, if you run these documents, an empty page will
be returned.
To insert a Dashboard Bar:
-
From the
Compound document Property list, select either active
report, active PDF, or active
Flash.
-
From the
Insert menu, click Add Dashboard Bar.
The Dashboard Bar is inserted into the document.
You
can now insert controls, reports, and charts that display above
the dashboard tabs.
Note: Though the Dashboard Bar
can be a full page, it is not recommended that you insert large
reports and charts, as this would make the Dashboard Bar appear
the same size or larger than the dashboard.
x
Reference: Properties and Settings Dialog Box (Active Technologies Reports)
The Properties
and settings dialog box appears when you right-click an input control.
The Properties and settings dialog box
is shown in the image below.
The
Properties and settings dialog box contains the following settings:
-
Source report
-
The selected report will be the report that the target reports
are filtered on. The values in Columns will be populated by the
columns of the source report. Only one source report can be selected.
-
Columns
-
Lists all columns from the source report. The target reports
will be filtered on the selected column value. Only one column can
be selected.
-
Condition
-
This option sets the condition for how to populate the target
reports.
- Equal (default)
- Not Equal
- Greater Than
- Greater Than or Equal
- Less Than
- Less Than or Equal
-
Add "ALL" option
-
Adds the option to select ALL data source values for the control.
-
Apply filter on load
-
When selected, this option causes the default value to be
applied to the reports and charts when the page is loaded. This
option is not active while Add “ALL” option is selected.
-
Multiselect
-
When selected, you can select multiple values from a list
box or check box.
-
Target reports
-
The selected report or reports that the source report will
filter. You can select multiple reports by holding down the Ctrl key.
x
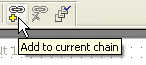
Procedure: How to Chain Active Technologies Form Controls
You
may chain controls to one another by using the Add to
current chain button on the Positioning toolbar. Chaining populates
controls based on the selected value from the prior control in the
chain.
-
With at
least two controls on the canvas, select the controls you want to
chain.
-
Click the Add
to current chain button on the Positioning toolbar.
The
selected controls are now chained. The controls will populate based
on the selections from each prior control in the chain. To see the
chaining relationship between controls, use the Show
Chain order button on the Positioning toolbar.
x
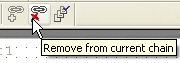
Procedure: How to Remove Active Technologies Form Controls From a Chain
You
can remove controls from a chain by using the Remove
from current chain button on the Positioning toolbar.
To see the chaining relationship between controls, use the Show
Chain order button on the Positioning toolbar.
-
With a set
of chained controls on the canvas, select the first control you
want to remove from the chain. While pressing and holding the Ctrl
key, select any additional controls you want to remove from the
chain. The chaining buttons on the Positioning toolbar are activated.
-
Click the Remove
from current chain button on the Positioning toolbar.
The
selected controls are now unchained.
xSwitching the Chart Engine
You can switch between the default JavaScript charts and Fusion™
charts. To do this, select compound document from the Properties
tab and then select active report from the
Output format property list. The Chart Engine property is now available.
Select one of the options from the Chart Engine property drop-down
list, as shown in the following image.
The Chart Engine options are described below:
-
Standard. This
option changes the engine to use JavaScript charts.
-
Flash. This
option changes the engine to use Fusion charts.
-
Flex. This
option changes the engine to use Flex charts.
-
HTML5. This
is the default chart option. This option changes the engine to use
High charts.
x
Reference: Active Technologies Dashboard Mode
Selecting
an active report output type (active report, active Flash, active
PDF) from the Output format drop-down list of the Compound document Properties
window and inserting an active report activates the input controls
in the Insert menu and on the toolbar. Adding an active form control
switches Document Composer into a limited active dashboard mode.
In
the active dashboard mode, the Output format drop-down list will
be populated by only active report, active Flash, and active PDF,
as shown in the following image:
To
access the other output types, you must remove any active form controls
from the canvas. If there are any active form controls on the canvas,
the only available output types will be for active reports.