Labels and Titles

In this section:

The titles and labels that are included in the graph consist of the graph-wide titles (footnote, title, and subtitle) and ordinal and numeric axis labels and titles. All labels and titles can be defined, displayed, and auto-fitted using the properties and methods described in this section.


Top of page

x
Graph-Wide Titles

You can use these properties to define, display, and auto-fit the graph title, subtitle, and footnote:


Top of page

x
Ordinal Axis Labels and Titles

You can use these properties to control the appearance of labels and titles on an ordinal axis:

You can use the ExcludeMinLabel and ExcludeMaxLabel properties to include/exclude the minimum and maximum labels on the ordinal axis.

The LabelDisplay and LabelAutofit properties determine whether labels are displayed and auto-fitted on the ordinal axis. See Label and Title Methods for methods that you can use to define ordinal axis labels.

You can use the LabelRotate, LabelStagger, and LabelWrap properties to control how labels are imaged on the ordinal axis.

You can use the LabelAutoSkip, LabelSkipBegin, and LabelSkipCount properties to omit some of the labels on the O1-axis. When LabelAutoSkip selects manual skip mode, LabelSkipBegin and LabelSkipCount properties define the beginning label and interval of labels to be omitted. When LabelAutoSkip selects automatic label skip mode, labels are omitted as necessary when the graph is made smaller in order to maintain a reasonable, readable label size (a minimum 8-point font size).

You can use the TitleAutofit, TitleDisplay, and TitleString properties to define, display, and auto-fit the title on an ordinal axis.


Top of page

x
Numeric Axis Labels and Titles

These properties control the appearance of labels and titles on a numeric axis:

You can use the ExcludeMinLabel and ExcludeMaxLabel properties to include/exclude the minimum and maximum labels on a numeric axis.

The LabelDisplay and LabelAutofit properties determine whether labels are displayed and auto-fitted on a numeric axis.

The LabelRotate and LabelStagger properties control how labels are imaged on a numeric axis.

The TitleAutofit, TitleDisplay, and TitleString properties define, display, and auto-fit the title on a numeric axis.


Top of page

x
Label and Title Methods

These methods control the appearance of labels and titles:

When you use these methods, you may supply an object ID as an input parameter to assign or retrieve the attribute to or from a specific label. If you do not specify a label object, the methods assign the attribute to or retrieve the attribute from the first item in the selection list. If the object ID does not identify a label object or the first item in the selection list is not a label object, a set operation applies the attribute to the object but it will not have any effect on the appearance of the graph.


Top of page

x
Formatting Date and Time Values for Y-Axis Labels

Military time uses a 24-hour time format where numbers between zero (0) and one (1), or times using a 12-hour format with AM and PM indicators, are converted to times between 0:00 and 23:00. Numbers greater than one are cycled so that they map to one of these hours as well, except for cumulative military time, in which case they add to the original value.

The following table illustrates the mapping of hours between formats, using Excel general format as the initial value:

General Format

Military Cycle

AM/PM Cycle

Military Cumulative

0

0:00

12:00AM

0:00

0.25

6:00

6:00 AM

6:00

0.5

12:00

12:00PM

12:00

0.75

18:00

6:00PM

18:00

1.00

0:00

12:00AM

24:00

1.25

6:00

6:00 AM

30:00

1.75

18:00

6:00PM

42:00

2

0:00

12:00AM

48:00

Two methods support these time formats for y-axis labels:

For example:

setTextFormatPreset(getY1Label(), 32);   
setSimpleDateFormat("E yyyy.MM.dd 'at' hh:mm:ss a zzz"); 

A sample of output for these API calls is:

Sun 2004.07.18 at 04:14:09 PM PDT


Example: Specifying Date and Time Formats for Y-Axis Labels

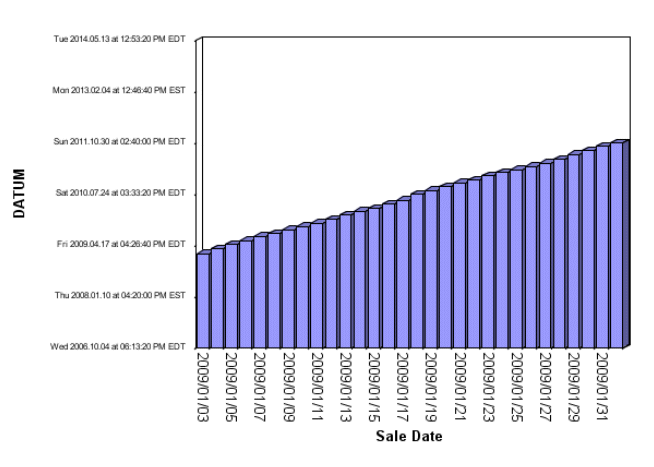
The following request generates varying time values to use as the measure on the chart and displays y-axis labels in the format "E yyyy.MM.dd 'at' hh:mm:ss a zzz":

DEFINE FILE WF_RETAIL_LITE
ZZ/I11 WITH ID_SALES  = ZZ + 1;
KUM/I11 WITH ID_SALES  =  ZZ * 5;
DATUM/YYMD WITH ID_SALES = DATEADD(TIME_DATE, 'D', ZZ);
END
 
GRAPH FILE WF_RETAIL_LITE
SUM DATUM
BY TIME_DATE
ON GRAPH PCHOLD FORMAT PNG
ON GRAPH SET LOOKGRAPH VBAR
ON GRAPH SET STYLE *
*GRAPH_SCRIPT
  setPlace(true);
  setFontSizeAbsolute(getY1Label(),true);
  setFontSizeInPoints(getY1Label(),6);
  setPlaceResize(getY1Label(),0);
  setTextFormatPreset(getY1Label(), 32);   
  setSimpleDateFormat("E yyyy.MM.dd 'at' hh:mm:ss a zzz"); 
*END 
 ENDSTYLE
 END

The output is:


Top of page

x
Using Nested/Multi-Dimensional Labels

Nested/multi-dimensional labels are supported on the O1 axis with these properties and methods:

Use the following procedures to implement the nested labels interface:

  1. Create your own version of the nested labels callback. It must implement all of the abstract methods defined in TDGNestedLabel.Java. They are:
    abstract int getNumLevels();
    abstract int getNumLabelsOnLevel(int nLevel);
    abstract Vector getAllLabels(int nLevel);
    abstract String getLabel(int nGroup, int nLevel);
    abstract int getLabelGrouping(int nGroup, int nLevel);
  2. Register the callback with the setO1LabelCallback() method. For example:
    m_chart.setO1LabelCallback (TDGNestedLabel cb);
  3. Enable the NestedLabel property. For example:
    m_chart.setNestedLabels (true);

WebFOCUS