Whether you save your graphs in SVG or PNG format, you
will plot them on a Cartesian grid using the Virtual Coordinate
System. The Virtual Coordinate System provides a way to position
and size graph elements relative to the area in which the graph is
displayed. Changing the aspect ratio (ratio of width to height)
of the area results in the necessary adjustments to the graph elements,
creating a graph that fits properly in the space allotted for it.
This feature has many benefits, including the ability to set
font size with virtual coordinates, ensuring that text appears proportionate
regardless of the size of a graph.
The Virtual Coordinate System provides data visualization in
WebFOCUS applications widely distributed on the web to users with
different display technologies and output devices.
xA Look at Coordinate Systems: Cartesian and Virtual
This topic takes a look at the basics of coordinate
systems to help you understand how you will create WebFOCUS graphs.
The Cartesian Coordinate System consists of two number lines
perpendicular to each other. Called axes, the horizontal number
line is the X-axis and the vertical number line is the Y-axis.
The axes form a plane (typically, a flat surface). With the Cartesian
Coordinate System, you assign a pair of numbers, designated as (X,Y),
to identify a point on the plane. The first number is the X-coordinate
and the second number is the Y-coordinate; together, the numbers
are the coordinates of the point.
The coordinate point at which the two axes intersect is the origin
(0,0).
The following diagram plots a point on
a plane. The Cartesian coordinates of the point are (2,3). Starting
at the origin (0,0), the first number represents 2 units to the
right of the origin on the X-axis, and the second number represents
3 units up on the Y-axis.
Tip: The two Cartesian axes divide a plane into four quarters,
called quadrants. For simplicity, the diagrams show only one quadrant.
If we double the width of the grid—that is, change its aspect
ratio (the ratio of width to height)—the number of coordinate points
on the X-axis increases to 10. The space between coordinate points
remains the same; the space between coordinate point 0 and coordinate point
1 (or between 1 and 2, 2 and 3, and so on) does not change between
grids.
As a result, when we plot (2,3) on the wider grid, the 2 units
to the right of the origin are the same width as before, and the
shaded area is unchanged. In fact, it will always be rendered exactly
the same regardless of the size and shape of the grid.
The Virtual Coordinate System used by WebFOCUS Graphics
is based on a Cartesian grid. As shown before, the first diagram
plots a point with Cartesian coordinates (2,3) on a Cartesian grid.
This time, however, when we double the width of the grid (second diagram),
the number of coordinate points on the X-axis remains 5, and, consequently,
the space between coordinate points increases.
In the Virtual Coordinate System, the number of coordinate points
on both axes is constant regardless of the size of the grid.
As a result, when we plot (2,3) on the wider "virtual" grid,
the 2 units to the right of the origin are doubled in width from
before. The Virtual Coordinate System, illustrated in the second
diagram, results in the proportionate display of the shaded area
in the increased width of the grid; it is stretched horizontally.
The width of the shaded area will always change relative to the
width of the grid.
Example: Using Virtual Coordinates to Control Font Size
The
following graphs are generated by a WebFOCUS procedure. The specific
API calls that created these graphs are described in later sections
of this manual.
This
example illustrates the results you can achieve using virtual coordinates
to control font size. The font size changes relative to the designated
size of the area in which the graph is displayed (the graph output
area).
In the graph request:
- Absolute coordinates
control the font size for the X-axis and Y-axis labels.
- Virtual coordinates
control the font size for the legend.
- The width and
height of the graph output area are controlled by two WebFOCUS graph
commands.
In the first graph, the font size for the
axis labels and the legend is proportionate to the size of the graph.
All the text on the graph is easy to read regardless of the way
font size is specified in the procedure—with absolute coordinates
or with virtual coordinates:
Next
we modify the procedure to increase the size of the graph output
area. The font size for the axis labels—specified with absolute
coordinates— remains the same, and the text is now proportionately
too small and harder to read than before. An absolute size, whether
it is the size of a font or another graph element, always renders
exactly the same whether the graph is large or small.
The
font size for the legend—specified with virtual coordinates—increases proportionately
with the size of the graph and the text is still easy to read.
In
this example, the size of the vertical bars (risers) is also controlled
with virtual coordinates. Like the size of the legend text, they
increase proportionately when the graph output area is increased.
xHow Does WebFOCUS Graphics Use the Virtual Coordinate System?
WebFOCUS Graphics uses the Virtual Coordinate System
to position and size the elements of a graph. You can control several
rectangular elements in WebFOCUS, but you typically create graphs
using the following:
-
Applet Rectangle—Defines
the graph output area, which is the entire area allowed for the
presentation of a graph. The Applet Rectangle sets the size and
shape of the virtual coordinate grid used for plotting a WebFOCUS
graph.
-
Frame Rectangle—Is
the area within which the graph coordinates are plotted.
-
Legend Rectangle—Explains
how to interpret the data plotted on a graph.
To plot a point in the Cartesian Coordinate System, you must
provide at least two coordinates (X,Y). In WebFOCUS Graphics, four
coordinates are required to plot a rectangle such as the Frame Rectangle
or Legend Rectangle—X, Y, Width, and Height. The first two coordinates
(X,Y) control the point location of the bottom left corner of the
rectangle, while the last two coordinates control the width and
height of the rectangle.
Two absolute values set the size and shape of the Applet Rectangle.
The following is a Cartesian grid showing the total number of
X-axis and Y-axis coordinate points used to plot a WebFOCUS graph.
It is represented as a square, with points plotted in the Cartesian
Coordinate System. Coordinate point (0,0) is the center of the grid.
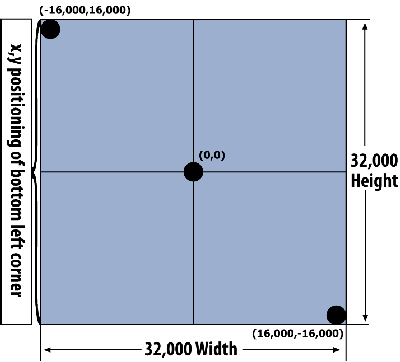
If we superimpose this grid over a WebFOCUS graph (next diagram),
its shape changes from a square to a rectangle (the Applet Rectangle),
a shape typically used in the presentation of a graph. However,
the number of points on both the X-axis and Y-axis remains 32,000.
The fact that the number of points is constant regardless of the
size or shape of the grid is the reason why the coordinate system
used by WebFOCUS Graphics is called the Virtual Coordinate System.
The values passed on a WebFOCUS Graphics API call to position
and size graph elements do not apply to pixels; rather, they are
conceptual points on a conceptual grid.
The examples that follow always show the position of coordinate
point (0,0) to mark the center of the grid used in the Virtual Coordinate
System. It will help you see the effect of the changes made to the
sample graphs. The position of coordinate point (0,0) on the grid
is constant, and graph elements such as rectangles move relative
to it through the arguments passed on a WebFOCUS API call.
Example: Plotting a Frame Rectangle in the Default Applet Rectangle
In
these examples, WebFOCUS Graphics uses the default values for the
Applet Rectangle. You plot an Applet Rectangle with the WebFOCUS
HAXIS setting (width of graph output area) and VAXIS setting (height
of graph output area) in a procedure. In general, the optimal display
format for an Applet Rectangle is 1.618 units in width for every
1 unit in height.
This
aspect ratio is essentially a golden rectangle, a form used since
ancient Greece in art and architecture. It is naturally pleasing
to the human eye.
The WebFOCUS Graphics default values are:
SET HAXIS=770
SET VAXIS=400
In the first example, the Frame Rectangle
is plotted with the following WebFOCUS Graphics API code:
setRect(getFrame(),new Rectangle(-10753,-12619,22378,19359));
In
the next example, the API code repositions the bottom left corner
of the Frame Rectangle within the Applet Rectangle and decreases
its size. The position of coordinate point (0,0) remains constant,
and the Frame Rectangle moves relative to it. The API code is:
setRect(getFrame(),new Rectangle(10000,-10000,5000,5000);
Example: Plotting a Graph With a Three-dimensional Effect
The
Frame Rectangle does not include the wall or floor of a graph rendered
with a three-dimensional effect for depth, as shown in the following
diagram. This is important to keep in mind when you position and
size the Frame Rectangle.
For
example, you cannot set the coordinates to the maximum number allowed,
in an attempt to make the Frame Rectangle fill the entire Applet
Rectangle. To do that results in the loss of data, as illustrated
in the following unintentional presentation:
Example: Plotting a Legend Rectangle
The
virtual coordinates for a Legend Rectangle work just like those
for a Frame Rectangle. In the first example, the Legend Rectangle
is plotted with the following WebFOCUS Graphics API code:
setRect(getLegendArea(),new Rectangle(7300,2488,3300,3100)):
You
can change the first two coordinates to reposition the legend toward
the center of the graph:
setRect(getLegendArea(),new Rectangle(0,0,3300,3100)):
Or
you can change the last two coordinates to enlarge the legend:
setRect(getLegendArea(),new Rectangle(0,0,4300,4100)):